
Polars TA


Technical analysis indicators built on Polars expressions instead of pandas — including retail-standard indicators (RSI, MACD, Bollinger Bands, ...) and the market-microstructure/order-flow toolkit used on professional trading desks (VPIN, Kyle's lambda, Roll's spread, Yang-Zhang volatility, multi-scale Hurst regime detection).
📖 Full documentation: https://dante-berth.github.io/Polars_TA/ — see the changelog for notable changes.
Every indicator is a plain pl.Expr, so it composes naturally with .with_columns(...), works on both DataFrame and LazyFrame, and runs on Polars' multithreaded, vectorized engine — no row-by-row Python loops (aside from a couple of genuinely recursive indicators like KAMA and PSAR, which use map_batches).
Install
pip install tavector
The distribution is tavector; the import is polars_ta:
import polars_ta
or uv add tavector. Contributing? See Development.
The few genuinely sequential indicators (notably VPIN's volume-bucketing loop)
run a Numba-JIT-compiled kernel when the optional speed extra is installed,
and fall back to an identical pure-Python loop otherwise — same output either
way:
uv add "tavector[speed]"
Benchmarks
Six indicators (RSI-14, MACD, ATR-14, Bollinger upper, OBV, Stochastic %K), same parameters, same generated OHLCV data, best-of-5 wall time:
| Rows | polars_ta |
ta |
pandas_ta |
Speedup |
|---|---|---|---|---|
| 10K | 0.0009s | 0.0196s | 0.0080s | 21x |
| 100K | 0.0046s | 0.1751s | 0.0552s | 38x |
| 1M | 0.0428s | 1.7450s | 0.5253s | 41x |
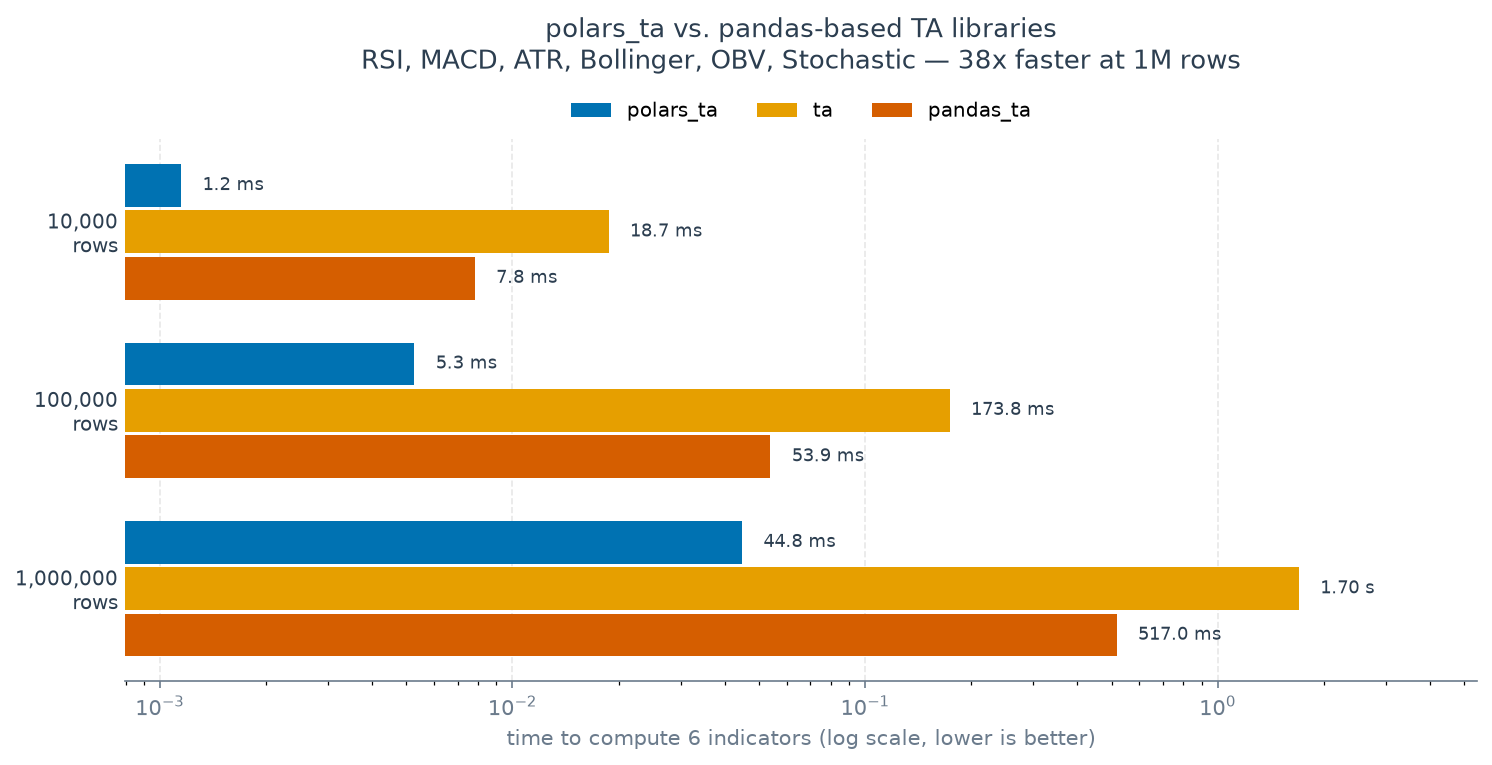
Reproduce it yourself — the script is in the repo:
uv pip install ta pandas-ta pandas
uv run python benchmarks/bench_vs_others.py
uv run python benchmarks/bench_vs_others.py --check   # verify we compute the same thing
What the numbers do and don't say. Timing starts after each library has its
native frame, so this measures indicator computation, not the pandas↔polars
boundary — if your data already lives in pandas, add the conversion cost. The
speedup column is against the slowest competitor. --check confirms five of
the six indicators match ta to float tolerance (1e-13 or exact); ATR is the
exception, differing ~1e-1 early and decaying to ~1e-4, because the two
libraries seed Wilder's smoothing differently and that EMA has a long memory.
Both converge to the textbook recursion. Measured on one machine — yours will
differ, which is why the script ships with the repo.
Quickstart
import polars as pl
from polars_ta import momentum, trend, volatility, volume

df = pl.read_csv("ohlcv.csv")  # columns: open, high, low, close, volume

out = df.with_columns(
    momentum.rsi("close").alias("rsi_14"),
    trend.macd("close").alias("macd"),
    volatility.average_true_range("high", "low", "close").alias("atr_14"),
    volume.on_balance_volume("close", "volume").alias("obv"),
)
Or use the native .ta expression namespace — every indicator is also a
method on the Polars expression that supplies its primary price input, so it
reads like built-in Polars and composes with .over(...):
import polars as pl
import polars_ta  # registers the .ta namespace on import

out = df.with_columns(
    pl.col("close").ta.rsi(14).alias("rsi_14"),
    pl.col("close").ta.macd().alias("macd"),
    pl.col("high").ta.average_true_range("low", "close").alias("atr_14"),
    pl.col("close").ta.on_balance_volume("volume").alias("obv"),
)
The calling expression is bound to the indicator's first input (close for
most, high for the high-anchored ones); the remaining columns are passed as
arguments. .ta and the free-function API are the same code — pick whichever
reads better.
See examples/quickstart.py for a fuller example, or run it directly:
uv run python examples/quickstart.py
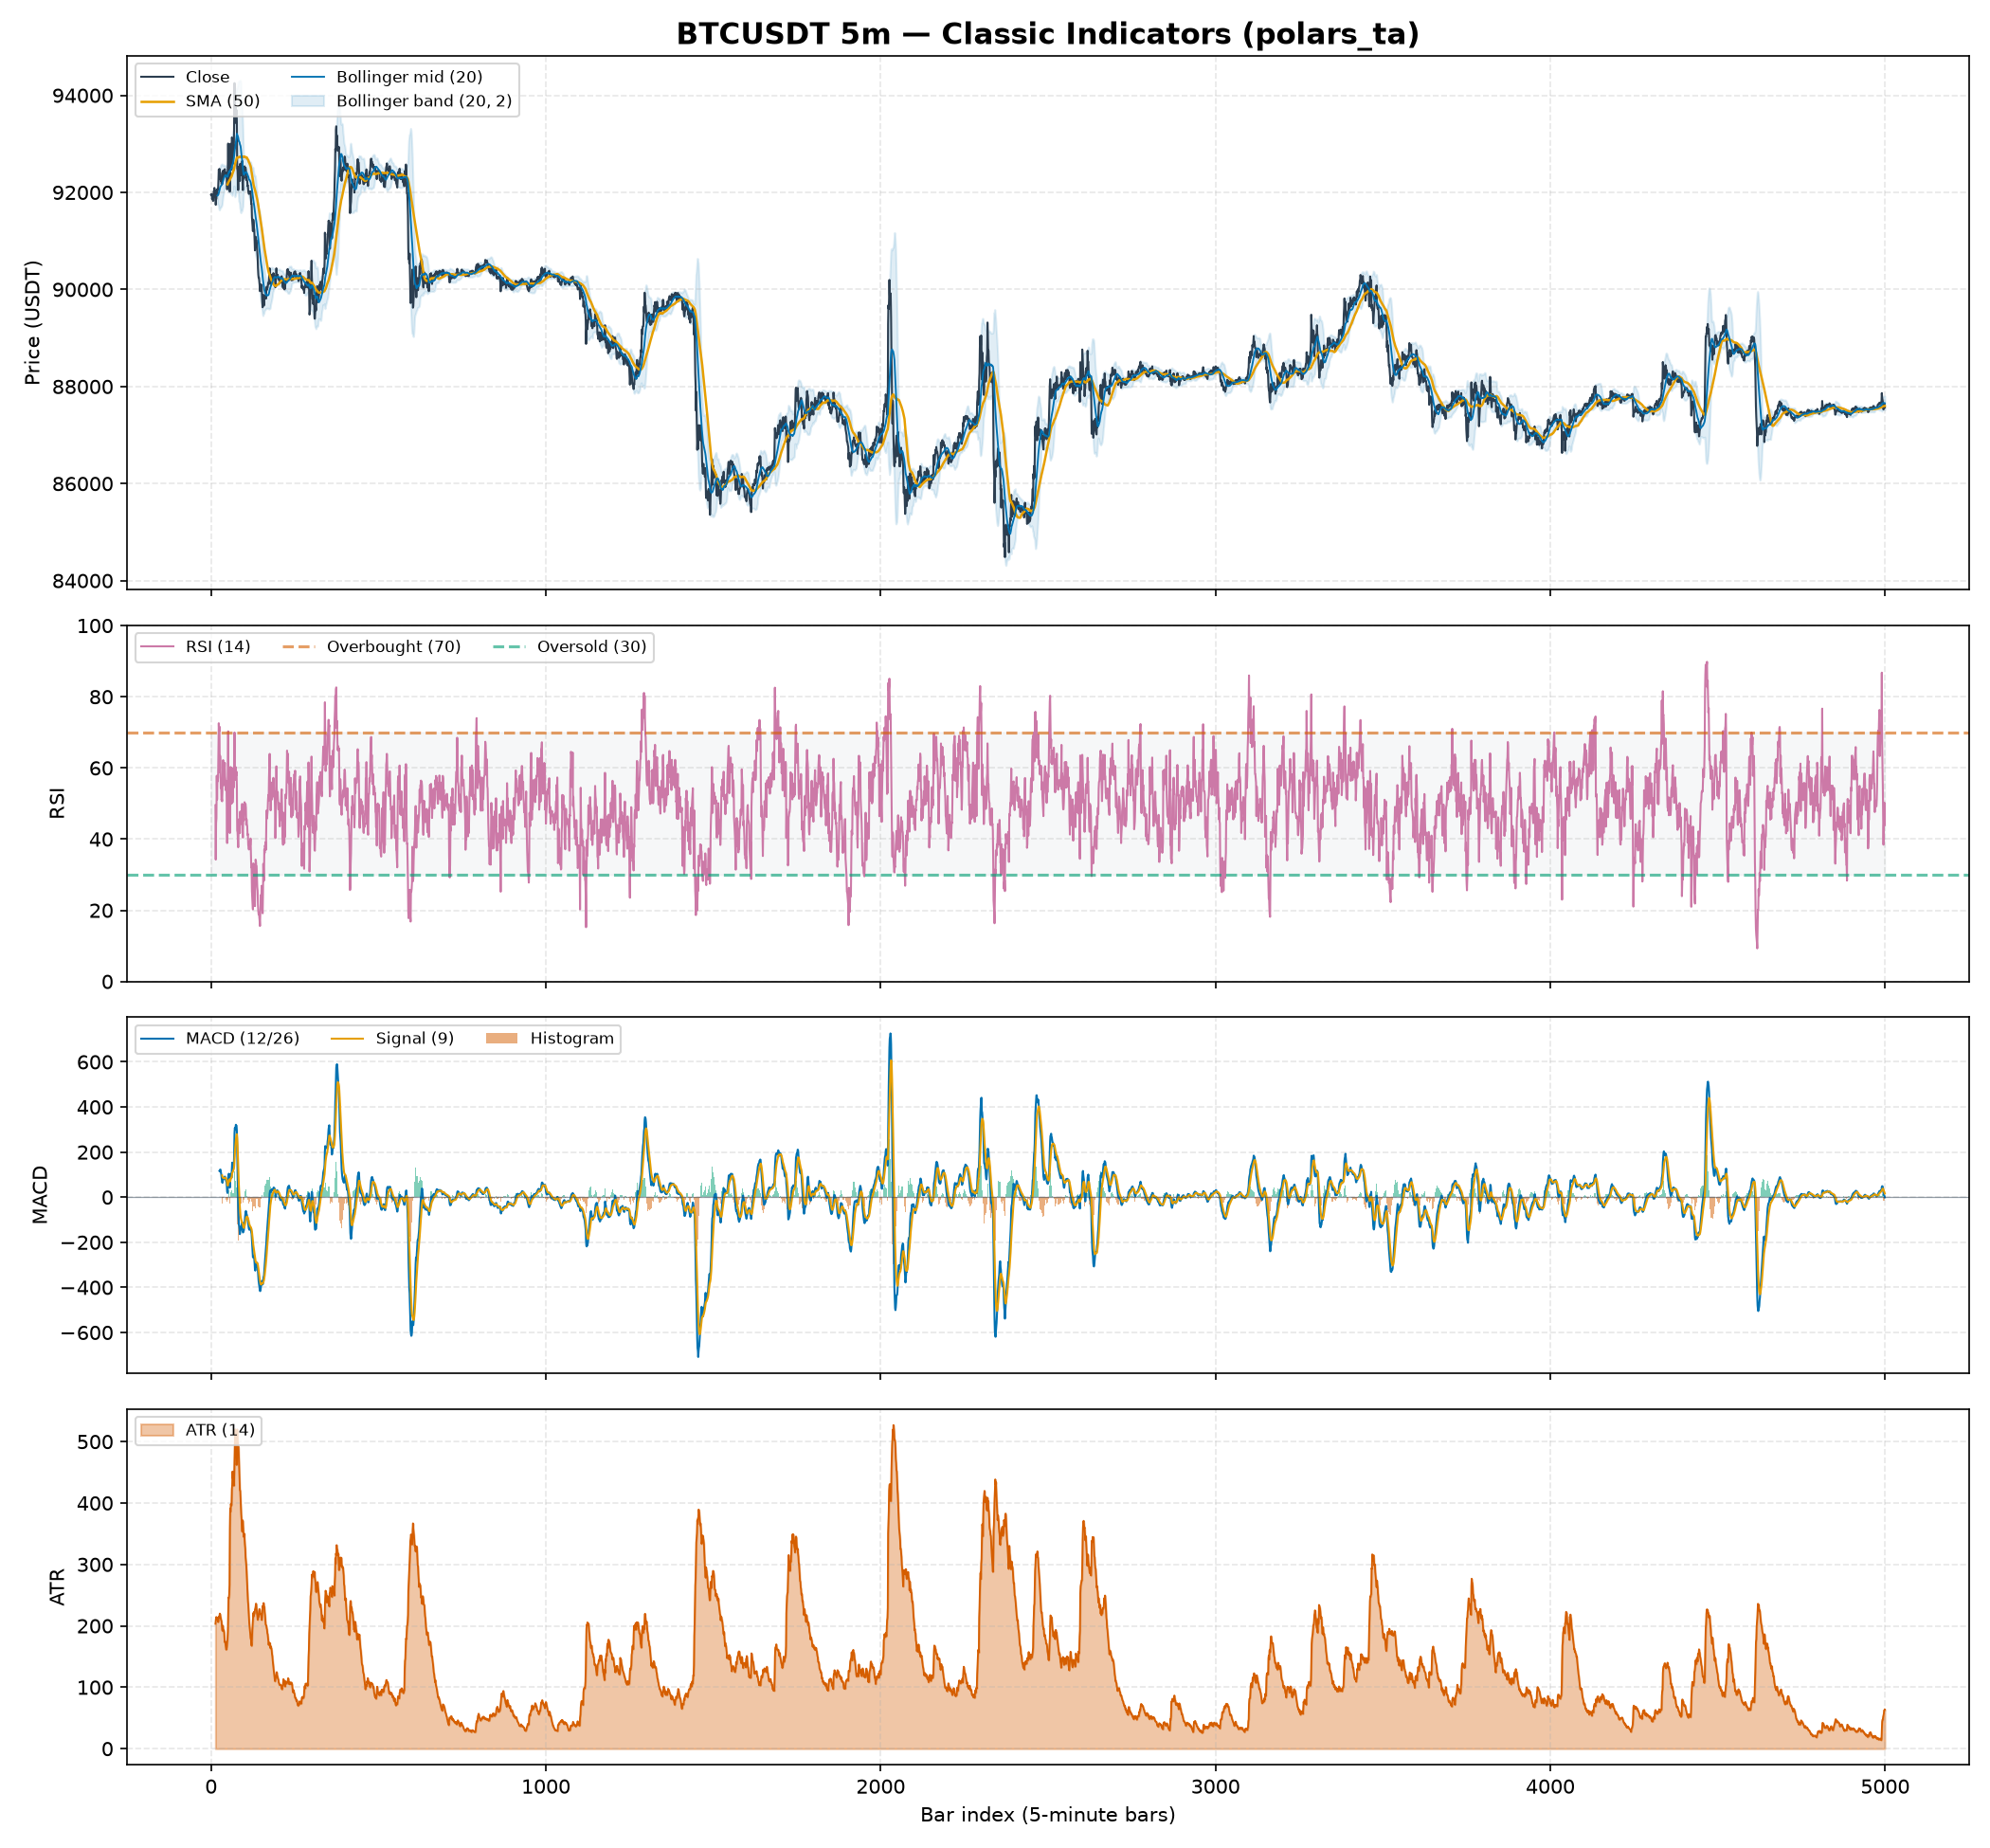
The classic retail toolkit — Bollinger Bands, RSI, MACD and ATR — plotted on real Binance BTCUSDT 5-minute data by examples/plot_classic_indicators.py:
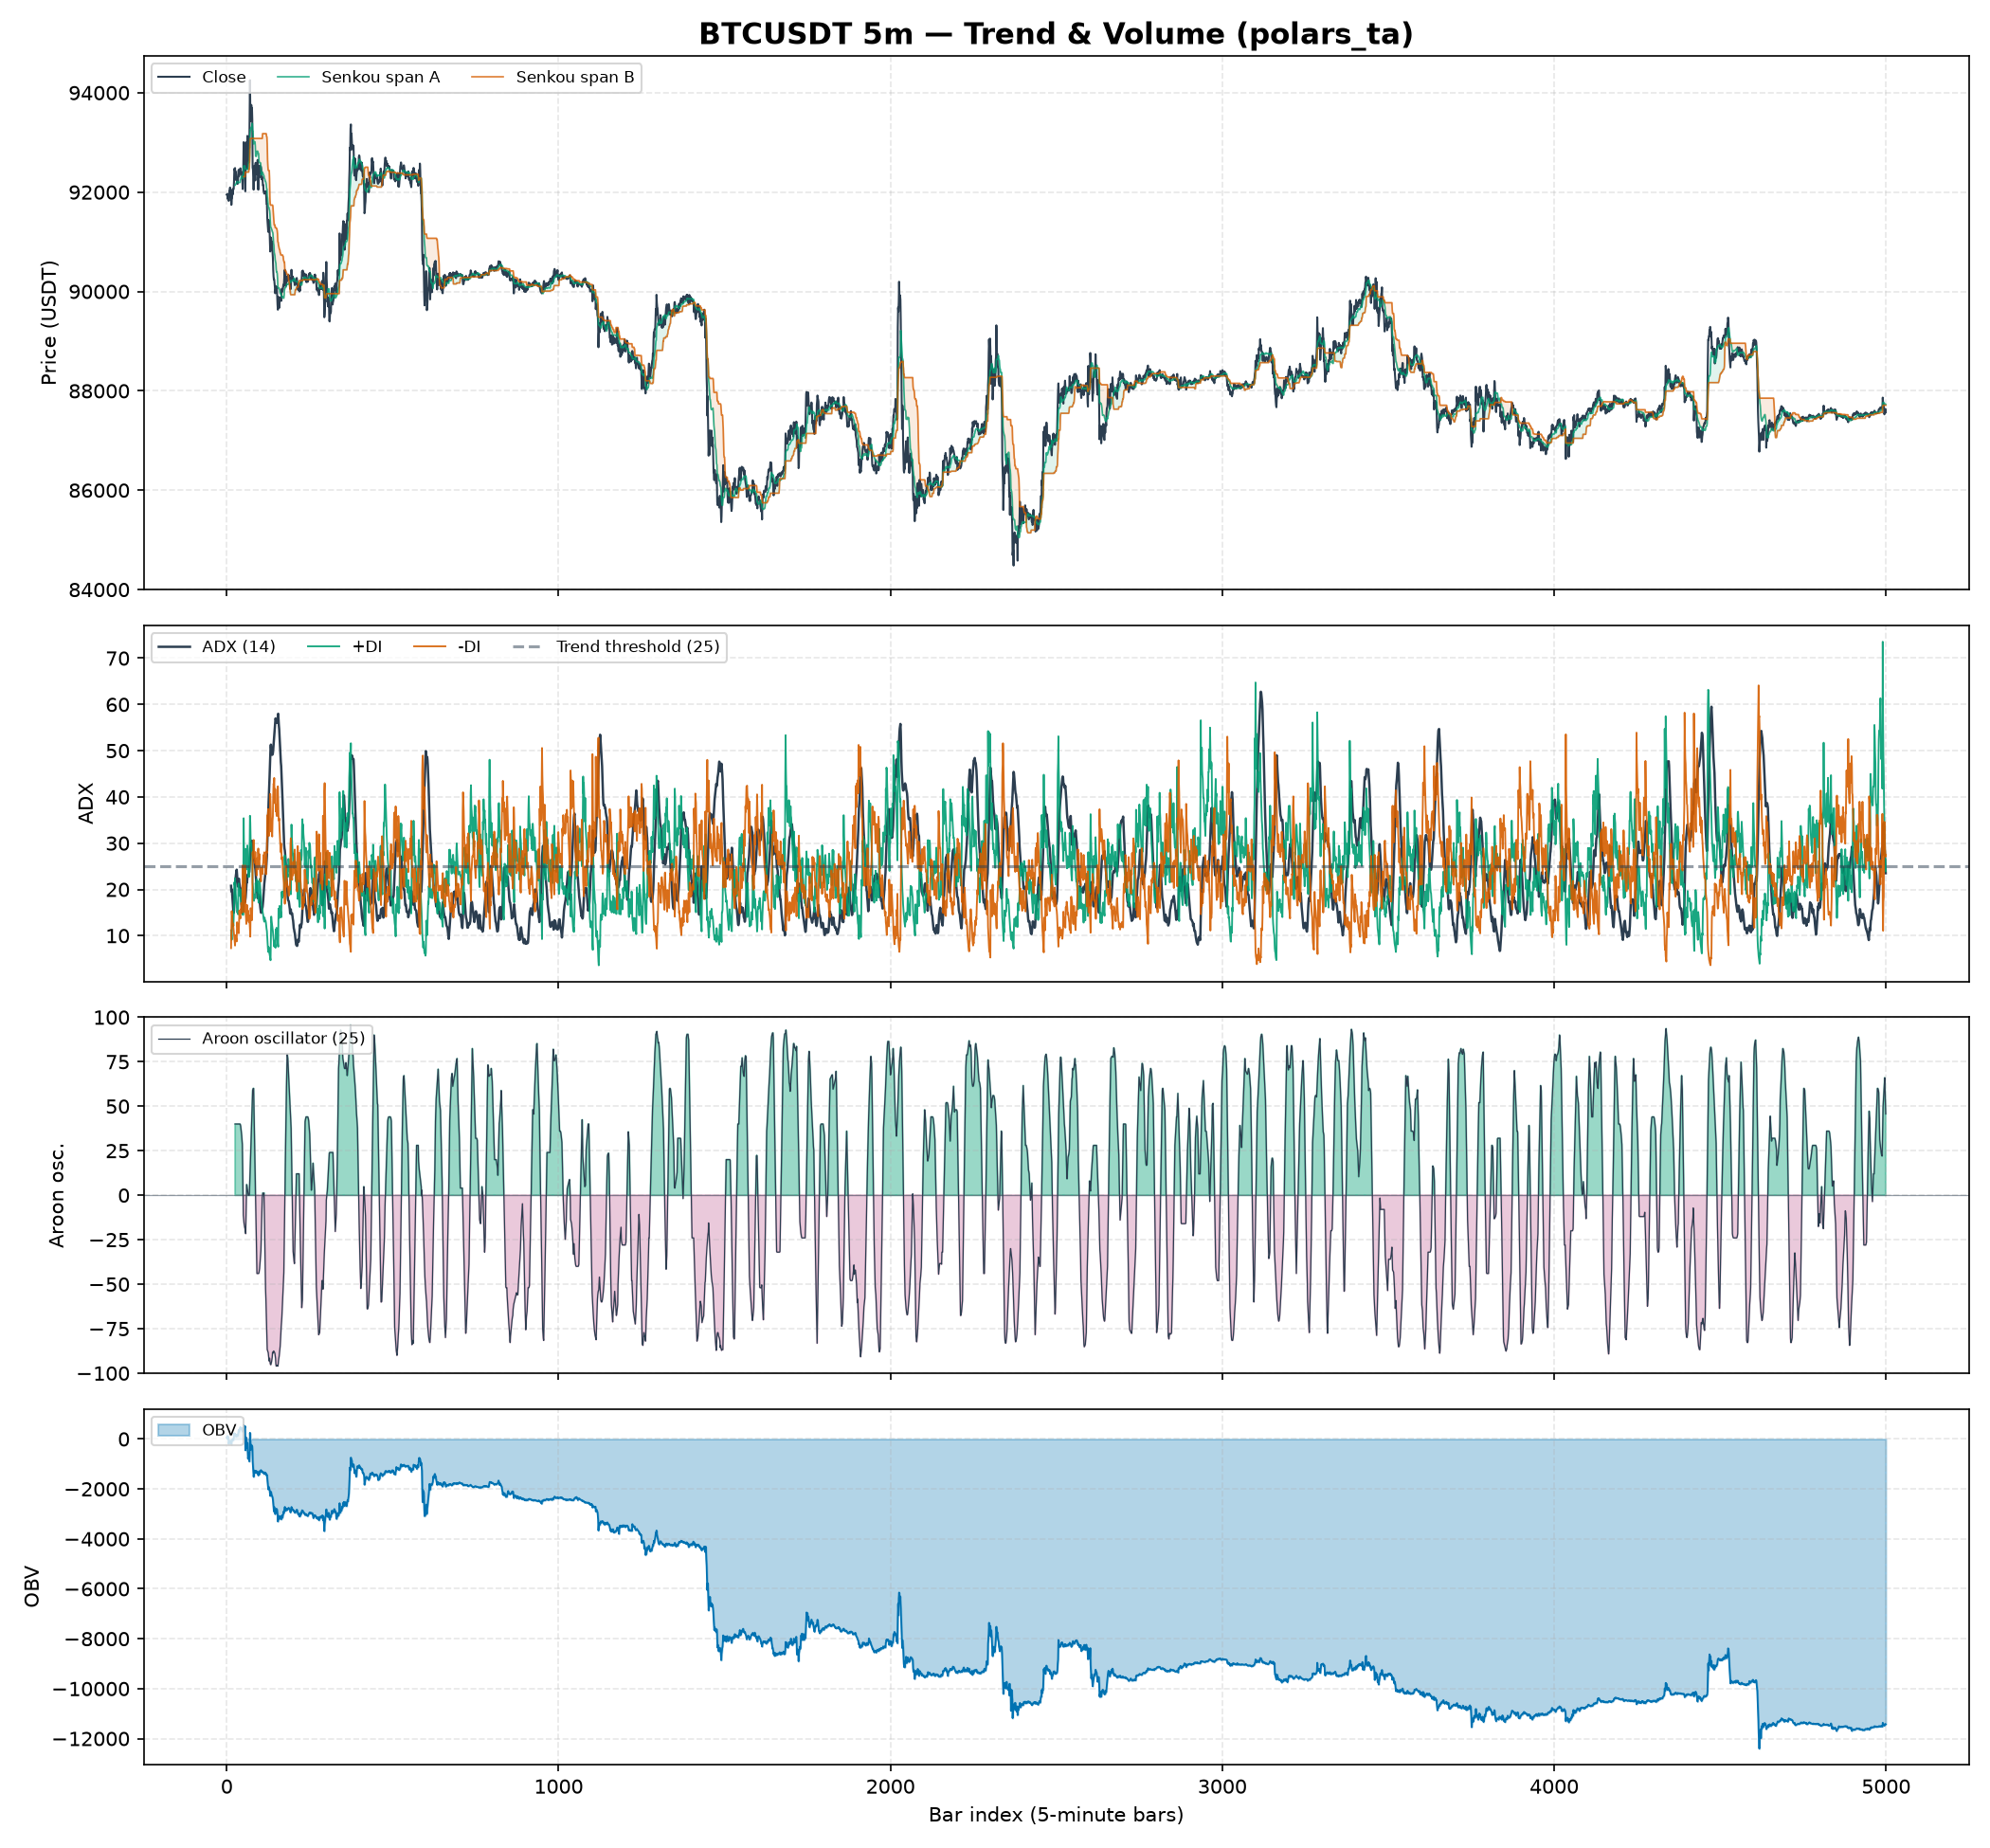
The trend & volume toolkit — Ichimoku cloud, ADX with +DI/-DI, Aroon oscillator and OBV — via examples/plot_trend_volume.py:
Modules
| Module | Contents |
|---|---|
polars_ta.momentum |
RSI, TSI, Stochastic (+ signal), Stochastic RSI, Ultimate Oscillator, Williams %R, KAMA, ROC, Momentum, Awesome Oscillator, APO, PPO, PVO, Balance of Power, Chande Momentum Oscillator, Fisher Transform |
polars_ta.trend |
SMA/EMA/WMA, DEMA/TEMA/TRIMA/T3, MACD, ADX (+DI/-DI, DX, ADXR, ±DM), Vortex, TRIX, Mass Index, CCI, DPO, KST, STC, Ichimoku, Aroon, Parabolic SAR, Hull Moving Average, SuperTrend, Elder Ray (Bull/Bear Power) |
polars_ta.volatility |
True Range, ATR, NATR (normalized ATR), Bollinger Bands, Keltner Channel, Donchian Channel, Ulcer Index |
polars_ta.volume |
ADI, Chaikin A/D Oscillator, OBV, Chaikin Money Flow, Force Index, Ease of Movement, VPT, NVI, Money Flow Index, VWAP, Klinger Volume Oscillator |
polars_ta.candles |
61 candlestick patterns — Doji, Hammer, Engulfing, Harami, Morning/Evening Star, Three White Soldiers, Three Black Crows, Marubozu, Piercing, Dark Cloud Cover, Hikkake, Abandoned Baby, … (definitions follow TA-Lib; returns 0 / ±100) |
polars_ta.others |
Daily return, daily log return, cumulative return, OHLC price transforms (average/median/typical/weighted-close price) |
polars_ta.calendar |
Day of week, weekend flag, hour/minute of day, time since midnight, month of year, month-end window, bars since session open |
polars_ta.quant |
Garman-Klass, Parkinson, Rogers-Satchell & Yang-Zhang volatility, EWMA (RiskMetrics) volatility, rolling z-score, volatility-adjusted momentum, micro-price proxy, rolling Sharpe/Sortino, historical volatility, Amihud illiquidity, multi-scale Hurst ribbon, relative volume, volatility z-score, cross-sectional rank/z-score, regime-conditional composite signal, rolling CVaR & Cornish-Fisher (modified) VaR, rolling max drawdown & Calmar, rolling skew/kurtosis, gain-to-pain & Jarque-Bera, fractional differentiation, rolling autocorrelation & information coefficient, rolling beta / idiosyncratic vol / downside beta, 12-1 momentum factor |
polars_ta.microstructure |
VPIN (order-flow toxicity), Roll's implied spread, Corwin-Schultz high-low spread, Kyle's lambda, Hasbrouck's lambda, effective spread, Lee-Ready trade-side classification, Hurst exponent (R/S), half-life of mean reversion, Lo-MacKinlay variance ratio, Shannon entropy, approximate entropy |
polars_ta.selection |
Feature selection — stationarity & sparsity screens, Spearman/Pearson correlation, VIF, mutual information & variation of information, Marchenko-Pastur denoising & detoning, signal/effective rank, clustering with silhouette-chosen k, one representative per cluster, block-permutation significance tests, and clustered MDA importance under purged K-fold. Not an expression API: takes a DataFrame, returns NumPy/Python |
Every function also has an equivalent staticmethod on a *Indicators class (MomentumIndicators, TrendIndicators, VolatilityIndicators, VolumeIndicators) if you prefer namespaced access.
Utilities:
polars_ta.utils.BaseIndicator— shared building blocks (sma,ema,true_range,check_fillna,get_min_max).polars_ta.utils.DataCleaner— detect and repair NaN/inf/null values in aDataFrame(dropna,get_invalid_indices,approximate_invalid_values).
Conventions
- Column arguments accept either a column name (
str) or an existingpl.Expr— uniformly, across every indicator (enforced by the test suite). - Every indicator is also reachable via the
.taexpression namespace:pl.col("close").ta.rsi(14). The calling expression fills the indicator's first input; the rest are passed as arguments. It's the same code as the free functions — a thin, byte-for-byte-identical dispatch layer — so.over(...)and streaming work through it unchanged. (Cross-sectional and regime-composite helpers, which don't take a single price series, stay free-function-only.) - Every numeric indicator takes a
fillna: bool = Falseflag. WhenTrue, gaps are forward-filled (and back-filled/defaulted at the start) instead of left as nulls. (Two exceptions: the candlestick patterns return a discrete0 / ±100classification, where forward-filling would invent patterns that never occurred; and the OHLC price transforms are pure per-bar arithmetic with no warm-up to fill.) - Indicators are pure expressions with no side effects — nothing is evaluated until you call
.collect()or use them inside.with_columns(...). - Every indicator also works with Polars' streaming engine (
.collect(engine="streaming")) for datasets larger than memory. - An indicator that needs
kbars of history returns null for its firstk-1rows (the warm-up) — never a fabricated number — and every indicator supports per-symbol computation on multi-asset frames via.over("symbol")with no state leaking across symbols (both properties are enforced by the test suite). polars_ta.selectionis the one deliberate exception to all of the above: picking features is a cross-feature question that needs the whole materialized matrix, so it takes aDataFrameand returns NumPy arrays and plain Python objects. It is not lazy, not streaming-safe, and not on the.tanamespace.
Which features should I actually use?
With 200+ indicators available, the useful question stops being "what else can I compute?" and becomes "which of these are actually different from each other?" polars_ta.selection answers it — screen for stationarity, correlate, denoise the correlation matrix with Marchenko-Pastur eigenvalue clipping, cluster on the correlation distance, and keep one representative per cluster:
from polars_ta import selection

result = selection.select_features(feats, FEATURES)
print(result.effective_rank, "of", len(result.names))  # 5.66 of 16
print(result.selected)                                 # ['rsi_21', 'vol_21']
Sixteen indicators on real BTCUSDT 5m data collapse to roughly four to six dimensions. Then check that the structure is real rather than an artefact of autocorrelation, and rank what is left against an actual target under purged cross-validation:
# Marchenko-Pastur assumes i.i.d. rows; rolling indicators are ~0.99
# autocorrelated, so test the count against a null that keeps that.
test = selection.permutation_test(
    screened.values,
    lambda v: float(np.linalg.eigvalsh(selection.corr_matrix(v))[-1]),
    block_size=250,
)
print(test.observed, test.null_mean, test.p_value)  # 6.07  1.54  0.008

importance = selection.clustered_mda(
    scored, result.names, "fwd_ret", labels=result.labels,
    label_horizon=12, embargo=100,
)
See the how-to guide for the full walkthrough, and the case study for why signal_rank on its own over-claims.
Development
uv sync --group dev
uv run pytest        # unit + numerical reference tests
uv run ruff check .  # lint
uv run ruff format . # format
The test suite enforces four kinds of guarantee:
tests/test_reference.py— cross-checks indicators (RSI, EMA, MACD, SMA, ATR, ADX, Bollinger Bands, Stochastic, Williams %R, ROC, CCI, OBV, MFI) against independent NumPy reference implementations.tests/test_properties.py— Hypothesis property tests: length preservation, no NaN/inf leakage, and causality (no lookahead).tests/test_multi_asset.py—.over("symbol")on a multi-asset frame matches computing each symbol separately.tests/test_warmup.py— warm-up rows are null (never fabricated values), and no nulls appear after warm-up on clean data.
Engine benchmarks
Separately from the cross-library comparison above,
benchmarks/bench_indicators.py times a bundle of ~12 indicators across the
eager, lazy, and streaming Polars engines at 10K/100K/1M rows:
uv run python benchmarks/bench_indicators.py
Professional-desk features and real-data example
polars_ta.microstructure and the newer parts of polars_ta.quant implement order-flow and regime-detection tools that retail TA libraries typically don't cover: VPIN, Kyle's/Hasbrouck's lambda, Roll's implied spread, Yang-Zhang volatility, and a multi-scale Hurst ribbon. These are tested against tests/fixtures/btcusdt_5m_sample.arrow — a 5,000-row slice of real Binance BTCUSDT 5-minute OHLCV data — rather than synthetic noise, since the whole point of these indicators is behavior on real market microstructure.
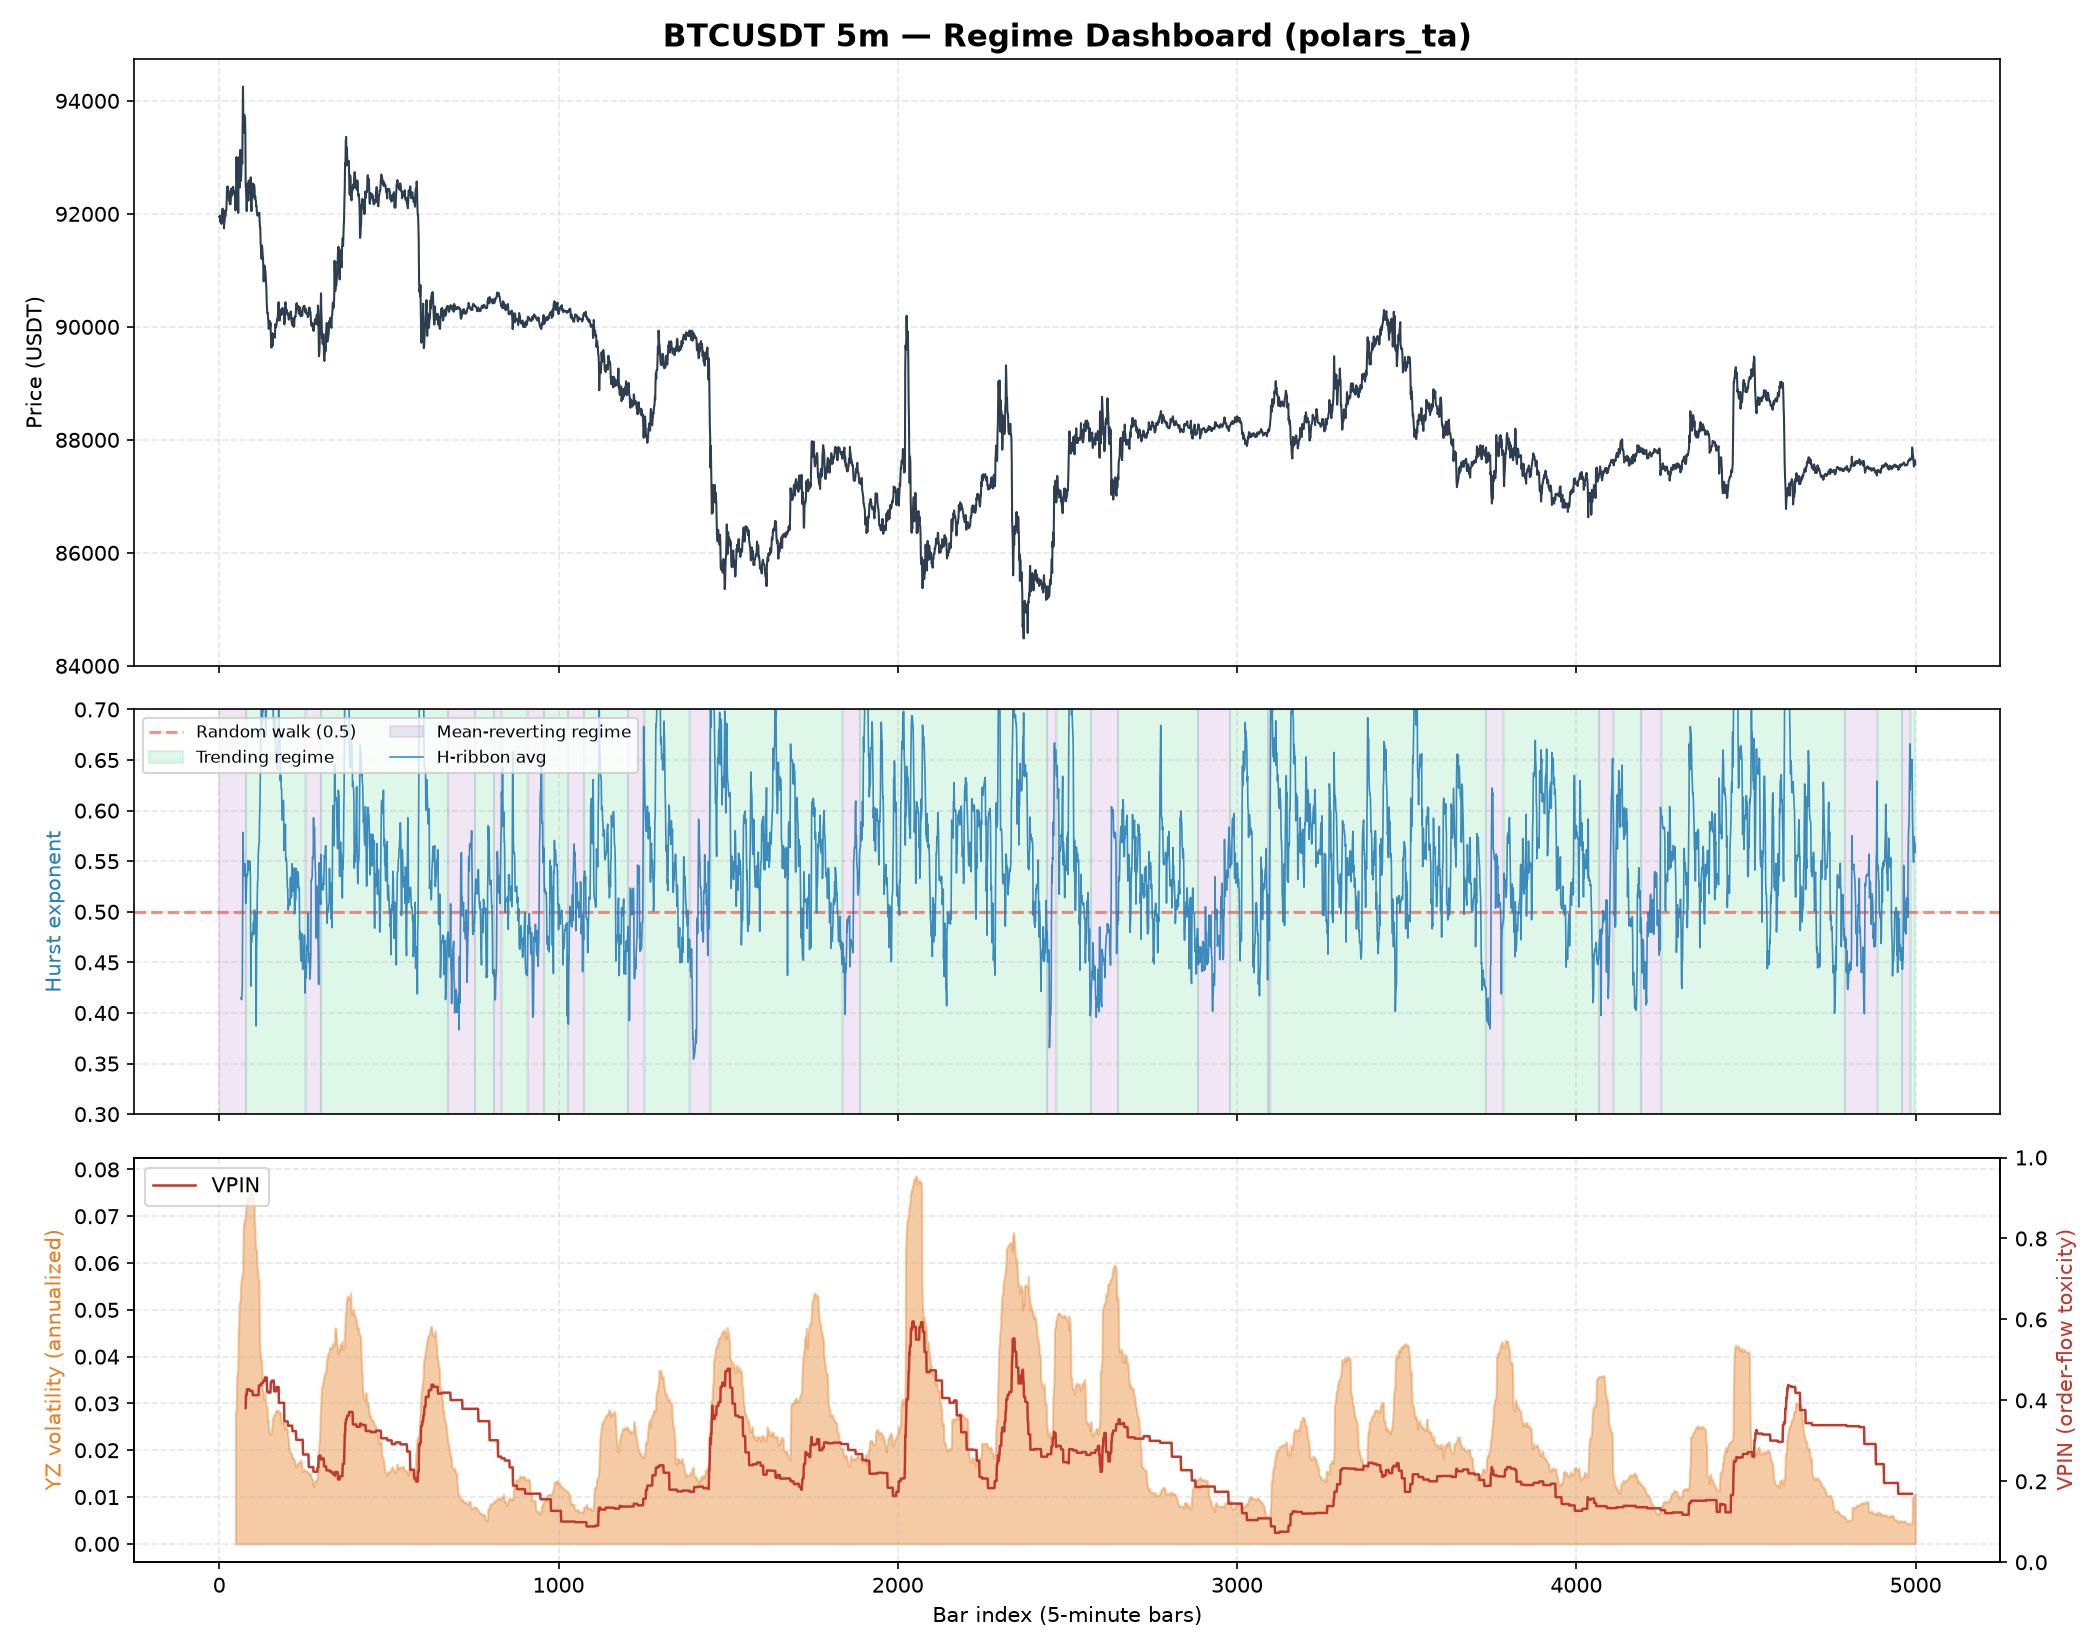
uv run python examples/plot_regime_dashboard.py
Renders a 3-panel dashboard (price, Hurst-ribbon regime shading, Yang-Zhang volatility + VPIN) to examples/regime_dashboard.png — a visual sanity check a human can actually read, not just a table of numbers.
The liquidity/microstructure toolkit — Roll vs Corwin-Schultz spread, Kyle's lambda and mean-reversion half-life — via examples/plot_liquidity.py:
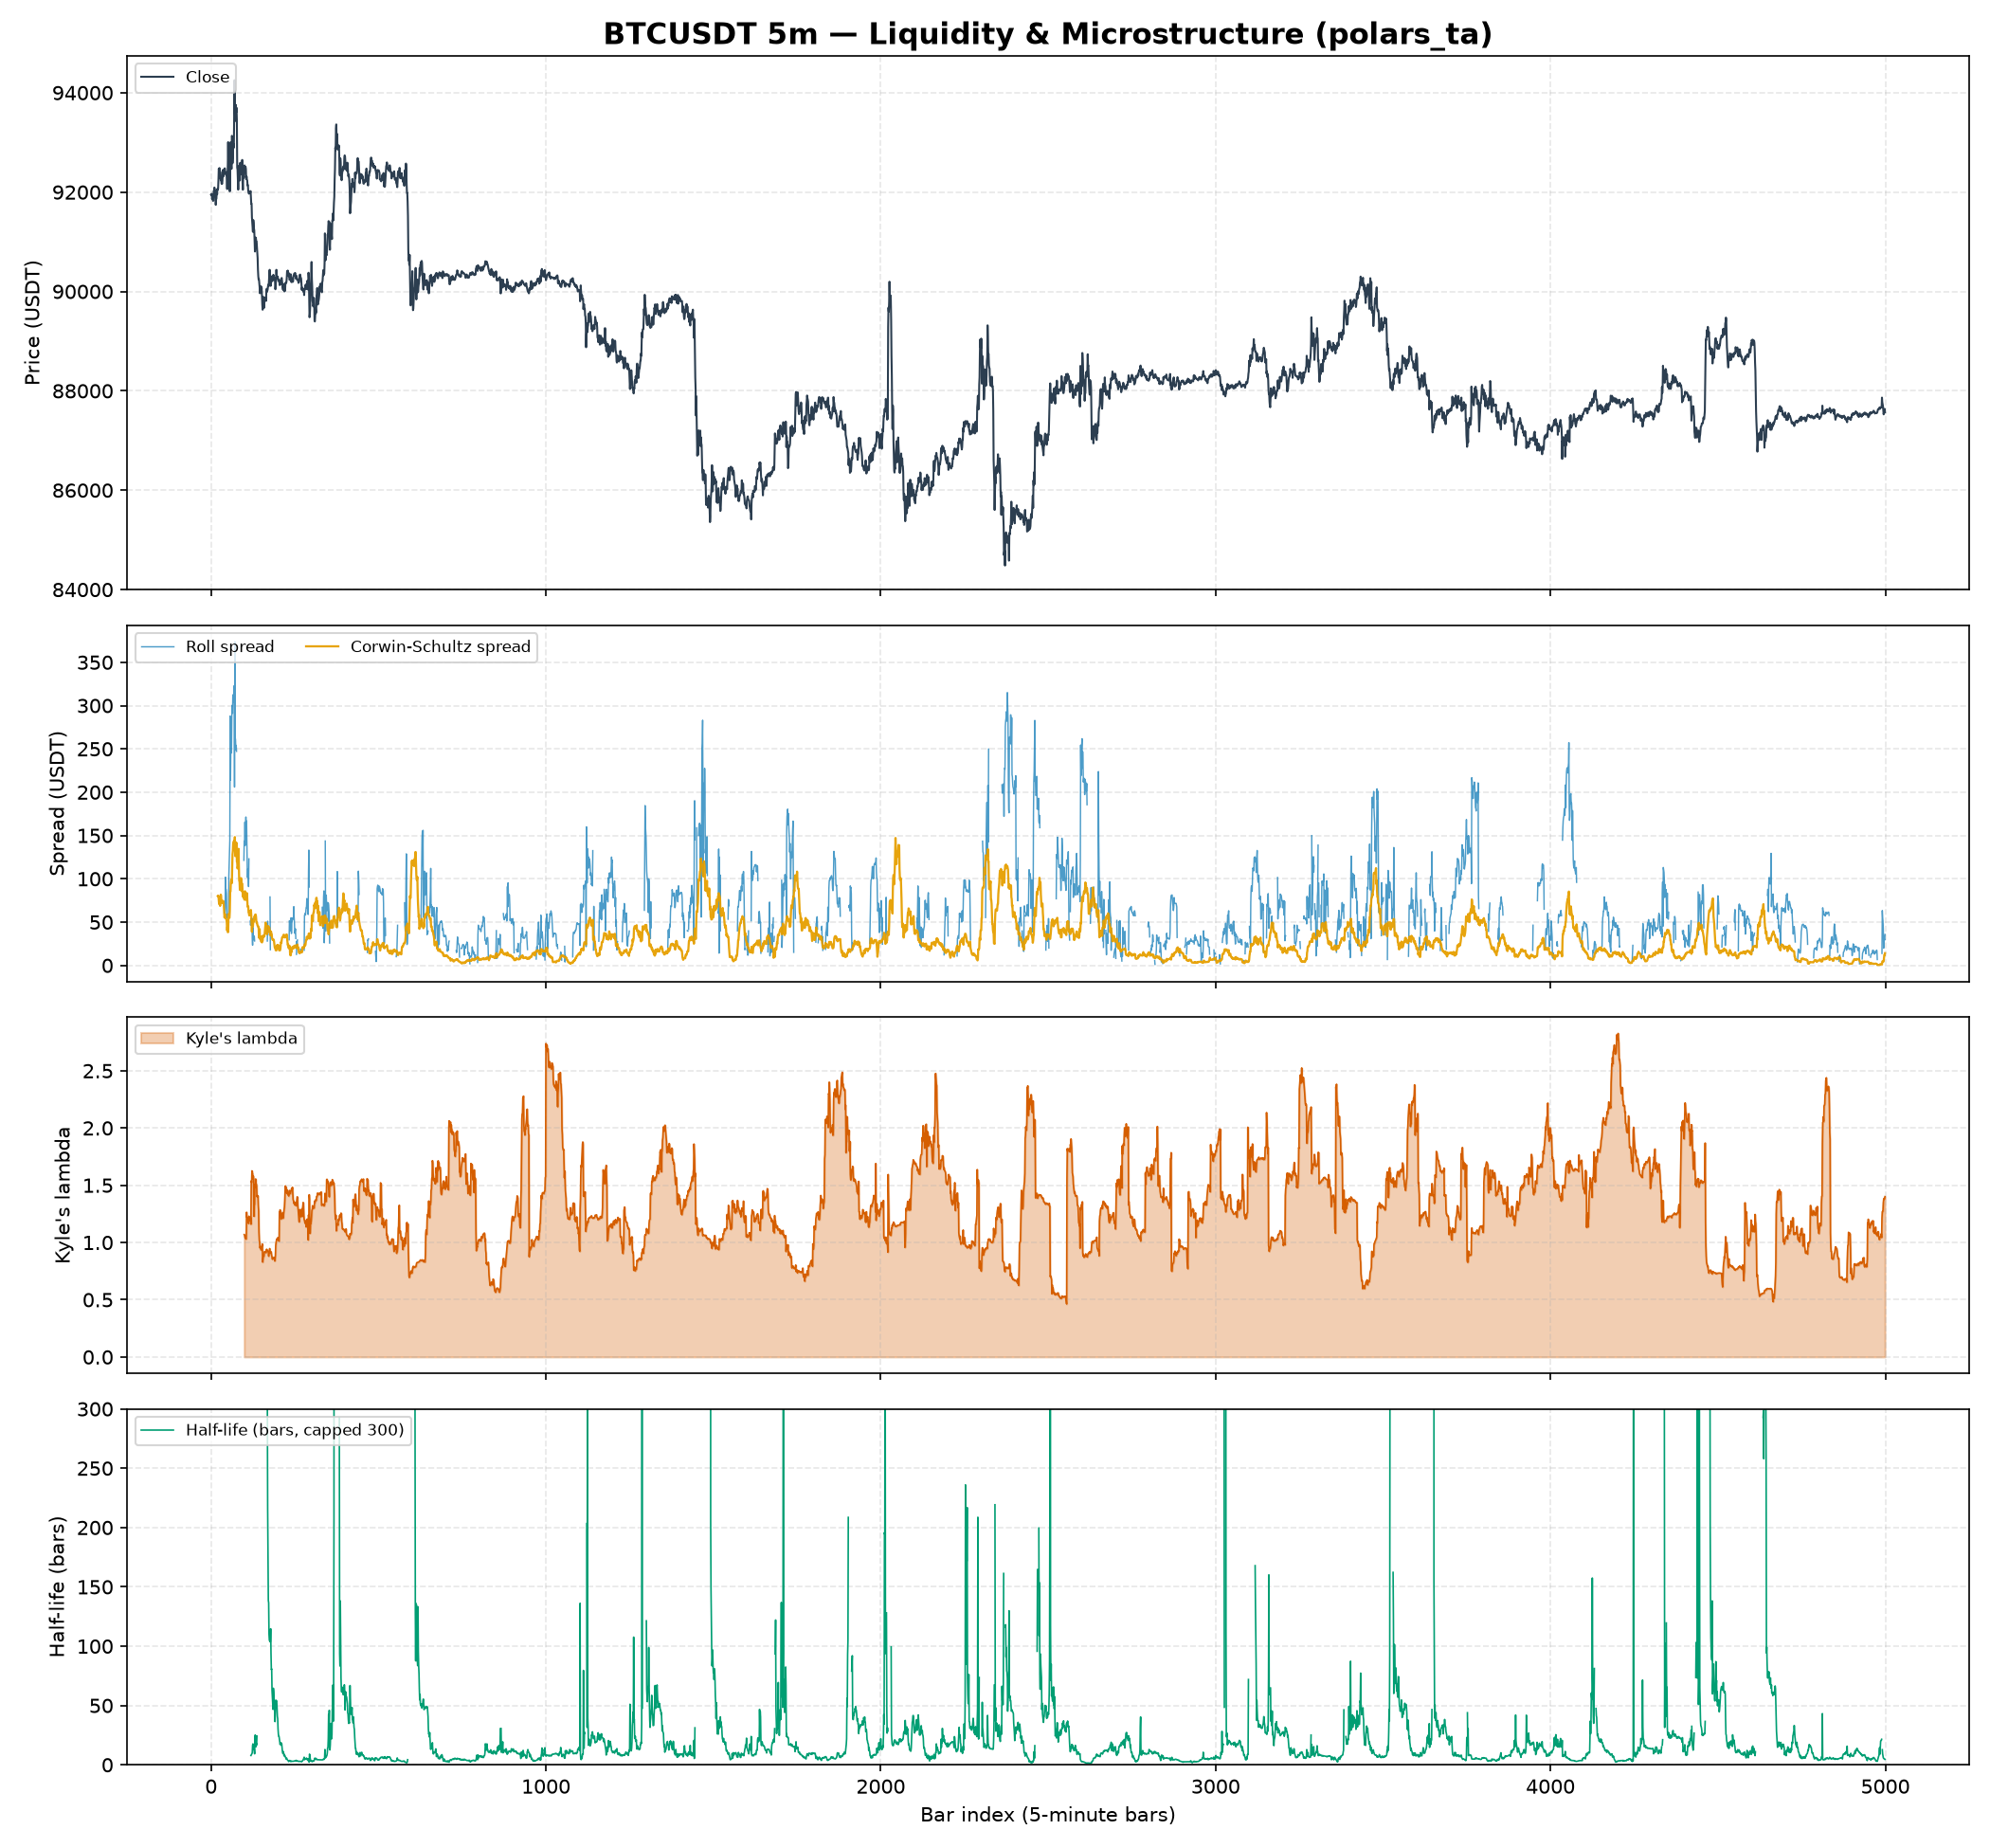
All of the figures above are committed to the repo and regenerable from a single command — run it after changing an indicator to refresh both the examples/ copies and the docs/assets/ copies embedded here:
uv run python examples/generate_all_figures.py
Documentation site
The docs at https://dante-berth.github.io/Polars_TA/ are built with MkDocs Material + mkdocstrings, following the Diátaxis framework (getting started / concepts / how-to guides / examples / API reference), and deploy automatically to GitHub Pages on every push to main via .github/workflows/docs.yml.
To preview locally:
uv sync --extra docs
uv run mkdocs serve
1 maintainer

Download files
Download the file for your platform. If you're not sure which to choose, learn more about installing packages.
Source Distribution
Built Distribution
Filter files by name, interpreter, ABI, and platform.
If you're not sure about the file name format, learn more about wheel file names.
Copy a direct link to the current filters
File details
Details for the file tavector-0.2.0.tar.gz.
File metadata
- Download URL: tavector-0.2.0.tar.gz
- Upload date:
- Size: 156.1 kB
- Tags: Source
- Uploaded using Trusted Publishing? Yes
- Uploaded via: twine/7.0.0 CPython/3.13.14
File hashes
| Algorithm | Hash digest | |
|---|---|---|
| SHA256 |
1053834bc7a84ebe417b05e532242f7de0a796325cbc158a4317fdcaf60734fe
|
|
| MD5 |
c1ea23ed7ca7ada8e30f9f427cdddddc
|
|
| BLAKE2b-256 |
0ec0f8feeffba0fcca05041ede757471581cee6b20e6cb1964641b67524a6987
|
Provenance
The following attestation bundles were made for tavector-0.2.0.tar.gz:
Publisher:
publish.yml on Dante-Berth/Polars_TA
-
Statement:
-
Statement type:
https://in-toto.io/Statement/v1 -
Predicate type:
https://docs.pypi.org/attestations/publish/v1 -
Subject name:
tavector-0.2.0.tar.gz -
Subject digest:
1053834bc7a84ebe417b05e532242f7de0a796325cbc158a4317fdcaf60734fe - Sigstore transparency entry: 2329439907
- Sigstore integration time:
-
Permalink:
Dante-Berth/Polars_TA@2799daa6d2c38c4b83a55ccf744ebc399fc27270 -
Branch / Tag:
refs/tags/v0.2.0 - Owner: https://github.com/Dante-Berth
-
Access:
public
-
Token Issuer:
https://token.actions.githubusercontent.com -
Runner Environment:
github-hosted -
Publication workflow:
publish.yml@2799daa6d2c38c4b83a55ccf744ebc399fc27270 -
Trigger Event:
release
-
Statement type:
File details
Details for the file tavector-0.2.0-py3-none-any.whl.
File metadata
- Download URL: tavector-0.2.0-py3-none-any.whl
- Upload date:
- Size: 102.4 kB
- Tags: Python 3
- Uploaded using Trusted Publishing? Yes
- Uploaded via: twine/7.0.0 CPython/3.13.14
File hashes
| Algorithm | Hash digest | |
|---|---|---|
| SHA256 |
f815381f631169d4b58a27bc78771a261882081a54f49fb75a3db39d95506e88
|
|
| MD5 |
751f494576fdd7a1a6011d166ae6534f
|
|
| BLAKE2b-256 |
37909a2ea00fcea946c7bccec1fe97767a1f5099d26ade04323beee871d686b3
|
Provenance
The following attestation bundles were made for tavector-0.2.0-py3-none-any.whl:
Publisher:
publish.yml on Dante-Berth/Polars_TA
-
Statement:
-
Statement type:
https://in-toto.io/Statement/v1 -
Predicate type:
https://docs.pypi.org/attestations/publish/v1 -
Subject name:
tavector-0.2.0-py3-none-any.whl -
Subject digest:
f815381f631169d4b58a27bc78771a261882081a54f49fb75a3db39d95506e88 - Sigstore transparency entry: 2329439932
- Sigstore integration time:
-
Permalink:
Dante-Berth/Polars_TA@2799daa6d2c38c4b83a55ccf744ebc399fc27270 -
Branch / Tag:
refs/tags/v0.2.0 - Owner: https://github.com/Dante-Berth
-
Access:
public
-
Token Issuer:
https://token.actions.githubusercontent.com -
Runner Environment:
github-hosted -
Publication workflow:
publish.yml@2799daa6d2c38c4b83a55ccf744ebc399fc27270 -
Trigger Event:
release
-
Statement type:







