A Toolbox for the Evaluation of Explanations

Project description

teex: a toolbox for evaluating XAI explanations


A Python toolbox for the evaluation of machine learning explanations.
This project aims to provide a simple way of evaluating individual black box explanations against ground truth. Moreover, it contains a collection of easy-to-access datasets with available g.t. explanations.
Installation
The teex package is on PyPI. To install it, simply run
pip install teex
teex is compatible with Python 3.8 and 3.9.
Documentation
teex's documentation, in-depth examples and API reference can be found on Read The Docs.
Usage overview
teex is divided into subpackages, one for each explanation type. Each subpackage contains two modules, focused on two
distinct functionalities:
- eval: contains evaluation methods for that particular explanation type. For every subpackage, there is one high-level function to easily compute all the available metrics for an arbitrary number of explanations.
- data: contains data classes with available g.t. explanations of that particular explanation type, both synthetic and real. All of them are objects that need to be instanced and, when sliced, will return the data, the target and the ground truth explanations, respectively.
Evaluation (with feature importance as an example)
What are feature importance vectors? They are vectors with one entry per feature. Each entry contains a weight that represents a feature's importance for the observation's outcome. Weights are usually in the range $[-1, 1]$.
Suppose that we have a dataset with available g.t. explanations (gtExps) and a model trained with it (model):
from teex.featureImportance.eval import feature_importance_scores

# get individual feature importance explanations with any method
predictedExps = get_explanations(model, X)

# evaluate predicted explanations against ground truths
feature_importance_scores(gtExps, predictedExps, metrics=['fscore', 'cs', 'auc'])
This basic syntax is followed by the main evaluation APIs of all 4 explanation types:
- Feature Importance:
feature_importance_scores - Saliency Maps:
saliency_map_scores - Decision Rules:
rule_scores - Word Importance:
word_importance_scores
Other functionalities are included in each evaluation module. More about each explanation type can be found in the example notebooks and the documentation.
Metrics supported:
Metrics available as of v1.0.0 are
- Feature Importance
- Cosine Similarity: similarity between the two vectors is measured in an inner product space in terms of orientation.
- ROC AUC: where the ground truth is binarized in order for it to represent a class and the predicted vector entries are interpreted as classification scores or likelihood.
- F1 Score: where both ground truth and prediction are binarized according to a user-defined threshold.
- Precision: g.t. and prediction treated as in F1 Score
- Recall: g.t. and prediction treated as in F1 Score
- Saliency Maps
- Same metrics as in feature importance. Each pixel in an image is considered to be a feature.
- Decision Rules
- Complete Rule Quality: Proportion of lower and upper bounds in a rule explanation whose that are $\epsilon$-close to the respective lower and upper bounds (same feature) in the ground truth rule explanation amongst those that are not infinity.
- All metrics in feature importance, where a transformation of the rule into feature importance vectors is performed first. See doc. for details.
- Word Importance:
- All metrics in feature importance, where a vocabulary is considered the feature space and a word importance explanation may or may not contain words from the vocabulary.
Note how in teex, feature importance vectors are a universal representation: we 'translate' all other explanation types to feature importance vectors to allow a wider metric space.
Data
teex also provides an easy way to get and use data with available ground truth explanations. It contains real datasets and can generate synthetic ones. All of them are instanced as objects, and can be sliced as usual. For example:
from teex.saliencyMap.data import Kahikatea
X, y, exps = Kahikatea()[:]
downloads and assigns data from the Kahikatea dataset:
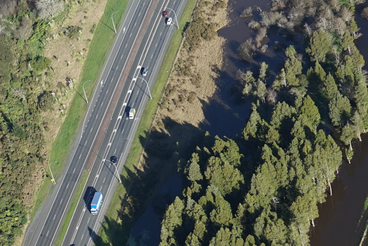
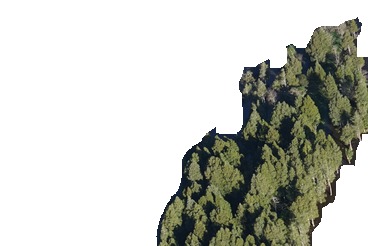
Fig. 1 A Kahikatea dataset sample.
Other datasets, such as CUB-200-2011 and the Oxford-IIIT Pet Dataset, are available on teex, with over 19000 images and 230 distinct classes:
   from teex.saliencyMap.data import CUB200
   X, y, exps = CUB200()[:]


Fig. 2 A CUB-200-2011 dataset sample.
   from teex.saliencyMap.data import OxfordIIIT
   X, y, exps = OxfordIIIT()[:]


Fig. 3 An Oxford-IIIT Pet Dataset sample.
Synthetic datasets can also be easily generated:
from teex.saliencyMap.data import SenecaSM
X, y, exps = SenecaSM()[:]
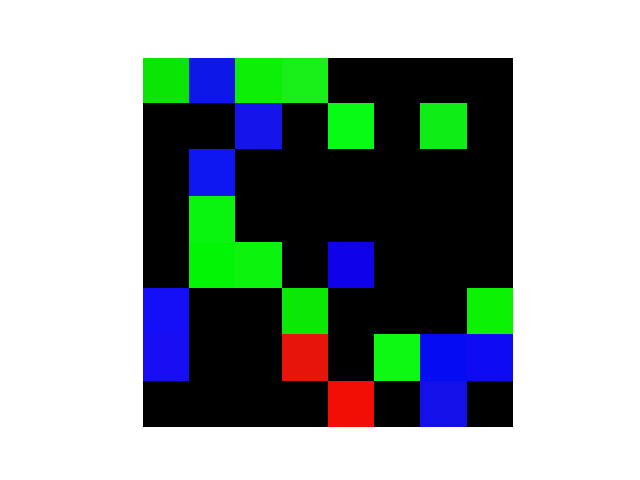

Fig. 4 Artificial image and its g.t. saliency map explanation.
Datasets for all other explanation types are available too.
Tutorials and demos
Saliency maps
- Improving model selection with explanation quality
- Retrieving image data with g.t. saliency map explanations
- Evaluating Captum saliency map explanations
Feature importance vectors
- Retrieving tabular data with g.t. feature importance explanations
- Evaluating LIME feature importance explanations
Decision rules
Word importance vectors
- Retrieving language data with g.t. word importance explanations
- Evaluating word importance explanations
Contributing
There is still work to do and we would really appreciate your help. Before contributing to teex, please take a moment to read the manual.
Acknowledgements
This work has been made possible by the University of Waikato under the scope of the TAIAO project.


Release history Release notifications | RSS feed


Download files
Download the file for your platform. If you're not sure which to choose, learn more about installing packages.
Source Distribution
Built Distribution
Filter files by name, interpreter, ABI, and platform.
If you're not sure about the file name format, learn more about wheel file names.
Copy a direct link to the current filters
File details
Details for the file teex-1.1.3.tar.gz.
File metadata
- Download URL: teex-1.1.3.tar.gz
- Upload date:
- Size: 50.3 kB
- Tags: Source
- Uploaded using Trusted Publishing? No
- Uploaded via: twine/4.0.2 CPython/3.9.6
File hashes
| Algorithm | Hash digest | |
|---|---|---|
| SHA256 |
6c6aa677497c6a3ad36dce8fd4a0f631269fa95cb61f03eb6347d15d2e8e0032
|
|
| MD5 |
31882ce2d324c0fbc83f91325427558b
|
|
| BLAKE2b-256 |
c059c48b66552d6fbaac8a950a1cc7102237a9e8db703fbe2cfa3e162644ce74
|
File details
Details for the file teex-1.1.3-py3-none-any.whl.
File metadata
- Download URL: teex-1.1.3-py3-none-any.whl
- Upload date:
- Size: 57.2 kB
- Tags: Python 3
- Uploaded using Trusted Publishing? No
- Uploaded via: twine/4.0.2 CPython/3.9.6
File hashes
| Algorithm | Hash digest | |
|---|---|---|
| SHA256 |
6c32cfa187336ad25fe9c3be7184a7fd7d136721cbc05bffa43b4522a278435d
|
|
| MD5 |
20540fee06079579faba030d639cf0ff
|
|
| BLAKE2b-256 |
afca66eeaae88f0d7e80fa6b12e199849fac64c54792b4a163da4cf3c6c1861c
|


