
No project description provided

Project description
TempNetViz
TempNetViz is an interactive GUI designed for exploring, analyzing, and visualizing temporal graphs i.e. graphs that evolve over time. This readme provides the essential information for the usage of TempNetViz, for more details see the documentation.
Installation & usage
You can install TempNetViz with pip using:
pip install tempnetviz
To start the GUI:
python -m tempnetviz.main_gui
Quickstart
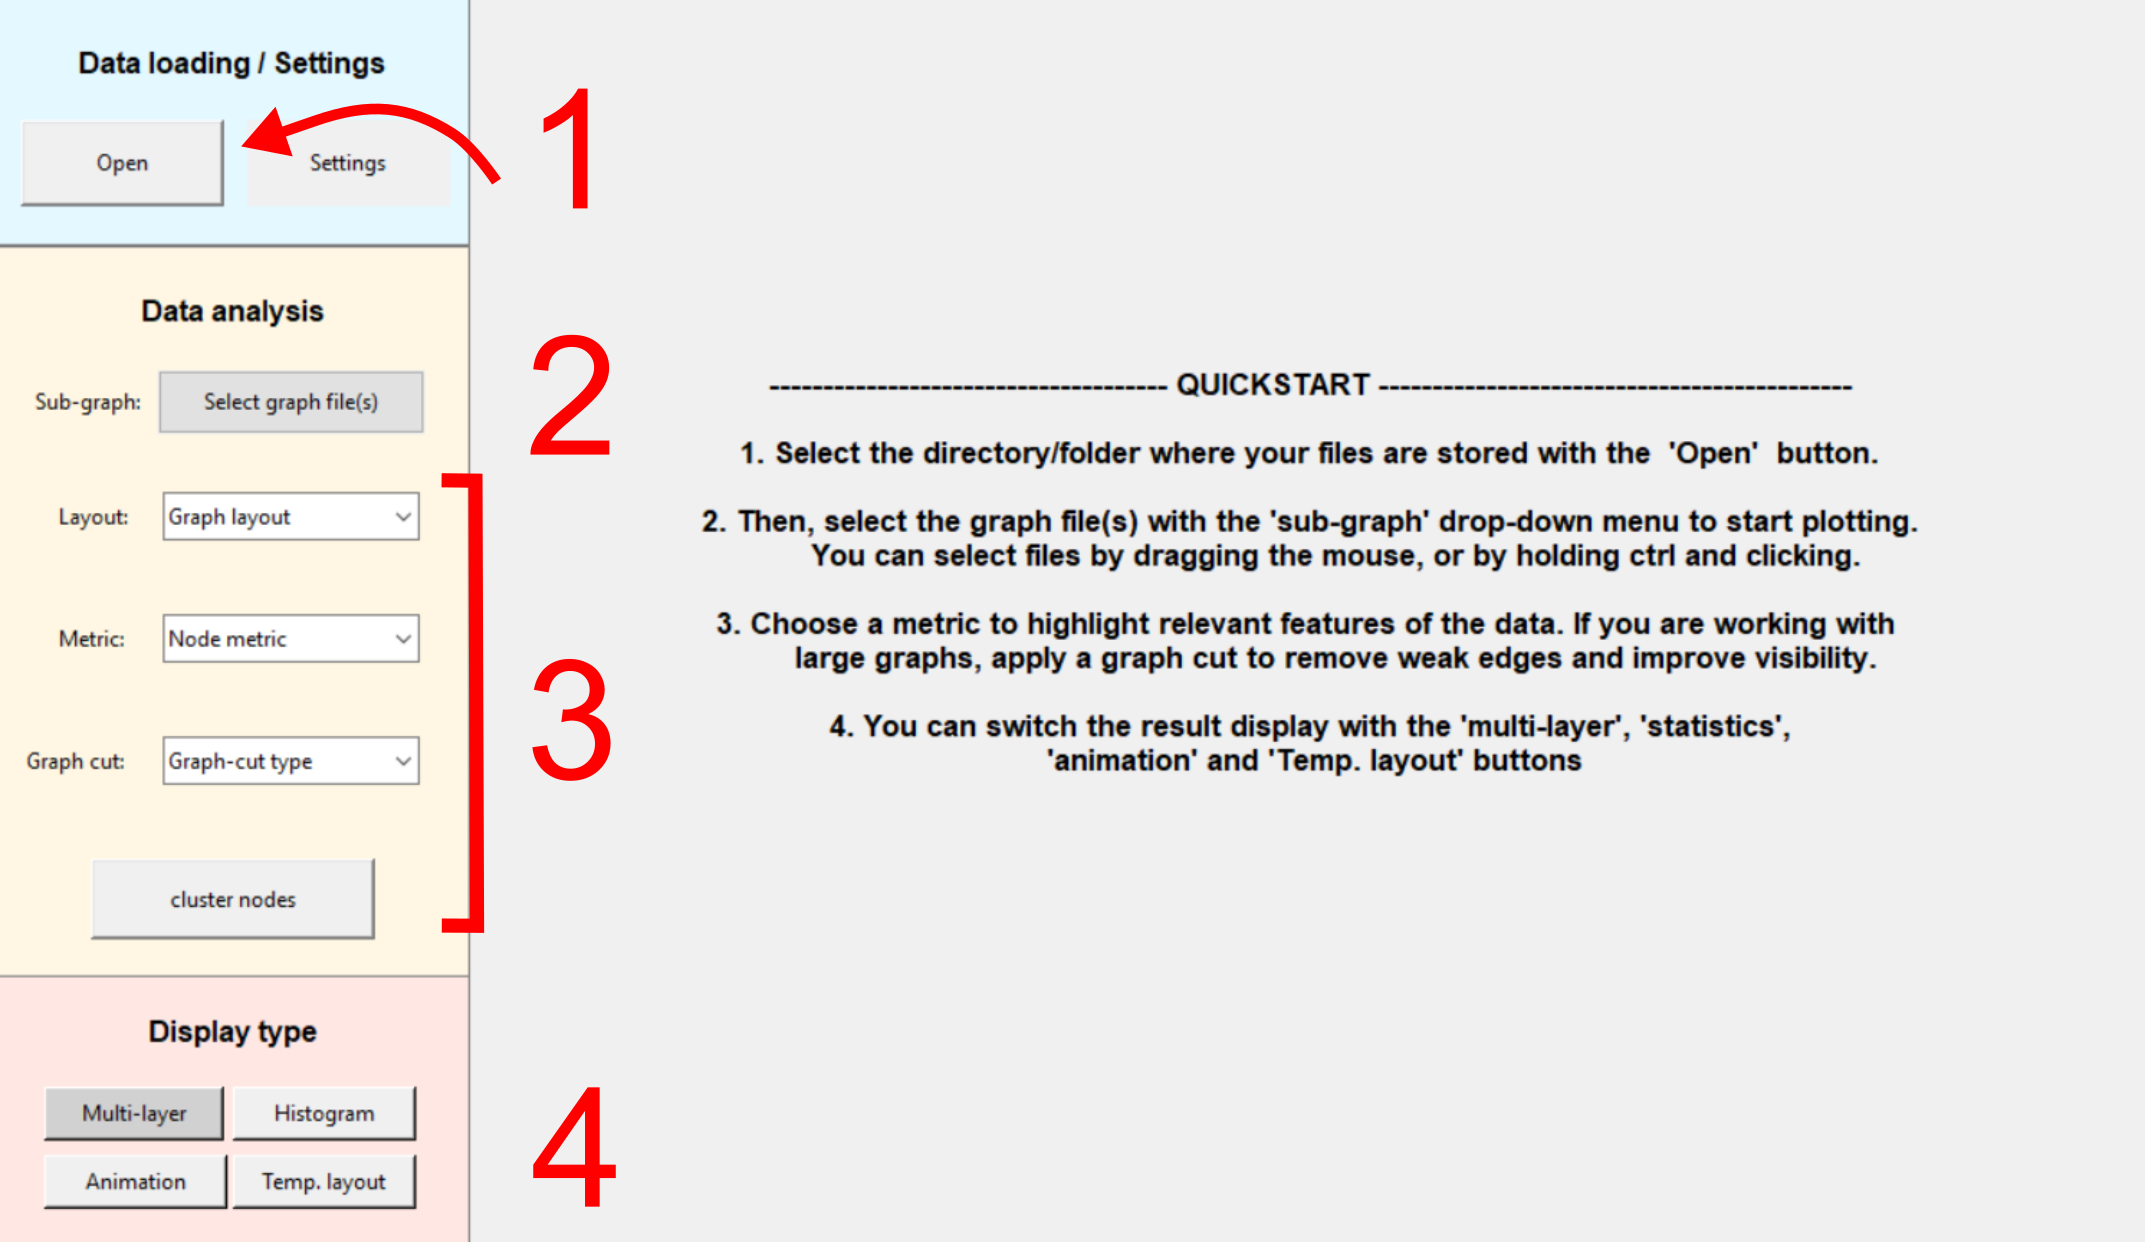
Your data should be stored in a single folder as .csv files, where each file represents the graph at a specific time point.
Steps to get started:
- Click Open in the GUI to select the folder containing your
.csvfiles. - Use the Sub-graph selector to choose one or multiple layers to visualize or analyze.
- Adjust the metrics to explore structural properties of your data. You can apply a graph cut (edge pruning) for better readability on large graphs.
- Switch between Graph, Histogram, and Animation views to gain different insights.
You can apply aesthetic changes (e.g. edge/nodes widths, colors...) to the results via the Settings button.
Main Functionalities
Here we provide a short description of the main functionalities of the GUI. For more information, see the documentation
Structure Visualization
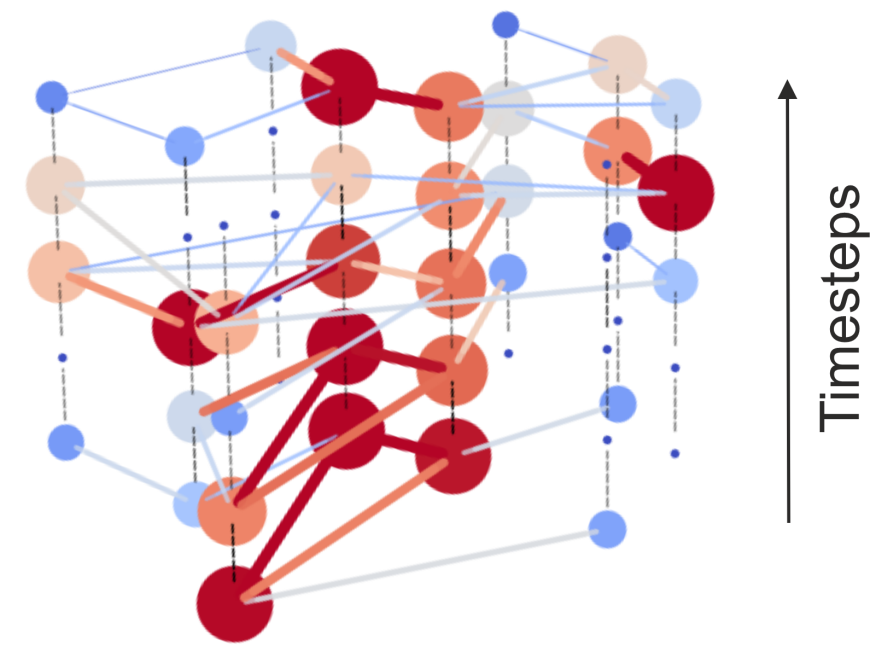
Visualize temporal graphs as a 3D stack to see how connections evolve over time. You can compute various metrics to quantify node importance — important nodes will appear larger. In this example, we also applied a colormap (via the settings) to make the results more explicit.
Metrics Distribution
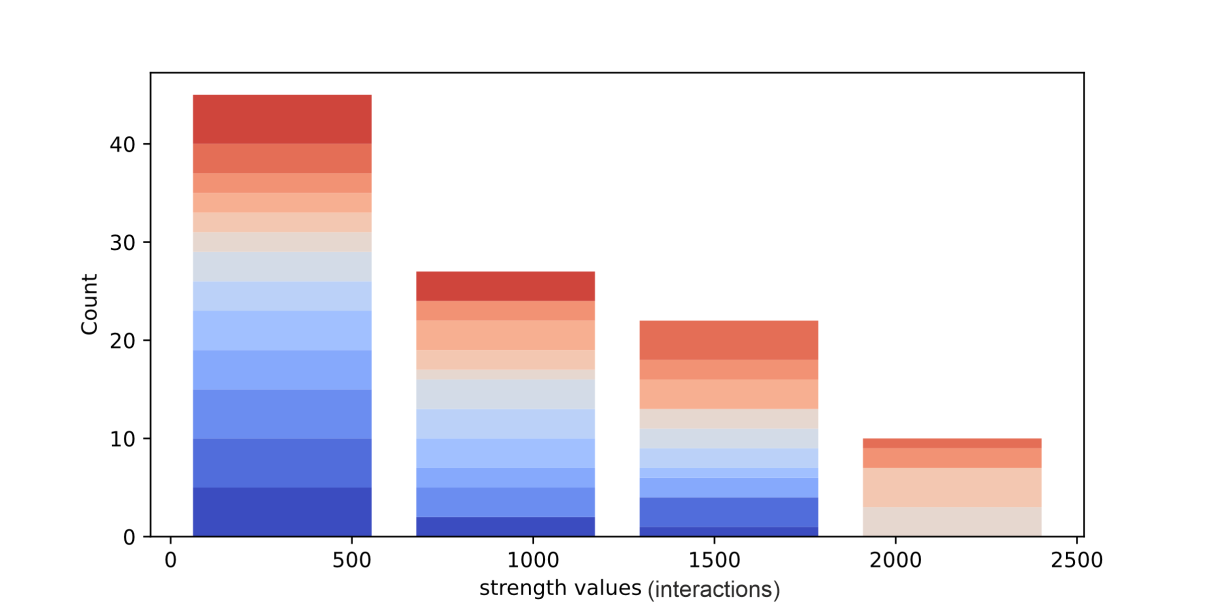
Visualize how metrics evolve over time using histograms. By default, the different time steps are stacked on top of each other for easier comparison. In this example, deep blue corresponds to early times and deep red to the last datapoints.
Graph Animation
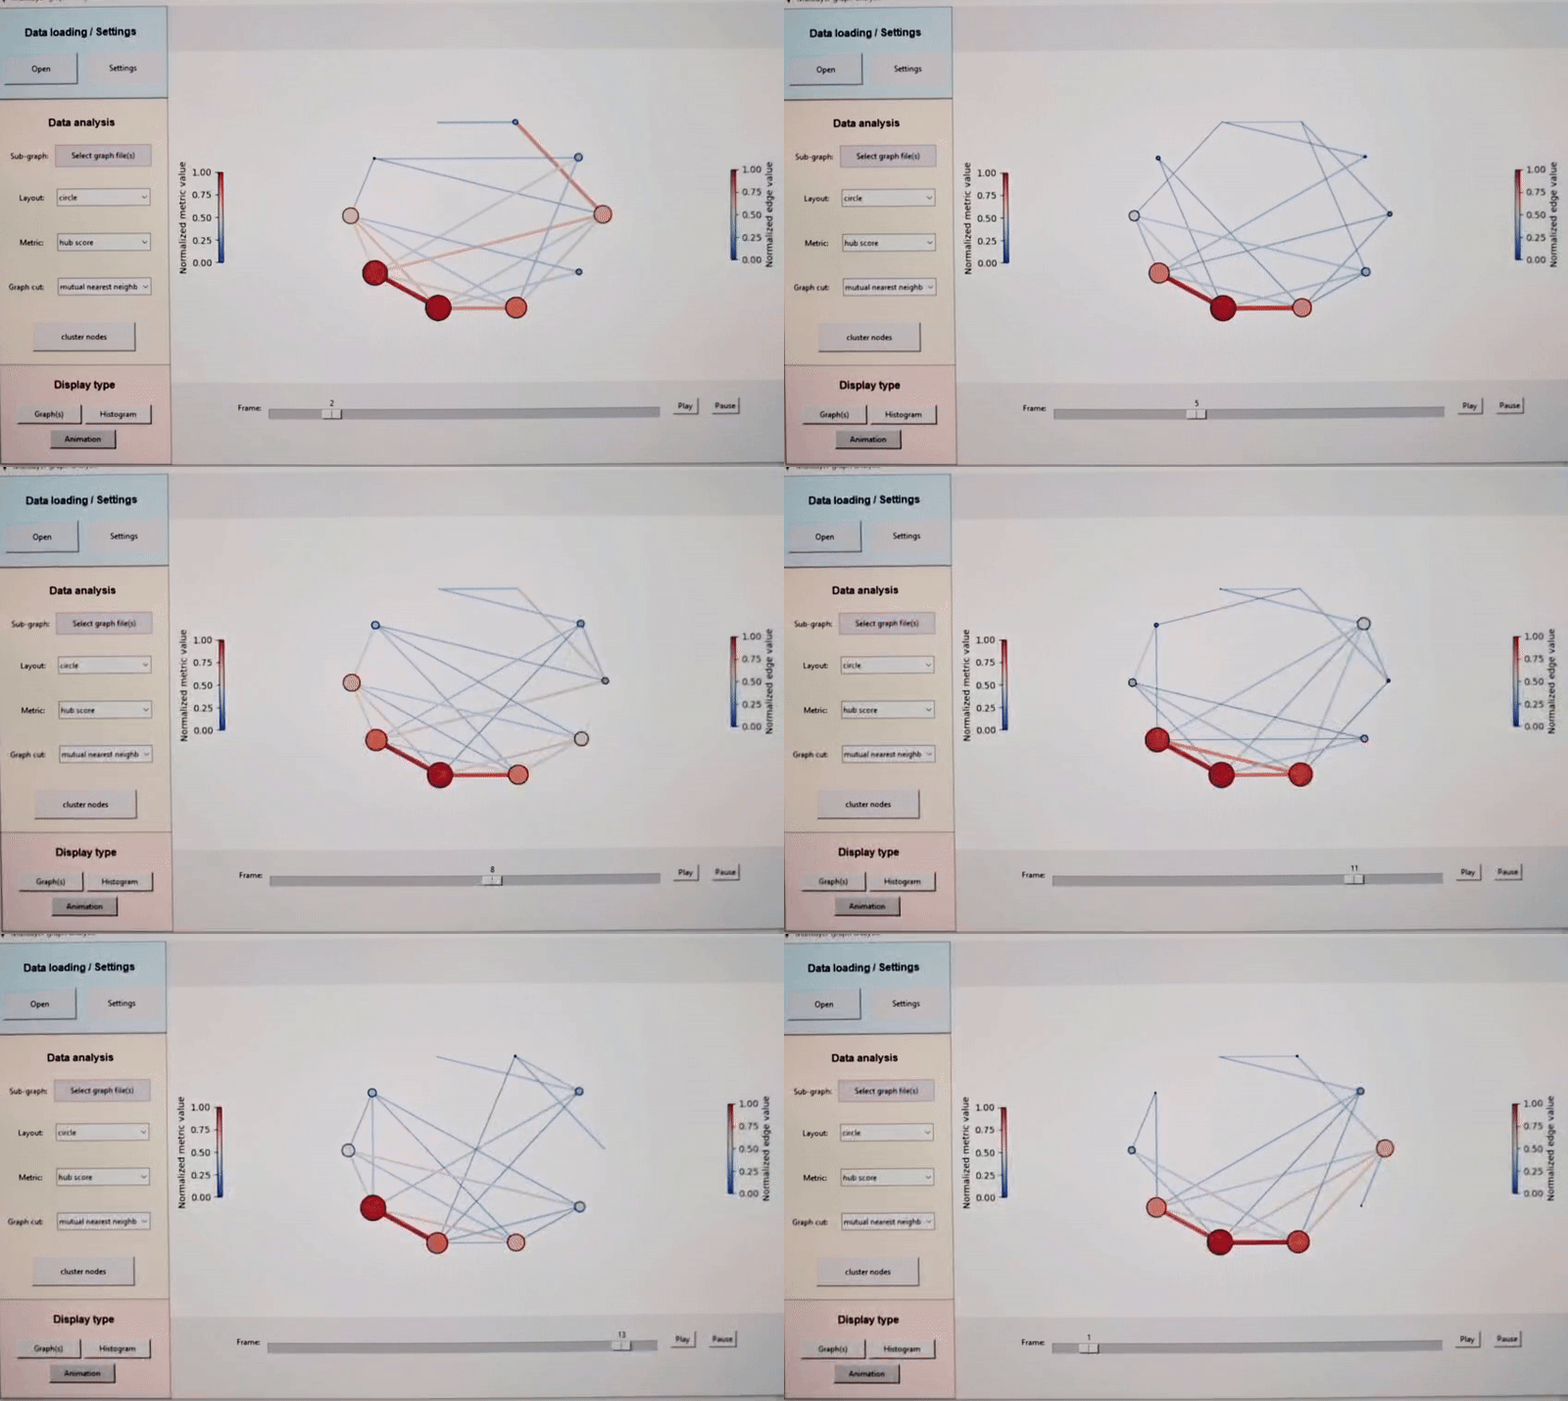
Animate the temporal evolution of your graph to better understand dynamics.
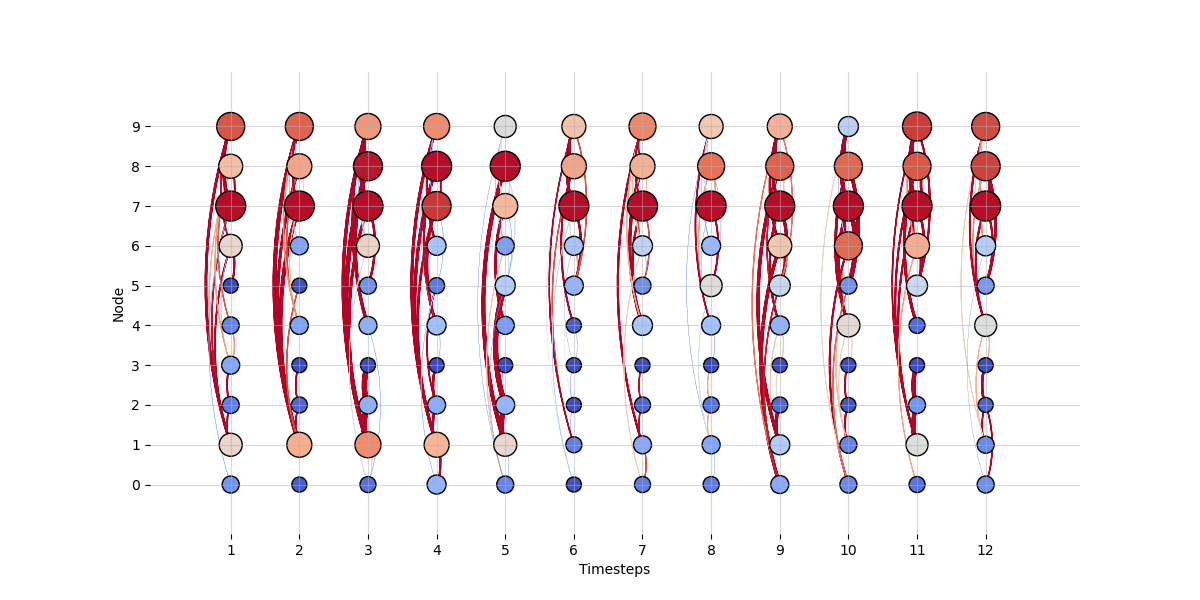
Temporal Layout
You can also display the results as a temporal layout. In this example, the color and thickness of node a shows its strength value.
License
This project is licensed under the MIT License.


Download files
Download the file for your platform. If you're not sure which to choose, learn more about installing packages.
Source Distribution
Built Distribution
Filter files by name, interpreter, ABI, and platform.
If you're not sure about the file name format, learn more about wheel file names.
Copy a direct link to the current filters
File details
Details for the file tempnetviz-0.1.122.tar.gz.
File metadata
- Download URL: tempnetviz-0.1.122.tar.gz
- Upload date:
- Size: 31.6 kB
- Tags: Source
- Uploaded using Trusted Publishing? No
- Uploaded via: poetry/2.1.4 CPython/3.13.2 Windows/10
File hashes
| Algorithm | Hash digest | |
|---|---|---|
| SHA256 |
0516ae6bd4ff67fa8d9a58d9ba89039126eb8043ece8a5012b1ff442d5378661
|
|
| MD5 |
1ba08d78e655a67ebc3610694de2692a
|
|
| BLAKE2b-256 |
5b725f12d4dd895a74184fc8c02d41d29070b6a6980effe0490c7180c2da13a5
|
File details
Details for the file tempnetviz-0.1.122-py3-none-any.whl.
File metadata
- Download URL: tempnetviz-0.1.122-py3-none-any.whl
- Upload date:
- Size: 35.4 kB
- Tags: Python 3
- Uploaded using Trusted Publishing? No
- Uploaded via: poetry/2.1.4 CPython/3.13.2 Windows/10
File hashes
| Algorithm | Hash digest | |
|---|---|---|
| SHA256 |
4a9321f5da59bfd15d2b610656f204eeb9042a064eee24bb8e14b70e308d325c
|
|
| MD5 |
3c62d392b9a9e0321babd47fc428d168
|
|
| BLAKE2b-256 |
c638ed48090a37ec345e0f35f23c3b745d2f90fd610d44c6adaa72ae02d46d5c
|






