View plotted stats directly inside terminal.

Project description
Terminal-plot for Tensorboard and CSV


A plotter for multiple different data source (e.g. tensorboard, csv), directly within your terminal. This is useful when you are training your neural network on a remote server, and you just want to quickly peek at the training curve without launching a tensorboard instance and mess with forwarding ports.
Install
You can install the package published in PyPI with
$ pip install terminal-plot
# or install with matplotlib backend dependency
$ pip install terminal-plot[matplotlib-backend]

# or install with an isolated environment
# $ pipx install terminal-plot[matplotlib-backend]
Autocomplete
You can use argcomplete to enable autocomplete for this script. For example, you can use the following for the fish shell:
register-python-argcomplete --shell fish termplot > ~/.config/fish/completions/termplot.fish
Usage
$ termplot FOLDER/FILE
For example,
$ termplot ~/my_amazing_nn/runs
where runs is the folder that tensorboard had created.
Or, using csv as a data source:
$ termplot ~/my_stats/output.csv --csv
# use the -x flag to select which stat will be used as x-axis
# $ termplot ~/my_stats/output.csv --csv -x time
Or, using matplotlib as a plotting backend:
$ termplot ~/my_stats/output.csv --csv -m
Example
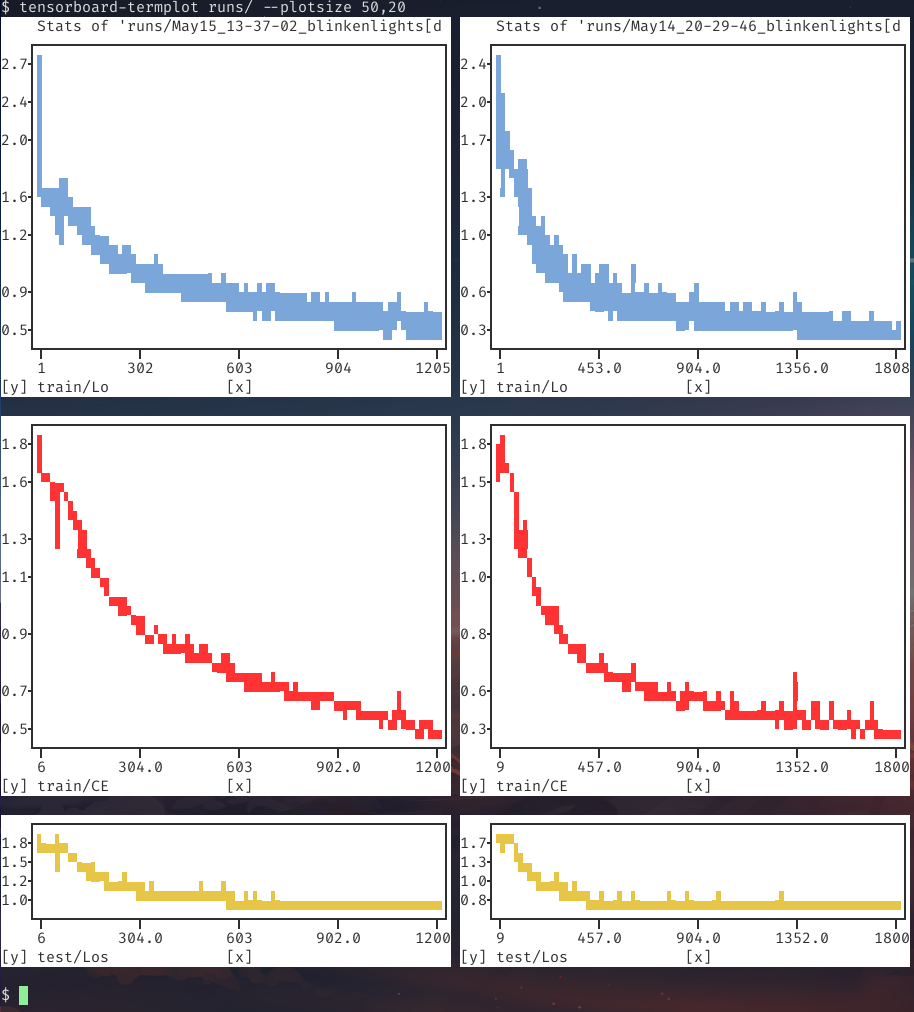
Running the executable on a tensorboard output folder:
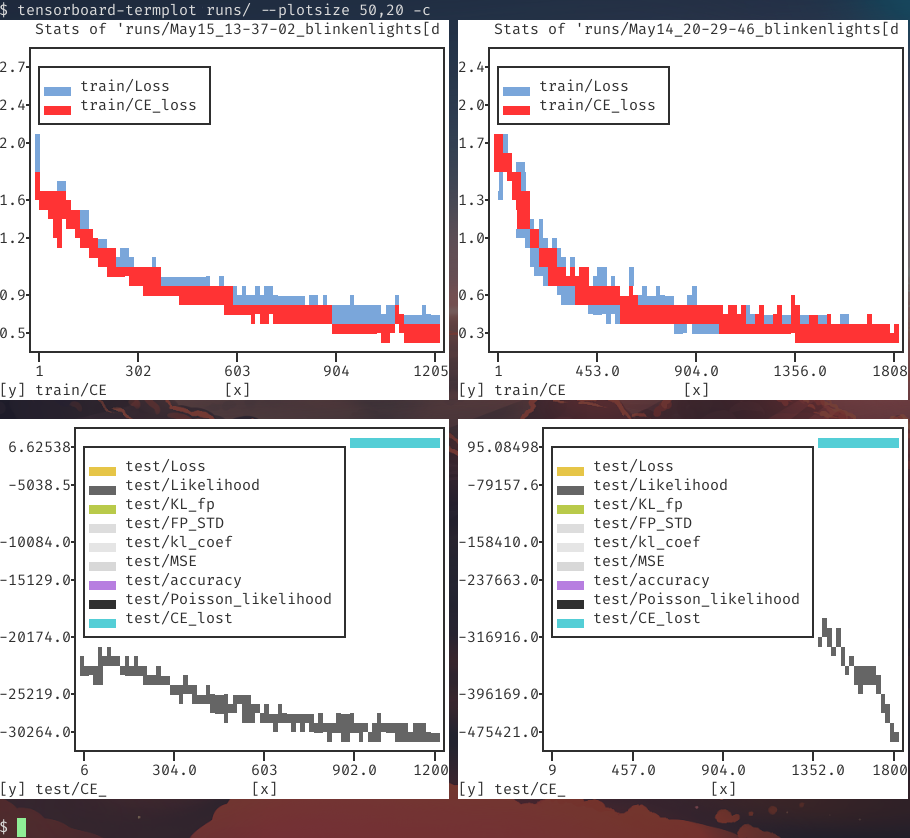
Or with the consolidated flag -c/--consolidate to combine multiple stats with a common prefix (most stats in the bottom figure had empty values):
Help
$ termplot --help
usage: termplot [-h] [--version] [--debug]
                [--backend {plotext,matplotlib,matplotlib-terminal}]
                [--data-source {tensorboard,csv}] [-m] [--csv] [--latest]
                [--plotsize WIDTH,HEIGHT] [-c] [--as-scatter]
                [--canvas-color CANVAS_COLOR] [--axes-color AXES_COLOR]
                [--ticks-color TICKS_COLOR] [--grid] [--colorless] [-d]
                [--no-iter-color] [--force-label] [-f] [-n secs]
                [-w keyword [keyword ...]] [-b keyword [keyword ...]]
                [-x XAXIS_TYPE] [--xlog [row,col ...]] [--ylog [row,col ...]]
                [--xsymlog [row,col ...]] [--ysymlog [row,col ...]]
                [--xlim row,col=min,max [row,col=min,max ...]]
                [--ylim row,col=min,max [row,col=min,max ...]]
                [--as-raw-bytes] [-s [0-1]] [--smooth-poly-order poly-order]
                [--terminal-width TERMINAL_WIDTH]
                [--terminal-height TERMINAL_HEIGHT]
                FOLDER

positional arguments:
  FOLDER                Source folder or file

optional arguments:
  -h, --help            show this help message and exit
  --version             show program's version number and exit
  --debug
  --backend {plotext,matplotlib,matplotlib-terminal}
                        Set the plotting backend
  --data-source {tensorboard,csv}
                        Set the plotting data source
  -m, --matplotlib      Alias of --backend matplotlib
  --csv                 Alias of --data-source csv
  --latest, -l          Monitor the given folder, and always plot the latest
                        modified. The given argument must be a folder if this
                        flag is set.
  --plotsize WIDTH,HEIGHT
                        Manually set the size of each subplot, e.g., 50,20.
  -c, --consolidate     Consolidate based on prefix. If -cc is given,
                        everything will consolidated regardless of prefix
  --as-scatter          Plot as scatter (instead of line plot)
  --canvas-color CANVAS_COLOR
                        set the color of the plot canvas (the area where the
                        data is plotted)
  --axes-color AXES_COLOR
                        sets the background color of all the labels
                        surrounding the actual plot, i.e. the axes, axes
                        labels and ticks, title and legend, if present
  --ticks-color TICKS_COLOR
                        sets the (full-ground) color of the axes ticks and of
                        the grid lines.
  --grid                Show grid.
  --colorless           Remove color.
  -d, --dark-theme      A collection of flags. If set, it is equivalent to
                        setting canvas-color and axes-color to black, and
                        setting ticks-color to red. Can be overwritten
                        individually.
  --no-iter-color       Stop iterating through different colors per plot.
  --force-label         Force showing label even for plot with one series.
  -f, --follow          Run in a loop to update display periodic.
  -n secs, --interval secs
                        seconds to wait between updates
  -w keyword [keyword ...], --whitelist keyword [keyword ...]
                        Keyword that the stat must contain for it to be
                        plotted, case sensitive.
  -b keyword [keyword ...], --blacklist keyword [keyword ...]
                        Keyword that the stat must not contain for it to be
                        plotted, case sensitive.
  -x XAXIS_TYPE, --xaxis-type XAXIS_TYPE
                        Set value type to be used for x-axis. Tensorboard only
                        supports 'step' or 'time' as x-axis.
  --xlog [row,col ...]  Set the list of subplots to use log scale in x-axis
  --ylog [row,col ...]  Set the list of subplots to use log scale in y-axis
  --xsymlog [row,col ...]
                        Set the list of subplots to use symlog scale in x-axis
  --ysymlog [row,col ...]
                        Set the list of subplots to use symlog scale in y-axis
  --xlim row,col=min,max [row,col=min,max ...]
                        Set the list of xlim for the specified subplot.
  --ylim row,col=min,max [row,col=min,max ...]
                        Set the list of ylim for the specified subplot.
  --as-raw-bytes        Writes the raw image bytes to stdout.
  -s [0-1], --smooth [0-1]
                        A value from 0 to 1 as a smoothing factor.
  --smooth-poly-order poly-order
                        Polynomial order for the savgol smoothing algorithm.
  --terminal-width TERMINAL_WIDTH
                        Manually set the terminal width.
  --terminal-height TERMINAL_HEIGHT
                        Manually set the terminal height.


Download files
Download the file for your platform. If you're not sure which to choose, learn more about installing packages.
Source Distribution
Built Distribution
Filter files by name, interpreter, ABI, and platform.
If you're not sure about the file name format, learn more about wheel file names.
Copy a direct link to the current filters
File details
Details for the file terminal_plot-2.2.2.tar.gz.
File metadata
- Download URL: terminal_plot-2.2.2.tar.gz
- Upload date:
- Size: 17.6 kB
- Tags: Source
- Uploaded using Trusted Publishing? No
- Uploaded via: twine/5.0.1.dev0+g94f810c.d20240510 CPython/3.12.4
File hashes
| Algorithm | Hash digest | |
|---|---|---|
| SHA256 |
a0402842231ecf6990f5063f9729782fc768cd12893bb662cca99bd243cf110c
|
|
| MD5 |
116a945cc9410f7fd0b35207e69aeab3
|
|
| BLAKE2b-256 |
4ffc4785ca61de383b22b4f06191fe6eca1f57c1827ce1372e69acfa139a211b
|
File details
Details for the file terminal_plot-2.2.2-py3-none-any.whl.
File metadata
- Download URL: terminal_plot-2.2.2-py3-none-any.whl
- Upload date:
- Size: 22.9 kB
- Tags: Python 3
- Uploaded using Trusted Publishing? No
- Uploaded via: twine/5.0.1.dev0+g94f810c.d20240510 CPython/3.12.4
File hashes
| Algorithm | Hash digest | |
|---|---|---|
| SHA256 |
e7c2fbabeb338bb3bfcbfd0c197c785c2d9b1b48da3d272a2a0491cd82396aa6
|
|
| MD5 |
b12a0c4c7768b5bcb58cb71b502b1569
|
|
| BLAKE2b-256 |
8f21b2fdd24744f14308ec6718345ea187ded4cdc9f92f103f15821811059ca9
|


