Plot points in terminal

Project description


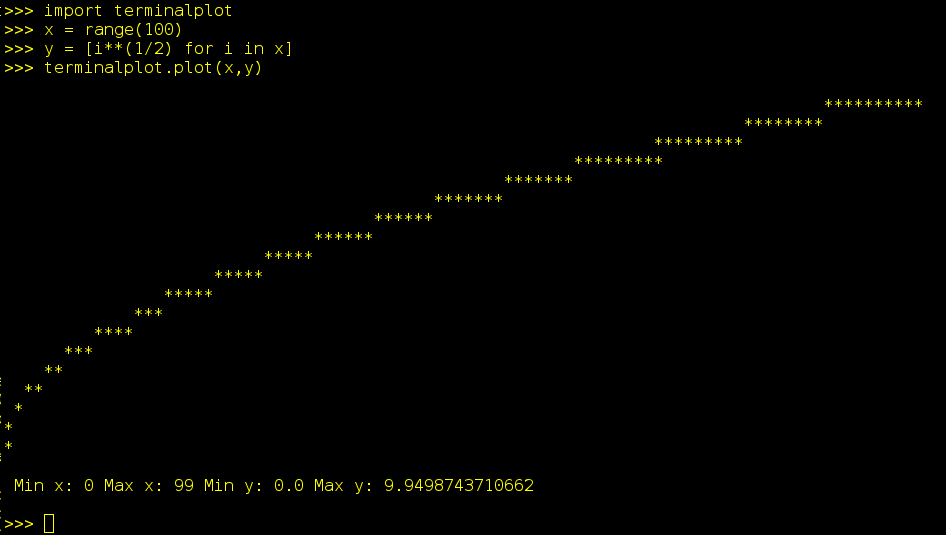
Terminalplot is a minimalistic packgage, that only prints points to the terminal. It does not have any dependencies.
Installation
pip install terminalplotUsage
Command Line
Get size of terminal emulator (tty):
$ plot -s
Rows: 25, Columns: 80
Plot some points:
$ plot -x '-1 0 1 2 3 4' -y '0.1 0.2 0.23 0.234 0.24'
API
Plotting a graph
from terminalplot import plot
x = range(100)
y = [i**2 for i in x]
plot(x, y)
Get size of current terminal window
from terminalplot import get_terminal_size
get_terminal_size()Release history Release notifications | RSS feed


Download files
Download the file for your platform. If you're not sure which to choose, learn more about installing packages.
Source Distributions
No source distribution files available for this release.See tutorial on generating distribution archives.
Built Distribution
Filter files by name, interpreter, ABI, and platform.
If you're not sure about the file name format, learn more about wheel file names.
Copy a direct link to the current filters
File details
Details for the file terminalplot-0.4.0-py3-none-any.whl.
File metadata
- Download URL: terminalplot-0.4.0-py3-none-any.whl
- Upload date:
- Size: 30.1 kB
- Tags: Python 3
- Uploaded using Trusted Publishing? No
- Uploaded via: python-httpx/0.25.0
File hashes
| Algorithm | Hash digest | |
|---|---|---|
| SHA256 |
57349ef0e4668db8277ec65dbb1a30d01491587469394e3667465fe981ecd2b1
|
|
| MD5 |
31877e874a8ede8e0a7c65b87b648ad0
|
|
| BLAKE2b-256 |
532a29ee46e81aaaac0621b52e95149f9b3fb4aabdb55e59d51cadbdc8ca0bcb
|


