Plotting on the command line

Project description
termplotlib


termplotlib is a Python library for all your terminal plotting needs. It aims to work like matplotlib.
Line plots
For line plots, termplotlib relies on gnuplot. With that installed, the code
import termplotlib as tpl
import numpy

x = numpy.linspace(0, 2 * numpy.pi, 10)
y = numpy.sin(x)

fig = tpl.figure()
fig.plot(x, y, label="data", width=50, height=15)
fig.show()
produces
    1 +---------------------------------------+
  0.8 |    **     **                          |
  0.6 |   *         **           data ******* |
  0.4 | **                                    |
  0.2 |*              **                      |
    0 |                 **                    |
      |                                   *   |
 -0.2 |                   **            **    |
 -0.4 |                     **         *      |
 -0.6 |                              **       |
 -0.8 |                       **** **         |
   -1 +---------------------------------------+
      0     1    2     3     4     5    6     7
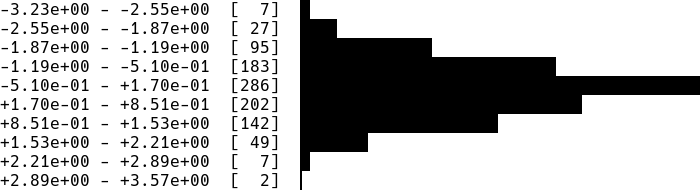
Horizontal histograms
import termplotlib as tpl
import numpy

numpy.random.seed(123)
sample = numpy.random.normal(size=1000)
counts, bin_edges = numpy.histogram(sample)

fig = tpl.figure()
fig.hist(counts, bin_edges, orientation="horizontal", force_ascii=False)
fig.show()
produces
Horizontal bar charts are covered as well. This
fig = tpl.figure()
fig.barh([3, 10, 5, 2], ["Cats", "Dogs", "Cows", "Geese"], force_ascii=True)
fig.show()
produces
Cats   [ 3]  ************
Dogs   [10]  ****************************************
Cows   [ 5]  ********************
Geese  [ 2]  ********
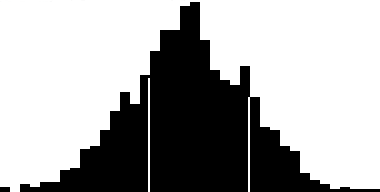
Vertical histograms
import termplotlib as tpl
import numpy

numpy.random.seed(123)
sample = numpy.random.normal(size=1000)
counts, bin_edges = numpy.histogram(sample, bins=40)
fig = tpl.figure()
fig.hist(counts, bin_edges, grid=[15, 25], force_ascii=False)
fig.show()
produces
Tables
Support for tables has moved over to termtables.
Installation
termplotlib is available from the Python Package Index, so simply do
pip install termplotlib
to install.
Testing
To run the termplotlib unit tests, check out this repository and type
pytest
License
This software is published under the GPLv3 license.
Release history Release notifications | RSS feed


Download files
Download the file for your platform. If you're not sure which to choose, learn more about installing packages.
Source Distribution
Built Distribution
Filter files by name, interpreter, ABI, and platform.
If you're not sure about the file name format, learn more about wheel file names.
Copy a direct link to the current filters
File details
Details for the file termplotlib-0.3.4.tar.gz.
File metadata
- Download URL: termplotlib-0.3.4.tar.gz
- Upload date:
- Size: 24.3 kB
- Tags: Source
- Uploaded using Trusted Publishing? No
- Uploaded via: twine/3.3.0 pkginfo/1.7.0 requests/2.25.1 setuptools/53.0.0 requests-toolbelt/0.9.1 tqdm/4.56.2 CPython/3.9.1+
File hashes
| Algorithm | Hash digest | |
|---|---|---|
| SHA256 |
b1ebe3b31ac554db249c2b4cf042b7ba5363f49eeb36c4d1c5e4f15db9fc20ea
|
|
| MD5 |
57b072cafe52d3e2f0be5882b88eaebe
|
|
| BLAKE2b-256 |
593a6d5eb266b66b7c7e660c6221d0e1c14cb54ff00a92ae109e32a6c06163bb
|
File details
Details for the file termplotlib-0.3.4-py3-none-any.whl.
File metadata
- Download URL: termplotlib-0.3.4-py3-none-any.whl
- Upload date:
- Size: 21.0 kB
- Tags: Python 3
- Uploaded using Trusted Publishing? No
- Uploaded via: twine/3.3.0 pkginfo/1.7.0 requests/2.25.1 setuptools/53.0.0 requests-toolbelt/0.9.1 tqdm/4.56.2 CPython/3.9.1+
File hashes
| Algorithm | Hash digest | |
|---|---|---|
| SHA256 |
448c7791e0a2abbb860fd87785b135c4af9a9a6199dfd408a3ec23f90f240079
|
|
| MD5 |
b3ca85d6709a69f829b52435f0a9dbbf
|
|
| BLAKE2b-256 |
1c74b5a2e01ff9878c9987c5412c3773c9d3c60a92f8c1e5e525d0e4fc4e0ebe
|


