This package makes it easier for you to draw beautiful ternary diagram without pymatgen.

Project description
Ternary Diagram


This package makes it easier for you to draw beautiful ternary diagram without pymatgen.
Meaningly, only need numpy, pandas and matplotlib.
First of all
This package works well with the element_recognition package (my own package) because it has a function (get_ratio) that converts composition to ratio.
Also, if you are using Mac OS, you can use these functions in a GUI application. See ternary_diagram_gui for details.
How to install
I recommend you to create and use a brand new virtual environment, especially anaconda.
pip install ternary-diagram
Usage (文法)
import package
from ternary_diagram import TernaryDiagram
Make an instance
materials = ['Li2O', 'La2O3', 'TiO2']
td = TernaryDiagram(materials)
materials:Listof compounds at the endpoints of the triangle, 1D, length 3.- 三角図の端点となる化合物,1次元,長さ3の
list.
Scatter points
化合物の点をプロット.
vector = [[1, 1, 1]]
td.scatter(vector, **options)
-
vector:- percentage of each compound mixed in 2D
list/pandas.DataFrame/numpy.ndarray, where shape = [n, 3] (n is the number of samples to be plotted as integer) - それぞれの化合物が混ざった割合.2次元
list/pandas.DataFrame/numpy.ndarrayで,shape = [n, 3] (nは整数でプロットしたいサンプル数)
- percentage of each compound mixed in 2D
-
options:- most of the options available in
matplotlib.pyplot.scatter(color,marker, etc.) - If you add
ztooptions, you can change the color of the point to a gradient for each value. (It is possible to plot properties such as thermal conductivity and resistance of a material of that composition.) matplotlib.pyplot.scatterで使えるoptionは大体使える (color,marker, ...etc.)- もし
zをoptionsに加えると点の色を値ごとにグラデーションにすることができる.(その組成の材料の熱伝導率や抵抗値などの特性をプロットすることができる.)
- most of the options available in
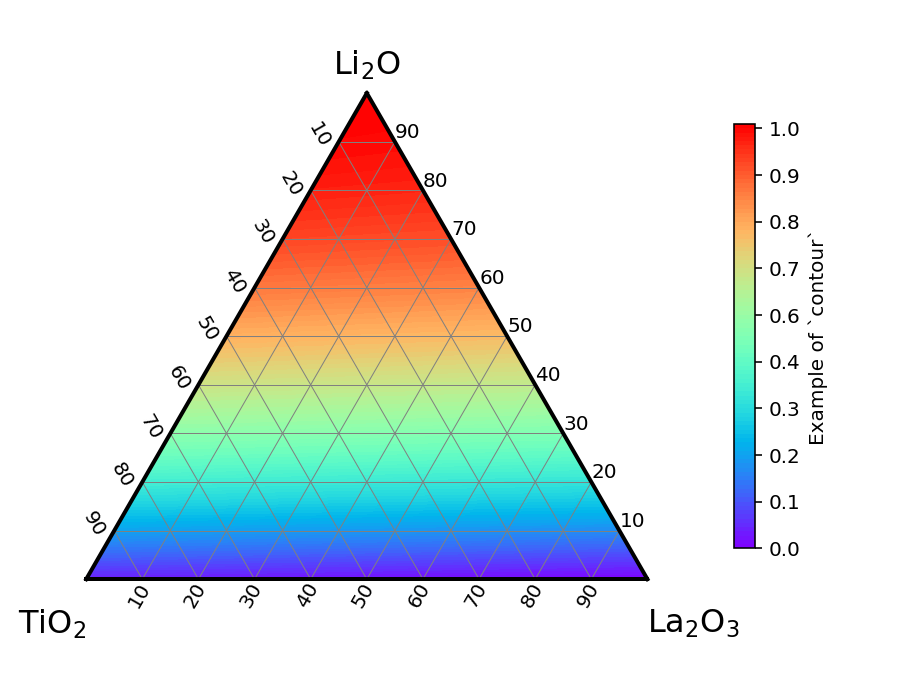
Contour
等高線を使ったカラーマップを出力
td.contour(vector, z = [...], maximum = None, minimum = None)
vector:- As with
scatter, the ratio of each compound mixed together scatterと同様でそれぞれの化合物が混ざった割合
- As with
z:- It should have the same length as len(vector) and is required to color the colormap.
- len(vector)と同じ長さを持つ.colormapの色をつけるにあたって必要な値.
z_max:- Optional. If there is not, it will get the maximum value by itself.
- なくてもいい.なかったら勝手に最大値を取得してやってくれる.
z_min:- Optional. If there is not, it will get the minimum value by itself.
- なくてもいい.なかったら勝手に最小値を取得してやってくれる.
Tie line (連結線)
It is possible to draw a tie line. (連結線を引くことができる.)
td.plot(r1, r2, **options)
r1andr2:- 1D,
listof length 3. Mixing ratio of compounds at the endpoints of the connecting lines. - 一次元,長さ3の
list.連結線の端点の化合物の混合割合.
- 1D,
options:matplotlib.pyplot.plotのoptionsと同じ.(e.g.lw,coloretc.)
example
The easiest example is here.
td = TernaryDiagram(['Li2O', 'La2O3', 'TiO2'])
td.scatter([[1, 1, 1], [1, 2, 3]], z = [0, 1], marker = 'o')
td.plot([1, 1, 1], [1, 2, 3], color = 'black')
plt.savefig('figure.png', transparent = True, dpi = 144)
It can be written like this.
fig, ax = plt.subplots(facecolor='w')
td = TernaryDiagram(['Li2O', 'La2O3', 'TiO2'], ax=ax)
td.scatter([[1, 1, 1], [1, 2, 3]], z = [0, 1], marker = 'o')
td.plot([1, 1, 1], [1, 2, 3], color = 'black')
fig.savefig('figure.png', transparent = True, dpi = 144)
It means that you can draw multiple figures in one figure object.
See also the example folder. In particular, if you want to know how to use element_recognitionelement_recognition as well, please refer to example/scatter/example _scatter_with_annotations.ipynb.
LICENSE
See LICENSE.
Release history Release notifications | RSS feed


Download files
Download the file for your platform. If you're not sure which to choose, learn more about installing packages.
Source Distribution
Built Distribution
Filter files by name, interpreter, ABI, and platform.
If you're not sure about the file name format, learn more about wheel file names.
Copy a direct link to the current filters
File details
Details for the file ternary_diagram-2.0.1.dev0.tar.gz.
File metadata
- Download URL: ternary_diagram-2.0.1.dev0.tar.gz
- Upload date:
- Size: 12.4 kB
- Tags: Source
- Uploaded using Trusted Publishing? No
- Uploaded via: twine/3.4.1 importlib_metadata/4.6.1 pkginfo/1.7.1 requests/2.25.1 requests-toolbelt/0.9.1 tqdm/4.61.2 CPython/3.7.10
File hashes
| Algorithm | Hash digest | |
|---|---|---|
| SHA256 |
7f0d1a4c12134a2556ed2f9d34abbf943b206d6243419b1e4f09f4f35d20eec2
|
|
| MD5 |
7c417cf27df72965c4a189a1e175e93b
|
|
| BLAKE2b-256 |
767709f38e048f527f481e24372fc0e8007665a4e020855a9ba153aa968e4bac
|
File details
Details for the file ternary_diagram-2.0.1.dev0-py3-none-any.whl.
File metadata
- Download URL: ternary_diagram-2.0.1.dev0-py3-none-any.whl
- Upload date:
- Size: 10.7 kB
- Tags: Python 3
- Uploaded using Trusted Publishing? No
- Uploaded via: twine/3.4.1 importlib_metadata/4.6.1 pkginfo/1.7.1 requests/2.25.1 requests-toolbelt/0.9.1 tqdm/4.61.2 CPython/3.7.10
File hashes
| Algorithm | Hash digest | |
|---|---|---|
| SHA256 |
a364c1fbdfe6efe8266f7fa7751af43babe16ce0d92cf4095d84901d0315a39e
|
|
| MD5 |
e27a3d950900bec0618d6ad133d2d0bc
|
|
| BLAKE2b-256 |
ad962cbfc25ee6a4731a912c6240f3a5f5f188df3ba87c41a859483066320b7a
|


