testAUC is a library of tools to evaluate the true performance of ML/AI models

Project description
testAUC
Official implementation of the tools discussed in The curious case of the test set AUROC
It is a set of tools designed for better evaluation of Binary Classification tasks in ML and AI. Specifically dealing with the expected performance of the model on new data.
Quick start
pip install testAUC
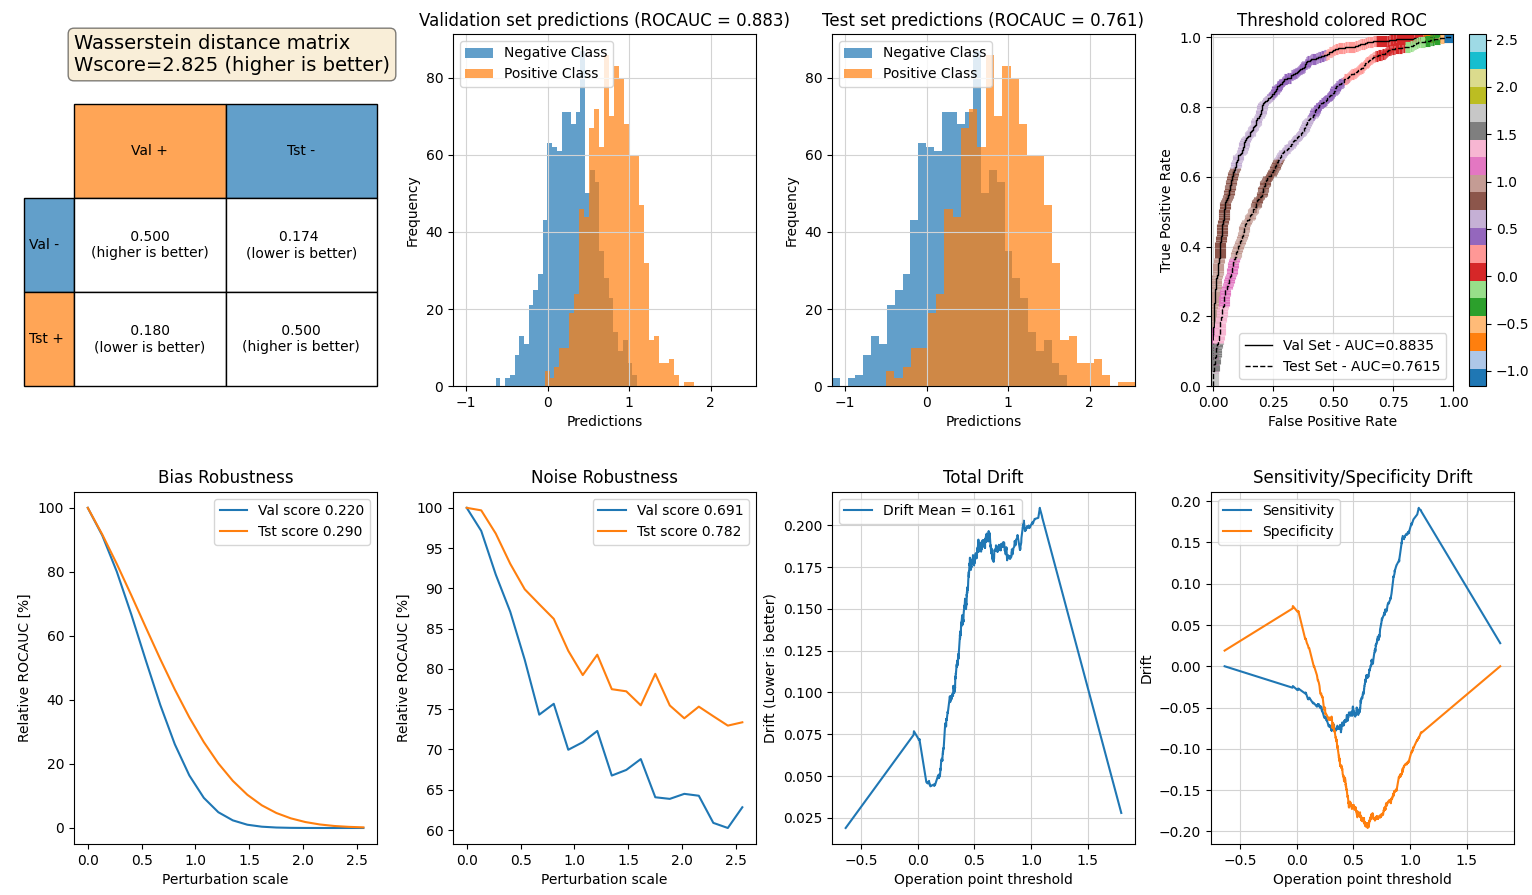
For and all-in-one view of the toolset, use the dashboad() function:
from testAUC import faux_normal_predictions, dashboard

# Simulate a model, evaluated on a Validation set and a Test set:
y_true_val, y_score_val = faux_normal_predictions(neg_mu=0.3, pos_mu=0.8, seed=2023)
y_true_tst, y_score_tst = faux_normal_predictions(std=0.5, neg_mu=0.4, pos_mu=0.9, seed=2023)

# All in one Dashboard to evaluate the Validation vs. Test sets performance
dashboard(y_true_val, y_score_val, y_true_tst, y_score_tst)
roc_drift, val_tst_colored_roc_curve, colored_roc_curve,dashboard noise_robustness, bias_robustness, plot_noise_robustness, plot_bias_robustness plot_wasserstein_distance_matrix, plot_predictions_hist
Mini-documentation of functions:
- dashboard() -> An All-In-One dashboard to evaluate the test performance (good place to start!)
- roc_drift() -> Calculate the ROC drift from validation to test sets
- noise_robustness() -> Calculate the robustness of the predictions to normal noise
- plot_noise_robustness() -> uses the noise_robustness to generate a plot
- bias_robustness() -> Calculate the robustness of the predictions to bias between the classes
- plot_bias_robustness() -> uses the bias_robustness to generate a plot
- plot_wasserstein_distance_matrix() -> See paper to understand the importance of the matrix
- colored_roc_curve() -> Plot an ROC curve that is color coded by threshold
- val_tst_colored_roc_curve() -> Same colored ROC curve but for both val&tst sets (sharing color limits!)
- faux_normal_predictions() -> A small utility function to create fake model predictions
- plot_predictions_hist() -> Plot a histogram of predictions for the Positive and Negative classes
Release history Release notifications | RSS feed


Download files
Download the file for your platform. If you're not sure which to choose, learn more about installing packages.
Source Distribution
Built Distribution
Filter files by name, interpreter, ABI, and platform.
If you're not sure about the file name format, learn more about wheel file names.
Copy a direct link to the current filters
File details
Details for the file testauc-1.0.2.tar.gz.
File metadata
- Download URL: testauc-1.0.2.tar.gz
- Upload date:
- Size: 5.8 kB
- Tags: Source
- Uploaded using Trusted Publishing? No
- Uploaded via: twine/4.0.2 CPython/3.11.5
File hashes
| Algorithm | Hash digest | |
|---|---|---|
| SHA256 |
21ed1783e06fddcad6a8423ead909462ac9707653a49a7f914c91ee8a7076b1f
|
|
| MD5 |
b8fdbafd6e694b4c984eec90d9379139
|
|
| BLAKE2b-256 |
9b6d8fcc13f5c91acb9d7bce7e6726bdea6920f10d88109d6697b8b703130f65
|
File details
Details for the file testauc-1.0.2-py3-none-any.whl.
File metadata
- Download URL: testauc-1.0.2-py3-none-any.whl
- Upload date:
- Size: 6.6 kB
- Tags: Python 3
- Uploaded using Trusted Publishing? No
- Uploaded via: twine/4.0.2 CPython/3.11.5
File hashes
| Algorithm | Hash digest | |
|---|---|---|
| SHA256 |
2bd2f2d39b379a451fe255bc943b38fbeaf689c97de9296e8b19622ae2d49983
|
|
| MD5 |
e154f0502b27dc04404b6834bca3fda0
|
|
| BLAKE2b-256 |
b85578cb1cdda2d5429f188ea71760b12199e609fa80d4e921fe7faecfede6ae
|


