
tfcausalimpact





Google's Causal Impact Algorithm Implemented on Top of TensorFlow Probability.
How It Works
The algorithm basically fits a Bayesian structural model on past observed data to make predictions on what future data would look like. Past data comprises everything that happened before an intervention (which usually is the changing of a variable as being present or not, such as a marketing campaign that starts to run at a given point). It then compares the counter-factual (predicted) series against what was really observed in order to extract statistical conclusions.
Running the model is quite straightforward, it requires the observed data y, covariates X that helps the model through a linear regression, a pre-period interval that selects everything that happened before the intervention and a post-period with data after the "impact" happened.
Please refer to this medium post for more on this subject.
Installation
pip install tfcausalimpact
Requirements
- python{3.8, 3.9, 3.10, 3.11, 3.12, 3.13}
To run the test suite without installing Python or project dependencies on the host, use Docker:
./scripts/test_docker.sh 3.13
The version argument is optional and defaults to Python 3.13.
- matplotlib
- jinja2
- tensorflow>=2.10.0
- tensorflow_probability>=0.18.0
- pandas >= 1.3.5
Getting Started
We recommend this presentation by Kay Brodersen (one of the creators of the Causal Impact in R).
We also created this introductory ipython notebook with examples of how to use this package.
This medium article also offers some ideas and concepts behind the library.
Example
Here's a simple example (which can also be found in the original Google's R implementation) running in Python:
import pandas as pd
from causalimpact import CausalImpact


data = pd.read_csv('https://raw.githubusercontent.com/WillianFuks/tfcausalimpact/master/tests/fixtures/arma_data.csv')[['y', 'X']]
data.iloc[70:, 0] += 5

pre_period = [0, 69]
post_period = [70, 99]

ci = CausalImpact(data, pre_period, post_period)
print(ci.summary())
print(ci.summary(output='report'))
ci.plot()
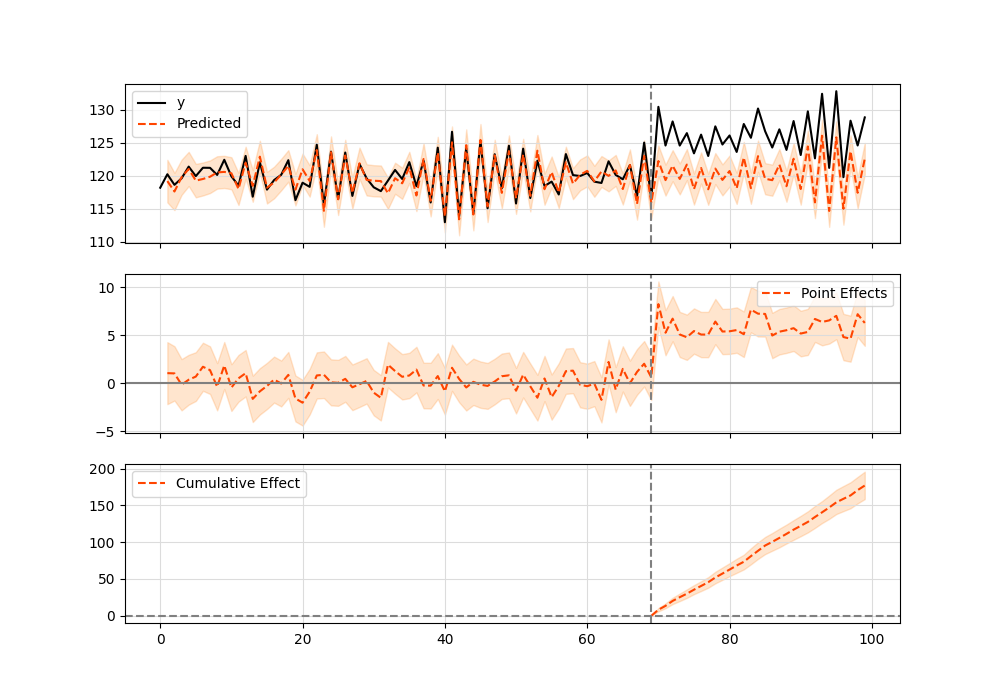
Summary should look like this:
Posterior Inference {Causal Impact}
                          Average            Cumulative
Actual                    125.23             3756.86
Prediction (s.d.)         120.34 (0.31)      3610.28 (9.28)
95% CI                    [119.76, 120.97]   [3592.67, 3629.06]

Absolute effect (s.d.)    4.89 (0.31)        146.58 (9.28)
95% CI                    [4.26, 5.47]       [127.8, 164.19]

Relative effect (s.d.)    4.06% (0.26%)      4.06% (0.26%)
95% CI                    [3.54%, 4.55%]     [3.54%, 4.55%]

Posterior tail-area probability p: 0.0
Posterior prob. of a causal effect: 100.0%

For more details run the command: print(impact.summary('report'))
And here's the plot graphic:
Google R Package vs TensorFlow Python
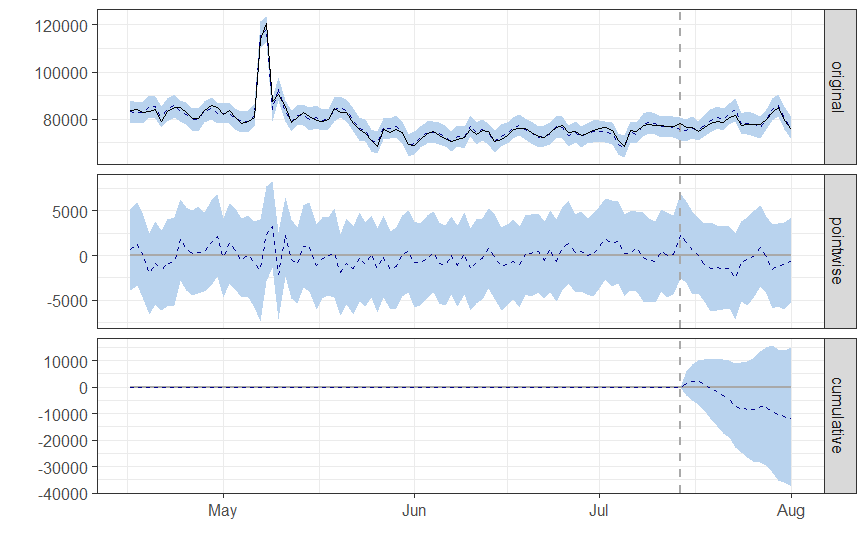
Both packages should give equivalent results. Here's an example using the comparison_data.csv dataset available in the fixtures folder. When running CausalImpact in the original R package, this is the result:
R
data = read.csv.zoo('comparison_data.csv', header=TRUE)
pre.period <- c(as.Date("2019-04-16"), as.Date("2019-07-14"))
post.period <- c(as.Date("2019-07-15"), as.Date("2019-08-01"))
ci = CausalImpact(data, pre.period, post.period)
Summary results:
Posterior inference {CausalImpact}

                         Average          Cumulative
Actual                   78574            1414340
Prediction (s.d.)        79232 (736)      1426171 (13253)
95% CI                   [77743, 80651]   [1399368, 1451711]

Absolute effect (s.d.)   -657 (736)       -11831 (13253)
95% CI                   [-2076, 832]     [-37371, 14971]

Relative effect (s.d.)   -0.83% (0.93%)   -0.83% (0.93%)
95% CI                   [-2.6%, 1%]      [-2.6%, 1%]

Posterior tail-area probability p:   0.20061
Posterior prob. of a causal effect:  80%

For more details, type: summary(impact, "report")
And correspondent plot:
Python
import pandas as pd
from causalimpact import CausalImpact


data = pd.read_csv('https://raw.githubusercontent.com/WillianFuks/tfcausalimpact/master/tests/fixtures/comparison_data.csv', index_col=['DATE'])
pre_period = ['2019-04-16', '2019-07-14']
post_period = ['2019-7-15', '2019-08-01']
ci = CausalImpact(data, pre_period, post_period, model_args={'fit_method': 'hmc'})
Summary is:
Posterior Inference {Causal Impact}
                          Average            Cumulative
Actual                    78574.42           1414339.5
Prediction (s.d.)         79282.92 (727.48)  1427092.62 (13094.72)
95% CI                    [77849.5, 80701.18][1401290.94, 1452621.31]

Absolute effect (s.d.)    -708.51 (727.48)   -12753.12 (13094.72)
95% CI                    [-2126.77, 724.92] [-38281.81, 13048.56]

Relative effect (s.d.)    -0.89% (0.92%)     -0.89% (0.92%)
95% CI                    [-2.68%, 0.91%]    [-2.68%, 0.91%]

Posterior tail-area probability p: 0.16
Posterior prob. of a causal effect: 84.12%

For more details run the command: print(impact.summary('report'))
And plot:
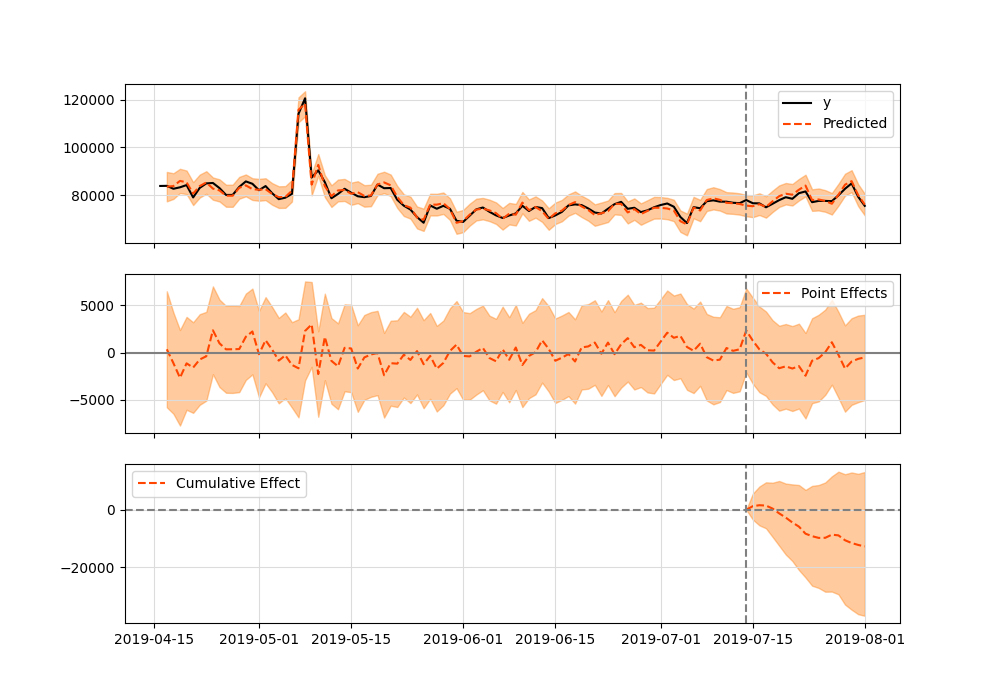
Both results are equivalent.
Performance
This package uses as default the Variational Inference method from TensorFlow Probability which is faster and should work for the most part. Convergence can take somewhere between 2~3 minutes on more complex time series. You could also try running the package on top of GPUs to see if results improve.
If, on the other hand, precision is the top requirement when running causal impact analyzes, it's possible to switch algorithms by manipulating the input arguments like so:
ci = CausalImpact(data, pre_period, post_period, model_args={'fit_method': 'hmc'})
This will make usage of the algorithm Hamiltonian Monte Carlo which is State-of-the-Art for finding the Bayesian posterior of distributions. Still, keep in mind that on complex time series with thousands of data points and complex modeling involving various seasonal components this optimization can take 1 hour or even more to complete (on a GPU). Performance is sacrificed in exchange for better precision.
Bugs & Issues
If you find bugs or have any issues while running this library please consider opening an Issue with a complete description and reproductible environment so we can better help you solving the problem.
1 maintainer

Release files for tfcausalimpact 0.0.19
For a detailed explanation of source distributions (sdists) and built distributions (wheels), please see the package formats documentation.
Source distribution (sdist)
| File | Size | Uploaded | |
|---|---|---|---|
| tfcausalimpact-0.0.19.tar.gz | 48.3 kB | Details |
Built distribution (wheel)
| File | Interpreter | ABI | Platform | Reset |
|---|---|---|---|---|
| tfcausalimpact-0.0.19-py3-none-any.whl | Python 3 | none | any | Details |
Total release size: 87.4 kB
Release files / tfcausalimpact-0.0.19.tar.gz
| Download URL | tfcausalimpact-0.0.19.tar.gz |
|---|---|
| Size | 48.3 kB |
| Tags | Source |
|
SHA-256 checksum How to use checksums |
a6131cd519a8108c1b71274e12619a184a15a7223035914d8a1e0af349276b53
|
|
BLAKE2b-256 checksum How to use checksums |
840bcec2b4b20dbb9db2a4964778736a8831eec89f7360f3f12a6b4a68290f38
|
| Upload date | |
|
Uploaded using Trusted Publishing? What is trusted publishing? |
No |
| Uploaded via |
twine/7.0.0 CPython/3.13.14
|
Release files / tfcausalimpact-0.0.19-py3-none-any.whl
| Download URL | tfcausalimpact-0.0.19-py3-none-any.whl |
|---|---|
| Size | 39.1 kB |
| Tags | Python 3 |
|
SHA-256 checksum How to use checksums |
e924f4b8062c24cd773c8f1163db0a5933e06911cdb11c588358308d29014c25
|
|
BLAKE2b-256 checksum How to use checksums |
8b2ad2b4273ba8f34bf68abf8df4e53a59de1054251d90c5a61fefbf1ee1de40
|
| Upload date | |
|
Uploaded using Trusted Publishing? What is trusted publishing? |
No |
| Uploaded via |
twine/7.0.0 CPython/3.13.14
|














