
Compression and interactive exploration of large-scale sequencing alignments with circular mapping support
Verified details
These details have been verified by PyPIProject links
GitHub Statistics
Maintainers

Project description

TheBIGbam is a genome browser and alignment viewer designed for massive metagenomic and metatranscriptomic datasets.
It enables compression and visualization of large genomic annotation (GenBank) and alignment files (BAM). It supports the generation of alignments with explicit circular-genome mapping.
Built with Rust for fast BAM processing and Python + Bokeh for interactive visualization.
Table of contents
- Installation
- Main usage
- Additional utilities
- Additional in-depth documentation pages
Installation
If you have conda installed on your computer, you can directly install theBIGbam with its dependencies (samtools, minimap2 and bwa-mem2 for mapping commands and blast for repeat detection):
conda create -n thebigbam -c conda-forge -c bioconda thebigbam
Alternatively, you can first install the dependencies in a python 3.10 environment before installing theBIGbam via pip:
conda create -n thebigbam -c conda-forge -c bioconda python=3.10 samtools=1.23 minimap2=2.30 bwa-mem2=2.3 blast=2.17
conda activate thebigbam
python3.10 -m pip install thebigbam
In the example we used conda, but the dependencies can be installed using any package manager (e.g. apt on Linux, brew on macOS) or from the binaries provided on their respective websites. If you do not plan to use the per-sample mapping command, samtools, minimap2, and bwa-mem2 are optional.
Check installation succeeded
Check main command works:
thebigbam -h
You can download the tests directory from the git repository to assess your installation:
git clone --filter=blob:none --sparse https://github.com/bhagavadgitadu22/theBIGbam
cd theBIGbam
git sparse-checkout set tests
Then check the calculate command works:
thebigbam calculate \
 -g tests/HK97/HK97_GCF_000848825.1_pharokka.gbk \
 -b tests/HK97/ \
 -o tests/HK97/test.db
Finally visualize interactively the test data:
thebigbam serve --db tests/HK97/test.db --port 5006
Open browser to http://localhost:5006 to see the visualization. If working from a remote server, see the Visualisation section.
Main usage
TheBIGbam consists of 3 main steps:
- (optional) Generation of alignment files for your samples with or without circular-genome support
- Generation of a DuckDB database summarizing your genomic and mapping files with Rust
- Interactive visualization of the DuckDB database content using Python and Bokeh
Quick usage with HK97 test data
# only available if you downloaded the mapping dependencies
thebigbam mapping-per-sample \
  -r1 tests/HK97/HK97_R1_illumina.fastq.gz \
  -r2 tests/HK97/HK97_R2_illumina.fastq.gz \
  -a tests/HK97/HK97_GCF_000848825.1.fasta \
  --circular -o tests/HK97/HK97_illumina_circular.bam

thebigbam calculate \
  -b tests/HK97 \
  -g tests/HK97/HK97_GCF_000848825.1_pharokka.gbk \
  -m coverage,misalignment \
  -o tests/HK97/HK97.db

thebigbam serve --db tests/HK97/HK97.db --port 5006
For more complex examples see the usage page.
Database computation
thebigbam calculate command converts large BAM files and associated annotated assemblies into a compact, queryable DuckDB database. The command can be performed either independently per contig or jointly across grouped contigs (e.g., MAGs, Metagenome-Assembled Genomes), allowing flexible analysis at different genomic aggregation levels.
Example command to compute the database for a single sample containing paired-end short reads mapped to the reference genome of phage HK97:
thebigbam calculate
-b tests/HK97
-g tests/HK97/HK97_GCF_000848825.1_pharokka.gbk
-m coverage,misalignment
-o tests/HK97/HK97.db
-t 4
TO-DO add MAG example?
For more complex examples see the usage page.
What input files do I need?
You need to provide at least one of the following:
-
BAM mapping files (
-b) -
GenBank annotation files (
-g)
If only annotation files are provided, contig-level data (annotations, GC content, repeats) are calculated without any sample-level mapping features.
If only BAM files are provided, assembly files of contigs (FASTA format) can be supplied with -a to allow the computation of sequence-dependent, mapping-derived features.
By default, thebigbam calculate is run independently per contig. If --view mag is chosen instead, the input path provided to -g or -a must be a directory comprising one file per MAG.
Alignment files
Parameter: --bam_files DIRECTORY, short-version -b
Your mapping files need to be sorted BAM files with MD tags. If you have mapping files but not in the right format, SAMtools is your friend!
# to convert a SAM/BAM file in a sorted BAM file
samtools view -bS example.sam | samtools sort -o example.sorted.bam

# to add an index file to your BAM file
samtools index example.sorted.bam

# to add MD tags to your BAM file
# you also need the fasta file used during the mapping step
samtools calmd -b example.sorted.bam ref.fasta > example.sorted.md.bam
Alternatively, you can produce your alignment files directly in theBIGbam as specified in the Mapping section.
Annotation files
Parameter: --genbank FILE or DIRECTORY, short-version -g
Annotation files should be in GenBank (.gbk, .gbff, .gb) or GFF3 (.gff, .gff3) format, made with the tool of your choice: bakta for bacteria, pharokka or phold for phages, eggnog-mapper for eukaryotes, etc.
Examples of commands to generate such annotations are available in the usage page.
Which features can I calculate?
Parameter (optional): --modules COMMA-SEPARATED LIST, short version -m
When BAM files are provided, theBIGbam performs fast Rust-based computations on them to extract relevant values. Individual read information is discarded in favor of lightweight per-position averages for each contig in each sample.
All mapping-derived modules are computed and stored in the database unless you provide a specific subset of modules. 6 mapping-derived modules exist at the moment:
- Coverage: computes per-position coverage for primary, secondary, and supplementary reads, as well as the mapping quality (MAPQ)
- Misalignment: computes per-position number of clippings, insertions, deletions and mismatches
- RNA: computes per-position number of splicings (necessitates alignment files made with RNA-seq aligners like STAR or HISAT2)
- Long-reads: computes per-position average length of reads
- Paired-reads: computes per-position average insert size of reads along with the number of incorrect pair orientations (non-inward pairs, mates unmapped or mapping or another contig)
- Phage termini: compute per-position coverage for primary-reads starting with an exact match (a short clipping < 5 bp is tolerated). Among those reads, the number of mapped reads starting and ending is computed. This module requires sequences to be provided to find terminal repeats
When sequences are provided, the Genome module is computed. It calculates GC content, GC skew and the repeats contained within each contig/MAG using an autoblast. Annotations (e.g. positions of the coding sequences and their functions) are also saved when available (GenBank file provided).
A more detailed explanation of the modules and the features it contains is available in the features section.
Database compression
Parameters (optional): --min_aligned_fraction, --min_coverage_depth, --coverage_percentage, --min_occurrences, --variation_percentage
Discarding the reads to only keep the main features of the mappings (like the coverage per position) already allows the DuckDB database to be way lighter than the original BAM file. The database itself is also structured to be as light as possible.
First, the database is organised per contig per sample (qualified as a contig/sample pair thereafter). Only pairs relative to a contig present in a sample are stored in the database. The definition of a presence can be tweaked via two parameters:
-
--min_aligned_fraction controls the minimum percentage of positions that received reads (default 50%, meaning a contig is considered present only if more than half of it received reads). In MAG view, --min_aligned_fraction applies to the MAG instead of each contig.
-
--min_coverage_depth sets the minimum mean coverage depth required for contig inclusion (default 0, i.e. disabled — set to e.g. 5 to filter out contigs with very low depth that produce noisy signals). In MAG view, --min_coverage_depth applies to the MAG instead of each contig.
To further reduce the size of the database, values per feature are filtered rather than saving all positions. The type of compression depends on the type of plots:
-
Only positions with values above a defined percentage of the local coverage are retained for Bar plots (Misalignment and Phage termini module except for "Coverage reduced" feature). For each position, values are compared to the local coverage and discarded if they fall below the --coverage_percentage threshold (default 10%), ensuring that only meaningful peaks are preserved. In addition, an event must occur more than --min_occurrences to be considered (default 2).
-
Dense features (coverage, MAPQ, insert sizes, read lengths) can optionally be smoothed using --variation_percentage (default 0, disabled). Consecutive positions within this percentage of each other are collapsed to the same value, substantially reducing database size. The minimum and maximum values within each run are tracked, and a new entry is created when the range of values in the run exceeds a threshold relative to the smallest absolute value, defined as:
$\text{max}(\text{run}) - \text{min}(\text{run}) > r \times \text{min}(\text{run})$
Where r is the --variation_percentage. This mode produces significantly smaller databases at the cost of per-position precision, making it suitable for visualization and long-term storage when storage space is limited.
The output is a DuckDB database that is typically 10-100 times smaller than the original BAM files while retaining the essential characteristics of the mapping data. When using theBIGbam only for annotation files, the main objective is visualization, as the output database is typically similar in size to the original file.
For more information see the compression section.
Metrics computed per contig/MAG and per sample
In addition to per-position information, summary metrics are computed and stored in the database per contig, per sample and per contig–sample pair. In the MAG view, metrics relevant at the MAG level are computed twice: once at the contig level and once at the MAG level.
These metrics combine the per-position values into average values like the coverage mean to help identify informative contig–sample pairs without requiring specific hypotheses.
Metrics belong to several categories:
- Presence detection (also available for MAGs)
- Misassembly (also available for MAGs)
- Microdiversity (also available for MAGs)
- Side misassembly
- Topology
- Phage termini
A description of all metrics is available in the filters section.
Visualization
Once the database has been computed, it can be visualized interactively using thebigbam serve command. This starts a local web server that hosts the interactive plots.
Example command:
thebigbam serve --db tests/HK97/HK97.db --port 5006
Serving from a remote server
If calculating and serving the database from a remote machine without graphical interface, you can use SSH port forwarding to access the visualization on your local machine.
For example, if your remote server is remote.server.com and you want to forward port 5006, you can run the following command on your local machine:
ssh -N -L 5006:localhost:5006 user@remote.server.com
If running the job on a compute node, you first need to find which node your job is running on (e.g. node042) using squeue -u $USER, then tunnel through the login node to the compute node:
ssh -L 5006:node042:5006 user@cluster.address
Web interface overview
When accessing the web server (http://localhost:5006), you will be presented with a web interface:
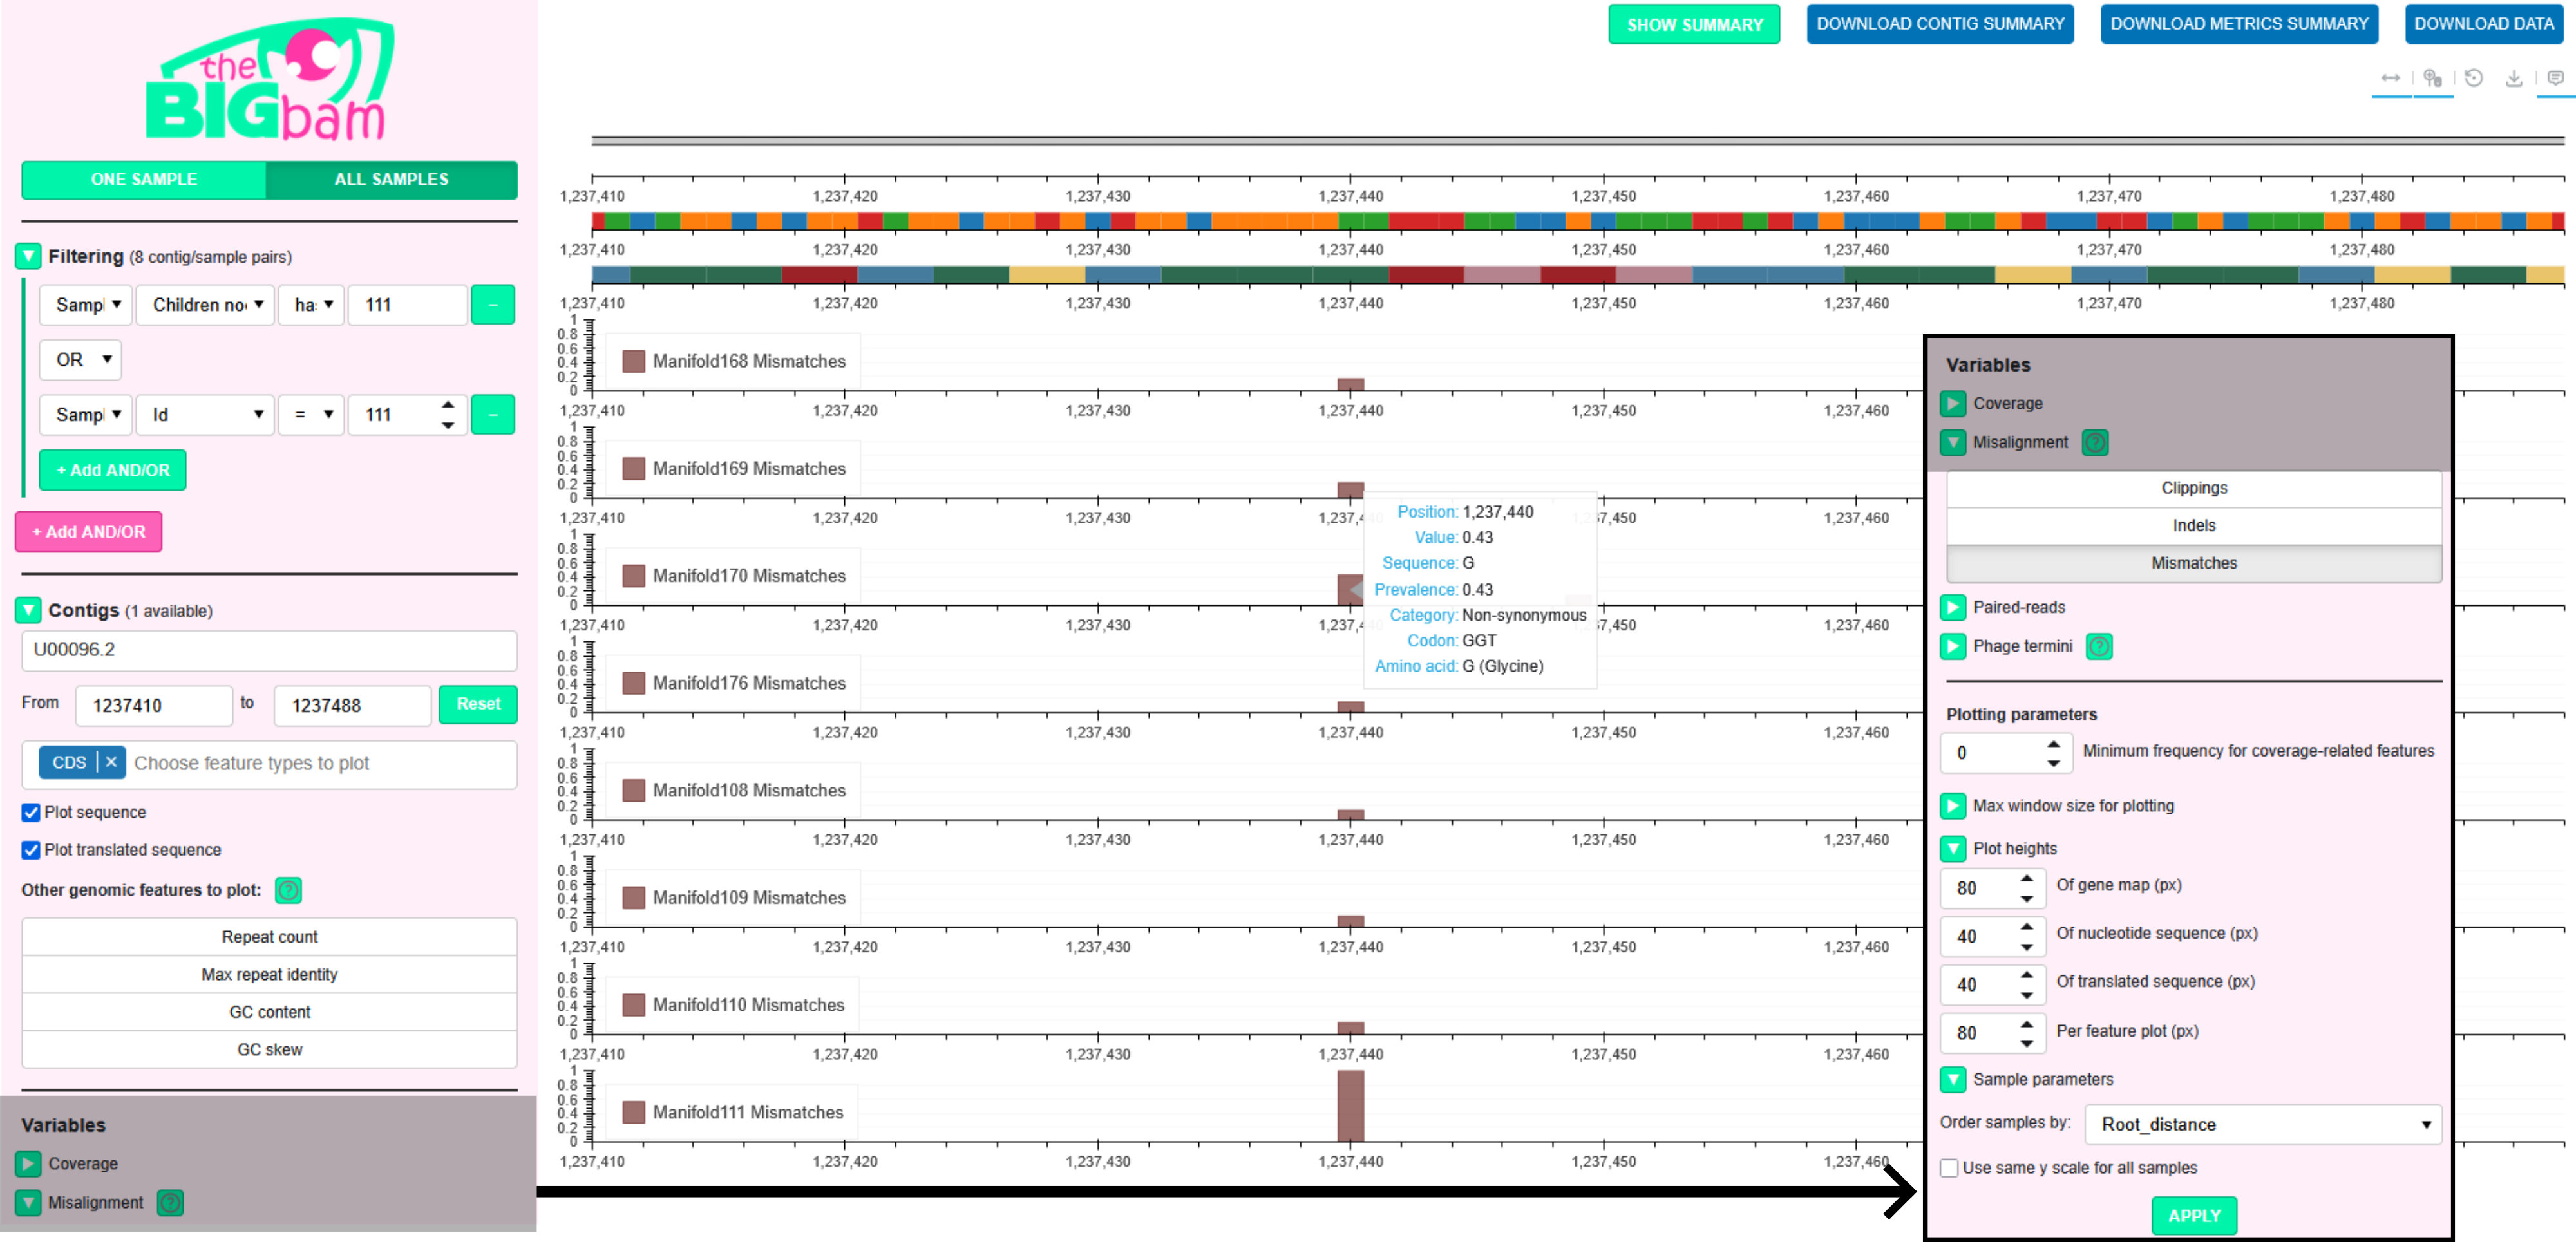
One Sample mode
You are initially in the One Sample mode, which allows exploration of all computed features for a single sample. Several sections on the left panel control what is plotted:
-
Filtering: Only pairs of contig/samples matching the selected filters are available in the Contigs and Samples sections. For instance, if the contig length filter is set to >10 kbp, only contigs longer than this threshold will appear in the Contigs section, and only samples containing at least one such contig will appear in the Samples section. To consult the list of filters available have a look at the filtering page
-
Contigs: Select the contig you want to explore. If annotations were provided when creating the database, a gene map can be plotted: users can choose which features to include on the map and customize their colors and labels. In addition, if sequence data was provided when creating the database, genomic features can be selected for plotting: repeats within contigs (and within MAGs in MAG view), GC content, GC skew
-
Samples: Select the sample you want to explore
-
Variables: Select the features to plot. You can either use the checkboxes to select all features from a module or click individual features within a module
-
Plotting parameters: You can customize several aesthetic aspects of the plots (e.g. the heights of the genomic feature tracks and mapping-derived plots)
Finally, click Apply to visualize the requested features for the selected contig and sample. Alternatively, click Peruse Data to display tables containing the metrics and feature values.
All Samples mode
All Samples mode enables comparison of a specific feature across multiple samples. Compared to the One Sample mode, the Samples section is omitted, and only a single feature can be selected in the Variables section (e.g. mismatches on the figure above).
MAG view
For a database computed with --view mag, a MAGs section is added to the visualization. Users can select a MAG of interest and then choose a contig from this MAG in the Contigs section.
The MAG and contig filters in the Filtering panel affect the list of MAGs displayed in the MAGs section. Only MAGs containing at least one contig passing the contig filters are included in the MAG list. Only contigs belonging to a MAG passing the MAG filters are included in the contig list.
Plots can be generated in the standard contig-based view or in MAG view, which displays an entire MAG at once. In MAG view, contigs are ordered from longest to shortest, and an additional MAG track is shown above the plots to indicate which contigs are currently being visualized.
Plotting
Genomic tracks are plotted at the top and mapping-derived features below. On the figure for instance, you can see the gene map, the sequence track and the codon track. Below are displayed the mismatch track for the samples in display (All Samples mode).
All plots leverage the full capabilities of Bokeh: you can pan, zoom, and hover over specific points to inspect local values. For Misalignment tracks, the dominant alternative sequences among the misaligned reads is displayed, in addition with the potential replacement codon for mismatches (for example a Glycine on the figure above).
Buttons in the top-right section allow you to disable pan, zoom, or hover interactions, reset the plots to their original state, and export the current view as a PNG image.
In addition, the green button SHOW SUMMARY opens a new html page showing the characteristics of the contig, MAG, sample(s) in display along with the metrics computed per contig per sample for the contig and samples in display.
Users can download this data via the blue buttons:
-
DOWNLOAD CONTIG METRICS: Downloads the metrics relative to the contig in all samples in display
-
DOWNLOAD MAG METRICS: Downloads the metrics relative to the MAG in all samples in display (only available for MAG-aware databases)
-
DOWNLOAD DATA: Generates the command required to download all plotted data. This command has to be executed outside the browser to avoid browser-side lag
Adaptive resolution rendering
Sequences and contig annotations are only informative at small scales. By default:
- Sequences are displayed for windows ≤ 1 kbp
- Gene maps are displayed for windows ≤ 100 kbp
- Genomic and mapping-derived features are shown at full resolution for windows ≤ 10 kbp
These three thresholds can be modified in the Plotting parameters section, under Max window size for plotting.
For windows larger than these thresholds, genomic and mapping-derived features are displayed using binned data:
- For curve plots, the average value within each bin is shown
- For bar plots, the maximum value within each bin is shown to highlight the most critical regions
The binning resolution depends on the window size:
- Up to 100 kbp: 100 bp bins
- Up to 1 Mbp: 1 kbp bins
- Above 1 Mbp: 10 kbp bins
When zooming or panning, you need to re-click APPLY to refresh the plots with the current window size. For more information consult the visualization section.
Mapping
TheBIGbam is not a read aligner: it relies on minimap2 or bwa-mem2 for alignment, applying minimal modifications to generate output compatible with thebigbam calculate command. thebigbam mapping-per-sample command produces sorted, indexed BAM files with MD tags.
Default mapping uses minimap2 for short reads while keeping secondary and supplementary reads. The mapper preset of settings can be changed with the --mapper option:
-
minimap2-sr: minimap2 with short-reads preset
-
minimap2-sr-secondary: minimap2 short-read preset, but retains secondary alignments (default)
-
bwa-mem2: BWA-MEM2 for short reads
-
minimap2-ont: minimap2 with Oxford Nanopore preset
-
minimap2-pb: minimap2 with PacBio CLR preset
-
minimap2-hifi: minimap2 with PacBio HiFi preset
-
minimap2-no-preset: minimap2 with no preset (advanced users, parameters can be provided using
--minimap2-paramsinstead)
Additional parameters can be provided to minimap2 and bwa-mem2 using the --minimap2-params and --bwa-params options. Those paramaters takes precedence over the presets parameters if different values for the same parameter are provided.
In addition, alignments can optionally be filtered to retain only reads meeting a minimum identity threshold with the reference (--min-read-percent-identity) and a minimum aligned coverage threshold (--min-read-aligned-percent).
Mapping with circular genome support
The --circular flag is a specificity of theBIGbam mapping allowing explicit circular genome support. To do that, each contig is duplicated prior to alignment, enabling seamless mapping across the junction. Artificial secondary and supplementary alignments arising from the duplication are removed, and reads are reassigned to their correct positions before output. This approach preserves consistent coverage at contig ends of circular genomes.
Example command:
thebigbam mapping-per-sample
-r1 tests/HK97/HK97_R1_illumina.fastq.gz
-r2 tests/HK97/HK97_R2_illumina.fastq.gz
-a tests/HK97/HK97_GCF_000848825.1.fasta
--circular -o tests/HK97/HK97_illumina_circular.bam
For more details on theBIGbam circular genome support, you can consult the circular mapping page.
Additional utilities
Extending annotation files
All annotations provided through annotation files are stored in the database during its creation. Therefore, you may want to enrich your annotation files with additional metadata before computing the database. This is done via:
thebigbam add-contig-annotations -g tests/HK97/HK97_GCF_000848825.1_pharokka.gbk --csv new_qualifiers.csv --match-by feature_type,ID -o annotations_enriched.gbk
Where new_qualifiers.tsv contains:
- Columns specified in
--match-by, used to identify the features to update - Additional columns corresponding to new qualifier–value pairs to add to matching features
feature_type,ID,new_qualifier,new_qualifier2
CDS,TTVDVOOI_CDS_0006,butter,butter2
CDS,TTVDVOOI_CDS_0010,,butter3
In this example, the new file annotations_enriched.gbk will contain new annotations:
- The feature
TTVDVOOI_CDS_0006receives the qualifiersnew_qualifier=butterandnew_qualifier2=butter2 - The feature
TTVDVOOI_CDS_0010receives onlynew_qualifier2=butter3, as empty values are ignored
Database maintenance
Consult DATABASE.md for instructions on reading and modifying the database after it has been created. You can add, remove, or list samples, contigs, and variables. You can also design more complex queries using SQL.
Exporting data
Export any metric as a TSV matrix (with contigs as rows and samples as columns):
thebigbam export -d tests/HK97/HK97.db --metric Coverage_mean -o tests/HK97/coverage.tsv
Run thebigbam export -h to see the full list of available metrics.
Inspecting data
Any per-position feature stored in the database can be exported as a TSV file using the inspect command. Example:
thebigbam inspect -d tests/HK97/HK97.db --contig NC_002167.1 --sample HK97_illumina_circular --feature coverage,mismatches > output.tsv
The output is a TSV with one row per run of consecutive positions sharing the same value, with columns: contig, sample, feature, position_start, position_end, and value.
You can query multiple features, contigs or samples at once by providing comma-separated names. For databases computed with --view mag, use --mag instead of --contig to export all contigs belonging to a MAG at once (adds a mag column to the output). Contig-level features (e.g. gc_content, gc_skew, repeats) do not require --sample.
To inspect features at a coarser resolution, use --zoom (0 = 100 bp bins, 1 = 1 kbp, 2 = 10 kbp). To restrict the output to a specific region, use --region (e.g. --region 1000-2000 to get data between positions 1 kbp and 2 kbp).
Run thebigbam inspect -h to see the full list of options.
Analyse data
Databases computed by theBIGbam contains a wealth of information that can be used in downstream analysis. Generic analysis scripts are available via the analysis command.
At the moment both scripts available serve to export per-CDS (Coding DNA Sequences) summaries from the database for gene-level comparative analyses:
cds-annotationsto export annotation information for all coding sequences:
thebigbam analysis cds-annotations --db tests/HK97/HK97.db --output cds_annotations.tsv
The output contains one row per CDS with coordinates, strand, GC content, and all qualifier fields found in the annotation file (product, function, etc.). Each gene is assigned a unique name following the pattern <contig_name>_tbb_, numbered sequentially by start position.
cds-mapping-patternsto export per-CDS mapping signals for each sample:
thebigbam analysis cds-mapping-patterns --db tests/HK97/HK97.db --output cds_patterns.tsv
The output contains one row per (sample, CDS) pair, with:
-
CDS coverage metrics (aligned fraction, median depth, etc.),
-
CDS misalignment metrics for mismatches, insertions, deletions, clippings (number of concerned positions in the CDS, etc.)
-
Additional metrics for mismatches: number of synonymous/non-synonymous positions, dN/dS ratio
Run thebigbam analysis -h to display the list of available analysis scripts. Run thebigbam analysis <script_name> -h to view detailed documentation for a specific analysis script, including a description of its outputs.
Additional in-depth documentation pages
- How to run theBIGbam on big projects? TO-DO add MAG
- On mapping with circular genome support
- Features TO-DO
- Compression TO-DO
- Filters TO-DO
- Misalignment TO-DO
- Phage packaging TO-DO
- Assembly check TO-DO, to merge with FILTERS.md
- Database TO-DO
- Visualization TO-DO
- Plot interpretation TO-DO, discard?
- Developers note TO-DO, to merge with contributing?
- Contributing TO-DO
- Installation guide to remove?
TO-DO: check the list! Specify that links only work on main github page not pypi page
Crucial to have proper unitary tests and tests behind that!
Project details
Verified details
These details have been verified by PyPIProject links
GitHub Statistics
Maintainers
Release history Release notifications | RSS feed


Download files
Download the file for your platform. If you're not sure which to choose, learn more about installing packages.
Source Distribution
Built Distributions
Filter files by name, interpreter, ABI, and platform.
If you're not sure about the file name format, learn more about wheel file names.
Copy a direct link to the current filters
File details
Details for the file thebigbam-0.3.0.tar.gz.
File metadata
- Download URL: thebigbam-0.3.0.tar.gz
- Upload date:
- Size: 14.4 MB
- Tags: Source
- Uploaded using Trusted Publishing? Yes
- Uploaded via: twine/6.1.0 CPython/3.13.12
File hashes
| Algorithm | Hash digest | |
|---|---|---|
| SHA256 |
80e239f672fa5a0b2837a8bc57979506404a4fcdd85224dd7acd1cb44c7162ae
|
|
| MD5 |
5dfef9f43f172985dcdc05f83665a773
|
|
| BLAKE2b-256 |
0a7e03683bc9cecb103ed7d3de4cb25f27c18ec6ceb3949813fa839dd279a2d5
|
Provenance
The following attestation bundles were made for thebigbam-0.3.0.tar.gz:
Publisher:
ci.yml on bhagavadgitadu22/theBIGbam
-
Statement:
-
Statement type:
https://in-toto.io/Statement/v1 -
Predicate type:
https://docs.pypi.org/attestations/publish/v1 -
Subject name:
thebigbam-0.3.0.tar.gz -
Subject digest:
80e239f672fa5a0b2837a8bc57979506404a4fcdd85224dd7acd1cb44c7162ae - Sigstore transparency entry: 1584054982
- Sigstore integration time:
-
Permalink:
bhagavadgitadu22/theBIGbam@54e01ea479eb728dedb29ce5b68dad26755435d5 -
Branch / Tag:
refs/tags/v0.3.0 - Owner: https://github.com/bhagavadgitadu22
-
Access:
public
-
Token Issuer:
https://token.actions.githubusercontent.com -
Runner Environment:
github-hosted -
Publication workflow:
ci.yml@54e01ea479eb728dedb29ce5b68dad26755435d5 -
Trigger Event:
push
-
Statement type:
File details
Details for the file thebigbam-0.3.0-cp310-abi3-manylinux_2_28_x86_64.whl.
File metadata
- Download URL: thebigbam-0.3.0-cp310-abi3-manylinux_2_28_x86_64.whl
- Upload date:
- Size: 15.0 MB
- Tags: CPython 3.10+, manylinux: glibc 2.28+ x86-64
- Uploaded using Trusted Publishing? Yes
- Uploaded via: twine/6.1.0 CPython/3.13.12
File hashes
| Algorithm | Hash digest | |
|---|---|---|
| SHA256 |
3f3cead4d2af202cee55f7ca2024ffc8f565c7f3f3524af3d9588290cc7bb9be
|
|
| MD5 |
12528fb33a287136c89f999c5bab571f
|
|
| BLAKE2b-256 |
927a4f8d93d38a90d6246da260bb4d1b82462fc3ae0af190376fab88b9ba9c9e
|
Provenance
The following attestation bundles were made for thebigbam-0.3.0-cp310-abi3-manylinux_2_28_x86_64.whl:
Publisher:
ci.yml on bhagavadgitadu22/theBIGbam
-
Statement:
-
Statement type:
https://in-toto.io/Statement/v1 -
Predicate type:
https://docs.pypi.org/attestations/publish/v1 -
Subject name:
thebigbam-0.3.0-cp310-abi3-manylinux_2_28_x86_64.whl -
Subject digest:
3f3cead4d2af202cee55f7ca2024ffc8f565c7f3f3524af3d9588290cc7bb9be - Sigstore transparency entry: 1584055422
- Sigstore integration time:
-
Permalink:
bhagavadgitadu22/theBIGbam@54e01ea479eb728dedb29ce5b68dad26755435d5 -
Branch / Tag:
refs/tags/v0.3.0 - Owner: https://github.com/bhagavadgitadu22
-
Access:
public
-
Token Issuer:
https://token.actions.githubusercontent.com -
Runner Environment:
github-hosted -
Publication workflow:
ci.yml@54e01ea479eb728dedb29ce5b68dad26755435d5 -
Trigger Event:
push
-
Statement type:
File details
Details for the file thebigbam-0.3.0-cp310-abi3-manylinux_2_28_aarch64.whl.
File metadata
- Download URL: thebigbam-0.3.0-cp310-abi3-manylinux_2_28_aarch64.whl
- Upload date:
- Size: 12.8 MB
- Tags: CPython 3.10+, manylinux: glibc 2.28+ ARM64
- Uploaded using Trusted Publishing? Yes
- Uploaded via: twine/6.1.0 CPython/3.13.12
File hashes
| Algorithm | Hash digest | |
|---|---|---|
| SHA256 |
ac3032159d8396c20927204ba36a5cc88f894a113ebff86c64ab7e98ce2b98a9
|
|
| MD5 |
363329c29b6bd04c5fbce0a076f847f6
|
|
| BLAKE2b-256 |
ed7bc952d8a992f73cd1213e6b4f5c710ccf11e1332582a4268ebd3b789937b7
|
Provenance
The following attestation bundles were made for thebigbam-0.3.0-cp310-abi3-manylinux_2_28_aarch64.whl:
Publisher:
ci.yml on bhagavadgitadu22/theBIGbam
-
Statement:
-
Statement type:
https://in-toto.io/Statement/v1 -
Predicate type:
https://docs.pypi.org/attestations/publish/v1 -
Subject name:
thebigbam-0.3.0-cp310-abi3-manylinux_2_28_aarch64.whl -
Subject digest:
ac3032159d8396c20927204ba36a5cc88f894a113ebff86c64ab7e98ce2b98a9 - Sigstore transparency entry: 1584055238
- Sigstore integration time:
-
Permalink:
bhagavadgitadu22/theBIGbam@54e01ea479eb728dedb29ce5b68dad26755435d5 -
Branch / Tag:
refs/tags/v0.3.0 - Owner: https://github.com/bhagavadgitadu22
-
Access:
public
-
Token Issuer:
https://token.actions.githubusercontent.com -
Runner Environment:
github-hosted -
Publication workflow:
ci.yml@54e01ea479eb728dedb29ce5b68dad26755435d5 -
Trigger Event:
push
-
Statement type:
File details
Details for the file thebigbam-0.3.0-cp310-abi3-macosx_11_0_arm64.whl.
File metadata
- Download URL: thebigbam-0.3.0-cp310-abi3-macosx_11_0_arm64.whl
- Upload date:
- Size: 11.4 MB
- Tags: CPython 3.10+, macOS 11.0+ ARM64
- Uploaded using Trusted Publishing? Yes
- Uploaded via: twine/6.1.0 CPython/3.13.12
File hashes
| Algorithm | Hash digest | |
|---|---|---|
| SHA256 |
c688a672697fc9bf3574faa961d6fa35f2b4f7878f2697f8e238d1e4b9a3aabf
|
|
| MD5 |
6c7abd307325433c85acebc63980a5f9
|
|
| BLAKE2b-256 |
150e99abe743d17187d5e114f32475d8c7b885920da53bb37fec93cc90896851
|
Provenance
The following attestation bundles were made for thebigbam-0.3.0-cp310-abi3-macosx_11_0_arm64.whl:
Publisher:
ci.yml on bhagavadgitadu22/theBIGbam
-
Statement:
-
Statement type:
https://in-toto.io/Statement/v1 -
Predicate type:
https://docs.pypi.org/attestations/publish/v1 -
Subject name:
thebigbam-0.3.0-cp310-abi3-macosx_11_0_arm64.whl -
Subject digest:
c688a672697fc9bf3574faa961d6fa35f2b4f7878f2697f8e238d1e4b9a3aabf - Sigstore transparency entry: 1584055335
- Sigstore integration time:
-
Permalink:
bhagavadgitadu22/theBIGbam@54e01ea479eb728dedb29ce5b68dad26755435d5 -
Branch / Tag:
refs/tags/v0.3.0 - Owner: https://github.com/bhagavadgitadu22
-
Access:
public
-
Token Issuer:
https://token.actions.githubusercontent.com -
Runner Environment:
github-hosted -
Publication workflow:
ci.yml@54e01ea479eb728dedb29ce5b68dad26755435d5 -
Trigger Event:
push
-
Statement type:
File details
Details for the file thebigbam-0.3.0-cp310-abi3-macosx_10_12_x86_64.whl.
File metadata
- Download URL: thebigbam-0.3.0-cp310-abi3-macosx_10_12_x86_64.whl
- Upload date:
- Size: 13.1 MB
- Tags: CPython 3.10+, macOS 10.12+ x86-64
- Uploaded using Trusted Publishing? Yes
- Uploaded via: twine/6.1.0 CPython/3.13.12
File hashes
| Algorithm | Hash digest | |
|---|---|---|
| SHA256 |
88c4ea201413c54a39bfad767dfd44fd0a99831141d814ff8beb530bcf9d72d5
|
|
| MD5 |
a0171a97e3e5ff6c5e50b5c7f7f7c584
|
|
| BLAKE2b-256 |
2814a2c70d765718b0159577224748e9f66899d999eeb9edccfd83050022b591
|
Provenance
The following attestation bundles were made for thebigbam-0.3.0-cp310-abi3-macosx_10_12_x86_64.whl:
Publisher:
ci.yml on bhagavadgitadu22/theBIGbam
-
Statement:
-
Statement type:
https://in-toto.io/Statement/v1 -
Predicate type:
https://docs.pypi.org/attestations/publish/v1 -
Subject name:
thebigbam-0.3.0-cp310-abi3-macosx_10_12_x86_64.whl -
Subject digest:
88c4ea201413c54a39bfad767dfd44fd0a99831141d814ff8beb530bcf9d72d5 - Sigstore transparency entry: 1584055111
- Sigstore integration time:
-
Permalink:
bhagavadgitadu22/theBIGbam@54e01ea479eb728dedb29ce5b68dad26755435d5 -
Branch / Tag:
refs/tags/v0.3.0 - Owner: https://github.com/bhagavadgitadu22
-
Access:
public
-
Token Issuer:
https://token.actions.githubusercontent.com -
Runner Environment:
github-hosted -
Publication workflow:
ci.yml@54e01ea479eb728dedb29ce5b68dad26755435d5 -
Trigger Event:
push
-
Statement type:






