

The artist formerly known as matplotlib2tikz.












This is a patched version of tikzplotlib, a Python tool for converting matplotlib figures into PGFPlots (PGF/TikZ) figures like
for native inclusion into LaTeX or ConTeXt documents.
This version contains patches from JasonGross/tikzplotlib/patched.
The output of tikzplotlib is in PGFPlots, a TeX library that sits on top of PGF/TikZ and describes graphs in terms of axes, data etc. Consequently, the output of tikzplotlib
- retains more information,
- can be more easily understood, and
- is more easily editable
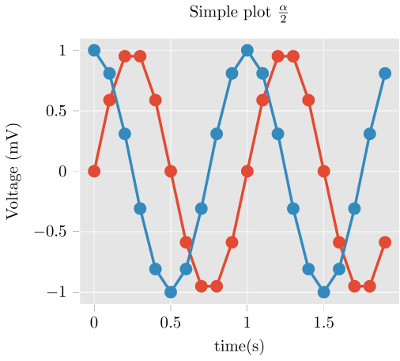
than raw TikZ output. For example, the matplotlib figure
import matplotlib.pyplot as plt
import numpy as np

plt.style.use("ggplot")

t = np.arange(0.0, 2.0, 0.1)
s = np.sin(2 * np.pi * t)
s2 = np.cos(2 * np.pi * t)
plt.plot(t, s, "o-", lw=4.1)
plt.plot(t, s2, "o-", lw=4.1)
plt.xlabel("time (s)")
plt.ylabel("Voltage (mV)")
plt.title("Simple plot $\\frac{\\alpha}{2}$")
plt.grid(True)

import tikzplotlib

tikzplotlib.save("test.tex")
import matplotlib as mpl

plt.close()
mpl.rcParams.update(mpl.rcParamsDefault)
--> (see above) gives
\begin{tikzpicture}

\definecolor{color0}{rgb}{0.886274509803922,0.290196078431373,0.2}
\definecolor{color1}{rgb}{0.203921568627451,0.541176470588235,0.741176470588235}

\begin{axis}[
axis background/.style={fill=white!89.8039215686275!black},
axis line style={white},
tick align=outside,
tick pos=left,
title={Simple plot \(\displaystyle \frac{\alpha}{2}\)},
x grid style={white},
xlabel={time (s)},
xmajorgrids,
xmin=-0.095, xmax=1.995,
xtick style={color=white!33.3333333333333!black},
y grid style={white},
ylabel={Voltage (mV)},
ymajorgrids,
ymin=-1.1, ymax=1.1,
ytick style={color=white!33.3333333333333!black}
]
\addplot [line width=1.64pt, color0, mark=*, mark size=3, mark options={solid}]
table {%
0 0
0.1 0.587785252292473
% [...]
1.9 -0.587785252292473
};
\addplot [line width=1.64pt, color1, mark=*, mark size=3, mark options={solid}]
table {%
0 1
0.1 0.809016994374947
% [...]
1.9 0.809016994374947
};
\end{axis}

\end{tikzpicture}
(Use get_tikz_code() instead of save() if you want the code as a string.)
Tweaking the plot is straightforward and can be done as part of your TeX work flow. The fantastic PGFPlots manual contains great examples of how to make your plot look even better.
Of course, not all figures produced by matplotlib can be converted without error. Notably, 3D plots don't work.
Installation
tikzplotlib is available from the Python Package Index, so simply do
pip install tikzplotlib
to install.
Usage
-
Generate your matplotlib plot as usual.
-
Instead of
pyplot.show(), invoke tikzplotlib byimport tikzplotlib tikzplotlib.save("mytikz.tex") # or tikzplotlib.save("mytikz.tex", flavor="context")
to store the TikZ file as
mytikz.tex. -
Add the contents of
mytikz.texinto your TeX source code. A convenient way of doing so is via\input{/path/to/mytikz.tex}
Also make sure that the packages for PGFPlots and proper Unicode support and are included in the header of your document:
\usepackage[utf8]{inputenc}
\usepackage{pgfplots}
\DeclareUnicodeCharacter{2212}{−}
\usepgfplotslibrary{groupplots,dateplot}
\usetikzlibrary{patterns,shapes.arrows}
\pgfplotsset{compat=newest}
or:
\setupcolors[state=start]
\usemodule[tikz]
\usemodule[pgfplots]
\usepgfplotslibrary[groupplots,dateplot]
\usetikzlibrary[patterns,shapes.arrows]
\pgfplotsset{compat=newest}
\unexpanded\def\startgroupplot{\groupplot}
\unexpanded\def\stopgroupplot{\endgroupplot}
You can also get the code via:
import tikzplotlib

tikzplotlib.Flavors.latex.preamble()
# or
tikzplotlib.Flavors.context.preamble()
-
[Optional] Clean up the figure before exporting to tikz using the
clean_figurecommand.import matplotlib.pyplot as plt import numpy as np # ... do your plotting import tikzplotlib tikzplotlib.clean_figure() tikzplotlib.save("test.tex")
The command will remove points that are outside the axes limits, simplify curves and reduce point density for the specified target resolution.
The feature originated from the matlab2tikz project and is adapted to matplotlib.
Contributing
If you experience bugs, would like to contribute, have nice examples of what tikzplotlib can do, or if you are just looking for more information, then please visit tikzplotlib's GitHub page.
Testing
tikzplotlib has automatic unit testing to make sure that the software doesn't
accidentally get worse over time. In test/, a number of test cases are specified.
Those run through tikzplotlib and compare the output with a previously stored reference
TeX file.
To run the tests, just check out this repository and type
pytest
License
tikzplotlib is published under the MIT license.
1 maintainer

Download files
Download the file for your platform. If you're not sure which to choose, learn more about installing packages.
Source Distribution
Built Distribution
Filter files by name, interpreter, ABI, and platform.
If you're not sure about the file name format, learn more about wheel file names.
Copy a direct link to the current filters
File details
Details for the file tikzplotlib_patched-0.10.1.post10.tar.gz.
File metadata
- Download URL: tikzplotlib_patched-0.10.1.post10.tar.gz
- Upload date:
- Size: 112.0 kB
- Tags: Source
- Uploaded using Trusted Publishing? No
- Uploaded via:
python-requests/2.32.3
File hashes
| Algorithm | Hash digest | |
|---|---|---|
| SHA256 |
6887c8cb769a1e5429a99ccffc99bf94c4aa1be4ce13c199def817769d80ccdc
|
|
| MD5 |
1ca4236f197694ebff11b55394c95c94
|
|
| BLAKE2b-256 |
4c89a7781d902970cfd6c776ce1d8f889e73357f62088e9c14efcdb652da7827
|
File details
Details for the file tikzplotlib_patched-0.10.1.post10-py3-none-any.whl.
File metadata
- Download URL: tikzplotlib_patched-0.10.1.post10-py3-none-any.whl
- Upload date:
- Size: 57.0 kB
- Tags: Python 3
- Uploaded using Trusted Publishing? No
- Uploaded via:
python-requests/2.32.3
File hashes
| Algorithm | Hash digest | |
|---|---|---|
| SHA256 |
9052a41a38b8d49a8cd622a3aa360e41bd24a05543464564eb663e7f279641ed
|
|
| MD5 |
162636c0ec0fd6d044f8ff4df286300c
|
|
| BLAKE2b-256 |
789a07a769f2476934095d126170e9778c09025946e4271490c3342a33a5c1aa
|














