
timeSpace
Stommel diagrams for visualizing biogeochemical and physical processes across scales of time and space.


What it does
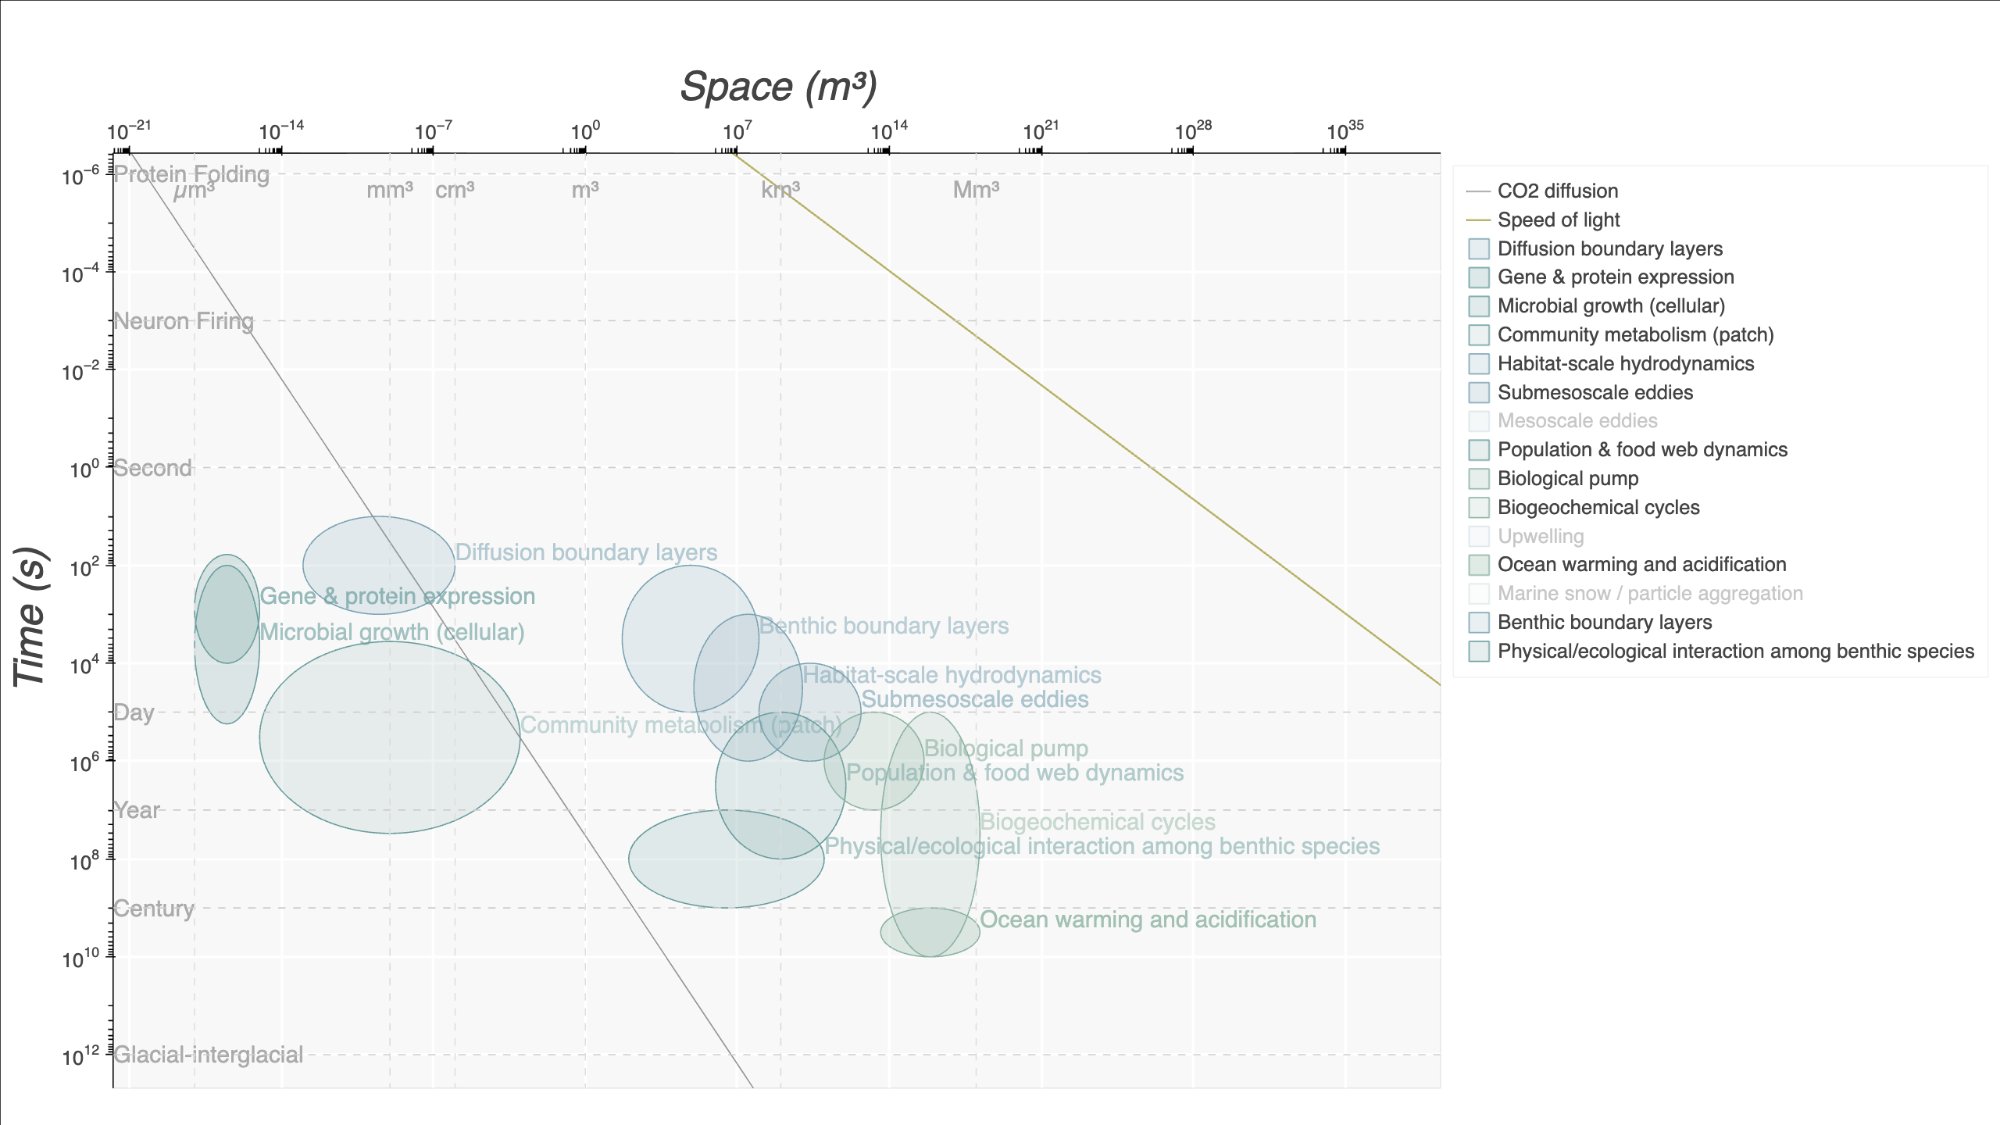
timeSpace plots processes and reference objects on log-log Stommel diagrams — a visualization framework where the x-axis represents spatial scale (m³) and the y-axis represents temporal scale (s), as shown in Fig. 1.
See CONVENTIONS.md for details on axis orientation and units. Processes are rendered as ellipses sized to their characteristic ranges, with diffusion lines overlaid to show transport regimes. This makes it easy to see which processes dominate at which scales and how they relate to one another.
Install
pip install timeSpace            # core (Bokeh diagrams)
pip install timeSpace[dev]       # + pytest, black, flake8
Note: PyPI normalizes the package name to
timespace, but the Python import uses camelCase:import timeSpace.
Quickstart
import timeSpace
import pandas as pd
from timeSpace import (
    create_space_time_figure,
    add_magnitude_labels,
    add_diffusion_lines,
    add_light_cone,
    add_predefined_processes,
    add_legend,
)
from timeSpace.etl import transform_predefined_processes

# Load bundled process data
csv_path = timeSpace.PROJECT_ROOT / "data" / "datasets" / "stommel_boyd2015_volumes.csv"
data = pd.read_csv(csv_path)
df = transform_predefined_processes(data)

# Build the diagram
p = create_space_time_figure()
p = add_magnitude_labels(p)
p = add_diffusion_lines(p)
p = add_light_cone(p)
p = add_predefined_processes(p, df)
p = add_legend(p)

from bokeh.plotting import show
show(p)
To see it in action, open the reference-object explorer (102 everyday and scientific objects, each with its source), or plot your own objects alongside them in the explorer notebook.
Conventions
See CONVENTIONS.md for details on axis orientation (Boyd vs. classic Stommel), volume units (m³) for spatial scale, the diffusion equation (3D RMS: √(6Dt)), and data file schemas.
Data Format
All spatial values are volumes in m³ (not lengths). All temporal values are durations in seconds. Both axes are plotted on log₁₀ scales.
CSV columns for process data:
- Required:
Name,Time_min,Time_max,Space_min,Space_max - Optional:
Color,Category,Notes,label_side,x_offset,y_offset,label_text
Values use scientific notation with an optional magnitude description, e.g. 1.00E-03: ~1 mm³. The ETL layer parses the numeric portion before the colon; the description is for human readability.
See CONVENTIONS.md for the full schema specification.
Plotting Functions: add_processes vs add_predefined_processes
Use add_predefined_processes(p, df) for a prebundled set of processe spanning time and space — it expects data processed via transform_predefined_processes() with pre-assigned colors and categories.
Use add_processes(p, df) for your own data — it supports grouping, custom colors via category_col and category_colors, and per-row label_side control. Expects data from transform_process_response_sheet().
# Bundled dataset
from timeSpace.etl import transform_predefined_processes
df = transform_predefined_processes(pd.read_csv(csv_path))
p = add_predefined_processes(p, df)

# Your own data
from timeSpace.etl import transform_process_response_sheet
df = transform_process_response_sheet(my_data)
p = add_processes(p, df, category_col="category_type", category_colors={"Physical": "#7BA3B3"})
Google Sheets Integration
timeSpace can pull process and measurement data directly from Google Sheets, which is useful for collaborative data entry via Google Forms.
Using Google Sheets with pip install
If you installed via pip (no git clone), you can fetch sheet data directly:
from timeSpace import extract_google_sheet
from timeSpace.etl import normalize_form_responses, transform_process_response_sheet

df = extract_google_sheet(spreadsheet_id="YOUR_SHEET_ID", data_name="processes")
processed = transform_process_response_sheet(normalize_form_responses(df))
A form response sheet's column headers are the form's question titles
("Minimum Time Scale", and so on), which the transforms do not recognize.
normalize_form_responses() maps them to the internal schema and is tolerant
of the leading/trailing whitespace Google Forms sometimes adds to question
titles. Skipping it raises DataFrame missing required columns: {'Time_min', ...}. For measurement sheets use normalize_measurement_form_responses().
Setting up a processes form
-
Use this link to create your own copy of the processes Google Form
-
After renaming the form / updating the description and questions, go to the Responses tab and click "Link to Sheets"
-
Update the permissions on the newly created sheet to be viewable by anyone with the link
-
Copy the sheet URL
-
Take the identifying string between
/d/and/editin the sheet URL — this is the sheet ID you pass to the CLI or toextract_google_sheet(). For example:https://docs.google.com/spreadsheets/d/USE_THIS_PART/edit?gid=0#gid=0 -
Render it:
timespace --sheet-id YOUR_SHEET_ID --form --output activity.html
--formaccepts the response sheet exactly as the form emits it: no column renaming, and colors are assigned automatically per Lab (the form has no colour question). Add--sheet-gid GIDif responses are not on the first tab; the GID is the number aftergid=in the sheet URL.
Step 3 is not optional. If the response sheet is not shared, the fetch returns Google's sign-in page rather than CSV and parsing fails with an opaque error, not a permissions message.
Editing the Time / Space scale answer options
The scale answer options in the form follow the format
<value>: <example>, for instance1.00E+07: ~3 months.
- The numeric value before the
:(e.g.1.00E+07) is what the ETL parses and plots. Do not change these — the code (etl.py) splits on:and casts the prefix tofloat, so anything non-numeric or out of the expected decade will break downstream processing or silently shift your data.- The example text after the
:(e.g.~3 months) is purely a human-readable anchor. You can edit it freely to make the scale more intuitive for your respondents.
Setting up a measurement form
Follow the same steps as above, using the measurement form template — including making the response sheet viewable by anyone with the link.
Measurement sheets have no --form CLI path yet (#82); use them from Python:
from timeSpace.data_processing import extract_google_sheet
from timeSpace.etl import normalize_measurement_form_responses, transform_measurement_sheet

df = extract_google_sheet(spreadsheet_id="YOUR_SHEET_ID", data_name="measurements")
processed = transform_measurement_sheet(normalize_measurement_form_responses(df))
Setting up predefined processes
- Create your own copy of the predefined processes Google Sheet
- Update permissions so the sheet is viewable by anyone with the link
- Set
PREDEFINED_PROCESSES_URIinconstants.pyto the sheet ID
Using Google Sheets data in code
from timeSpace.data_processing import extract_google_sheet
from timeSpace.etl import normalize_form_responses, transform_process_response_sheet
from timeSpace.plotting_helpers import set_color_palettes_by_lab

# Fetch sheet data (caches locally as CSV)
df = extract_google_sheet(spreadsheet_id="YOUR_SHEET_ID", data_name="processes")
processed = transform_process_response_sheet(normalize_form_responses(df))

# Forms collect no colour; assign one ramp per Lab before plotting
processed = set_color_palettes_by_lab(processed)
Bokeh Output Modes
timeSpace uses Bokeh for rendering. There are three main ways to display or save diagrams:
show(p)— opens the diagram in your default browser with full interactivity (hover, zoom, pan).output_file("diagram.html")+save(p)— writes a self-contained static HTML file.components(p)— returns(script, div)HTML strings for embedding in your own page or iframe. Use this for embedding in Google Sites or other CMS platforms (seedocs/explorer.htmlfor an example). The reference-object explorer has two interaction modes —select(single-select dropdowns) andtoggle(category checkboxes with accumulate visibility); seedocs/EXPLORER.md.
from bokeh.plotting import output_file, save, show
from bokeh.embed import components

# Interactive in browser
show(p)

# Save to file
output_file("stommel.html")
save(p)

# Embed in another page
script, div = components(p)
Data files
Bundled CSV data in data/datasets/:
stommel_boyd2015_volumes.csv— process definitions (time/space ranges, categories) used for the default Stommel diagramtime_space_reference_objects.csv— 102 reference objects across 10 categories for scale context
Development
git clone https://github.com/MDunitz/timeSpace.git
cd timeSpace
pip install -e ".[dev]"
pytest tests/
Public API
All key functions are importable directly from timeSpace:
from timeSpace import (
    # Plotting
    create_space_time_figure,  # Create the base log-log Stommel figure
    add_magnitude_labels,      # Add time/space scale reference lines and labels
    add_processes,             # Add custom process ellipses (from user data)
    add_predefined_processes,  # Add processes from bundled CSV
    add_diffusion_lines,       # Overlay molecular diffusion curves
    add_light_cone,            # Add speed-of-light causality boundary
    add_legend,                # Move legend to right panel with toggle

    # Measurements
    add_measurements,          # Add measurement scatter points with labels
    add_grouped_measurement,   # Add measurements grouped by field (e.g. lab)

    # Calculations
    create_ellipse_data,          # Generate ellipse polygon vertices in log space
    calculate_diffusion_length,   # L = sqrt(6Dt) (3D RMS), returns astropy Quantity
    calculate_sphere_volume,      # V = (4/3)πr³, returns astropy Quantity
    classify_process_geometry,    # Detect degenerate axes → ellipse/line/point

    # Label placement
    resolve_label_overlaps,  # Force-directed label collision resolution
    count_overlaps,          # Count remaining label overlaps after placement

    # ETL
    normalize_form_responses,          # Map form question titles -> ETL schema
    transform_process_response_sheet,  # Clean Google Form responses
    transform_predefined_processes,    # Prepare bundled CSV for plotting
    transform_measurement_sheet,       # Clean measurement form responses

    # Data access
    extract_google_sheet,  # Fetch data from Google Sheets (with local CSV cache)
)
2 maintainers


Metadata
2 maintainers
Release files for timeSpace 0.3.1
For a detailed explanation of source distributions (sdists) and built distributions (wheels), please see the package formats documentation.
Source distribution (sdist)
| File | Size | Uploaded | Provenance | Actions |
|---|---|---|---|---|
| timespace-0.3.1.tar.gz | 113.3 kB | Without provenance | Details for timespace-0.3.1.tar.gz |
Built distribution (wheel)
| File | Interpreter | ABI | Platform | Actions Reset |
|---|---|---|---|---|
| timespace-0.3.1-py3-none-any.whl | Python 3 | none | any | Details for timespace-0.3.1-py3-none-any.whl |
Total release size: 205.4 kB
Release files / timespace-0.3.1.tar.gz
| Download URL | timespace-0.3.1.tar.gz |
|---|---|
| Size | 113.3 kB |
| Tags | Source |
|
SHA-256 checksum How to use checksums |
644044ababfcb0d6171b3e6ea8945106ddba0753e89230fd37314647342f918f
|
|
BLAKE2b-256 checksum How to use checksums |
fca8562489cf5334ba19d5eb5faeddf6f4ad099c98489e86b00b114343fceef9
|
| Upload date | |
|
Uploaded using Trusted Publishing? What is trusted publishing? |
No |
| Uploaded via |
twine/6.2.0 CPython/3.11.12
|
Release files / timespace-0.3.1-py3-none-any.whl
| Download URL | timespace-0.3.1-py3-none-any.whl |
|---|---|
| Size | 92.1 kB |
| Tags | Python 3 |
|
SHA-256 checksum How to use checksums |
43523728eb8018df700fb23c3a974b13a30944a44a4ce8e36b6bdb9608586fbd
|
|
BLAKE2b-256 checksum How to use checksums |
1d331f17c4f0ce8bf9beef6ee7ae1209c154e62511d4b61ac10e56cfee62b6cd
|
| Upload date | |
|
Uploaded using Trusted Publishing? What is trusted publishing? |
No |
| Uploaded via |
twine/6.2.0 CPython/3.11.12
|
Security for timeSpace 0.3.1
Provenance
Provenance describes where a file came from. On PyPI, provenance is shared via attestations, which provide a verifiable record of the build or publishing details. View details, limitations and caveats.
No provenance found
None of the files in this release were uploaded with provenance metadata.
A note on package security
PyPI is a repository for distributing packages, not a service for auditing them. While third-party security researchers and our staff do their best to detect and remove malicious packages, PyPI cannot guarantee the quality, security or suitability of any given package.
To learn more about protecting yourself from malicious actors, visit our package security documentation.














