
Timeline visualisation for CSV data and Prometheus test files
Verified details
These details have been verified by PyPIProject links
GitHub Statistics
Maintainers

Project description
timelineviz





Timeline visualisation for CSV data and Prometheus test files.
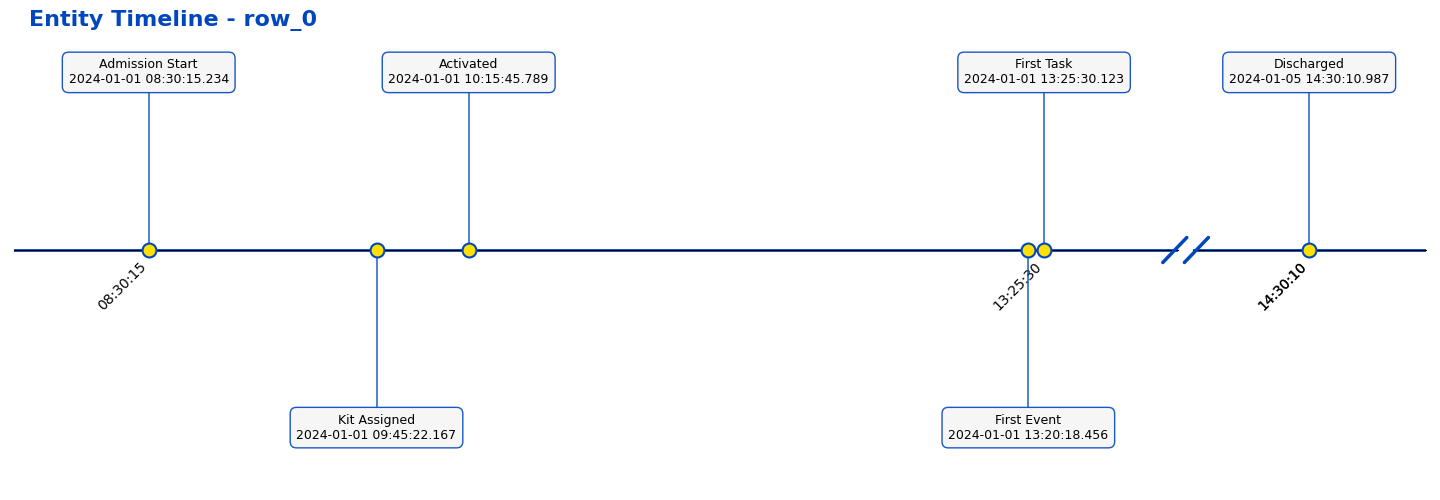
Features
- Plot event timelines from CSV / DataFrame timestamp data
- Long-format logs — one timestamp column across many rows, with optional filters on level / event type (incident-style timelines)
- Handle time gaps with broken timeline display
- Auto-detect timestamp columns based on naming patterns
- Visualise Prometheus
promtoolunit-test files — series values, eval checkpoints, and alert checks on a relative time axis - Customisable colour schemes
- CLI and Python API
- Optional next step: use saved PNGs (plus your CSV or milestone list) as input to multimodal / image-generation LLMs to produce executive-style infographics — see below
Installation
pip install timelineviz

# or with uv
uv add timelineviz
Python 3.11 or newer is required.
For development:
git clone https://github.com/garrywilliams/timeline_viz.git
cd timeline_viz
make install
make precommit-install
Run make or make help for tests, linting, builds, and other tasks. CI, release, and maintainer setup details live in DEVELOPING.md.
Quick Start
CSV / DataFrame Timelines
# Auto-detect timestamp columns
timelineviz data.csv --detect-timestamps --output-dir timelines

# Specify columns explicitly
timelineviz data.csv --timestamp-columns created_at updated_at completed_at

# Add more visually staggered label bubbles
timelineviz data.csv --timestamp-columns created_at updated_at completed_at --varying-height
from timelineviz import plot_timeline, plot_multiple_timelines

import pandas as pd
df = pd.read_csv("data.csv")

# Single entity
plot_timeline(df.iloc[0],
              timestamp_columns=['created_at', 'updated_at', 'completed_at'],
              entity_id="12345")

# Multiple entities
plot_multiple_timelines("data.csv",
                        timestamp_columns=['created_at', 'updated_at'],
                        id_column='entity_id',
                        output_dir="timeline_images")
Event log (long format)
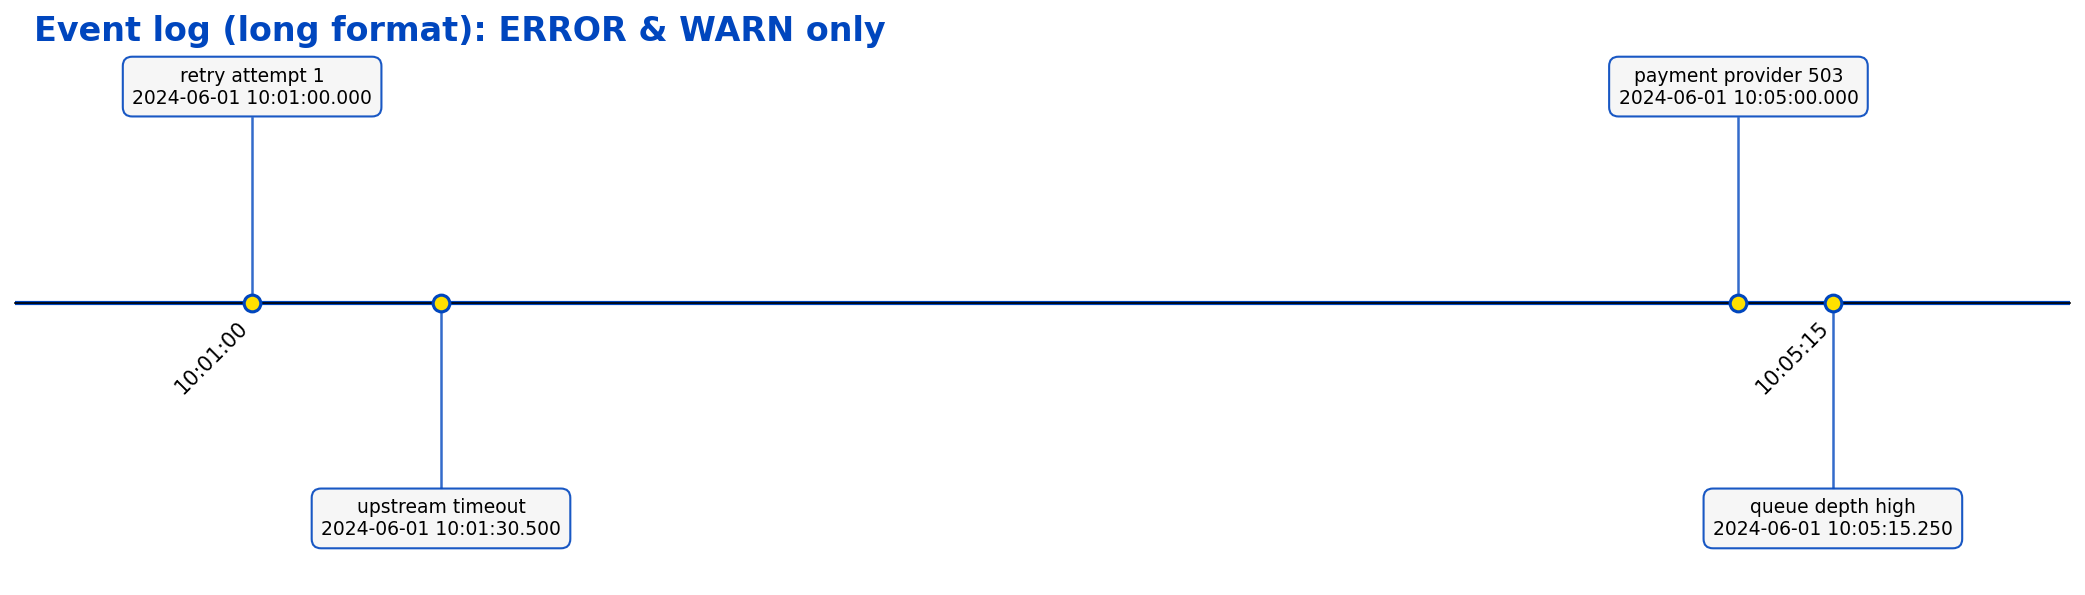
Use this when each row is one event and times live in a single column (typical logs). Optionally keep or drop rows using another column (for example level or event_type) so you can focus on an incident and ignore noise.
timelineviz examples/incident_log.csv --event-log --log-time-column ts \
  --log-label-column message --log-filter-column level \
  --log-include ERROR WARN --output-dir timelines --no-show
from timelineviz import plot_event_log_timeline

plot_event_log_timeline(
    "incident.csv",
    timestamp_column="ts",
    label_column="message",
    filter_column="level",
    include_values=["ERROR", "WARN"],
    varying_height=True,
    output_file="incident_timeline.png",
    show_plot=False,
)
A small sample file is in examples/incident_log.csv.
The diagram below is from that sample, using the CLI flags above (ERROR and WARN rows only, message as the label):
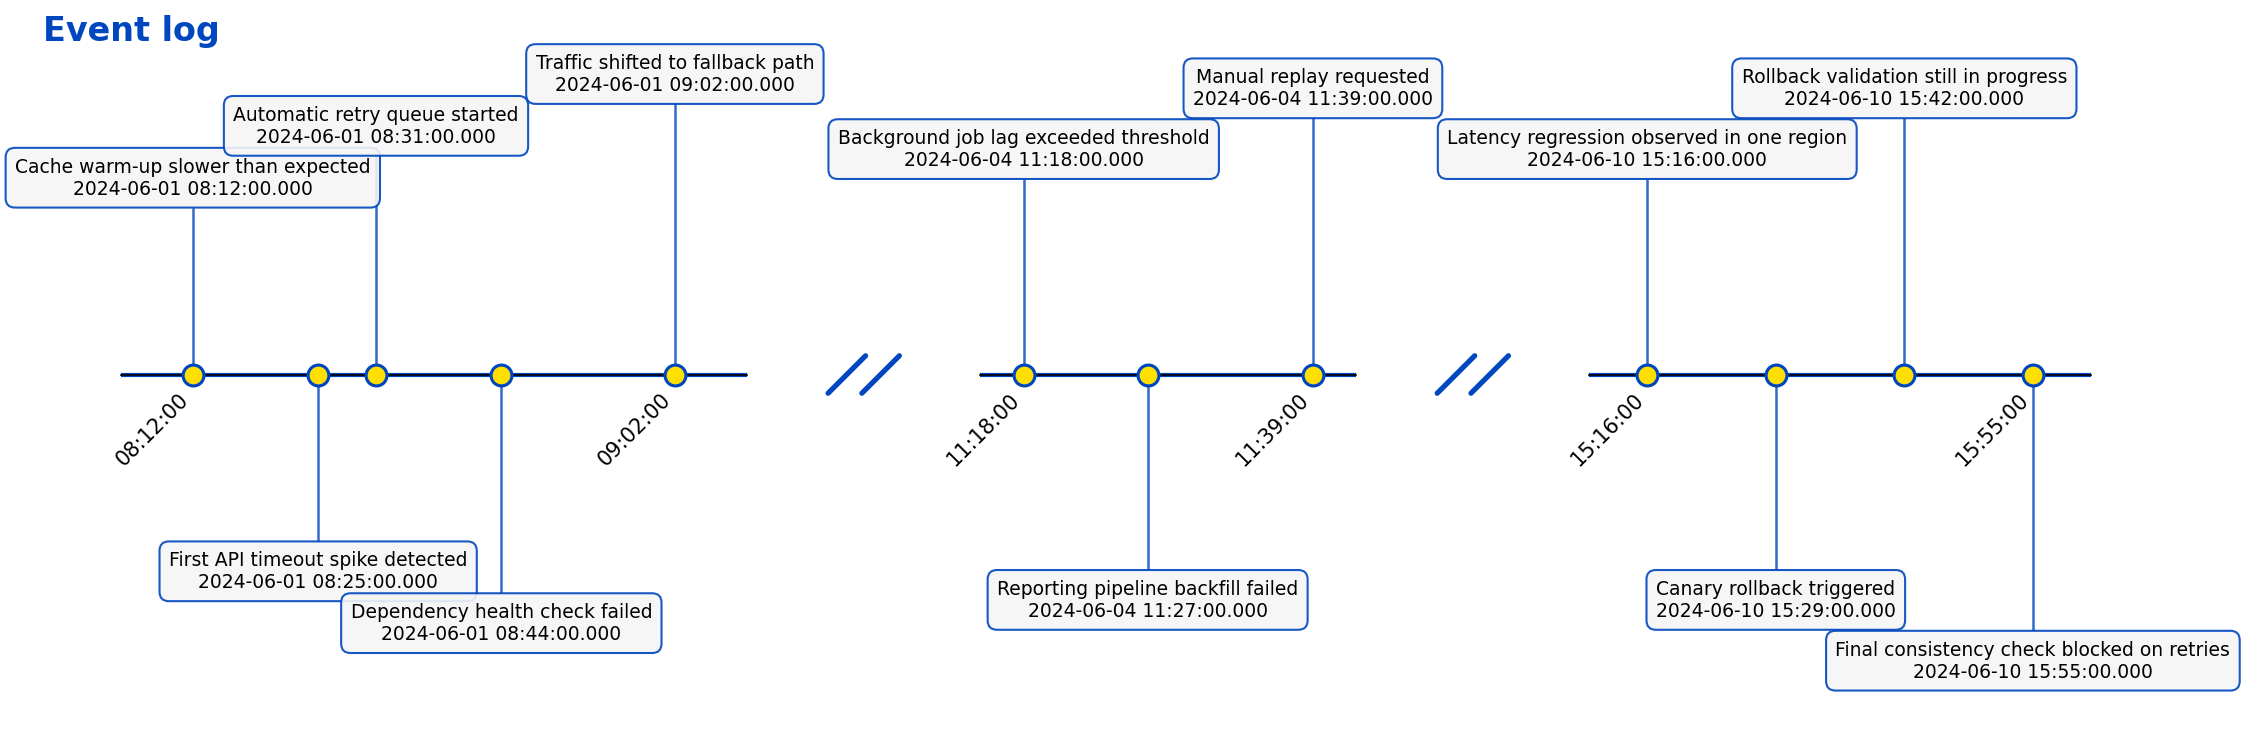
For a denser example with more incident points, varying-height label bubbles, and multiple time breaks, see
examples/review_event_log_breaks.csv
rendered with --varying-height --threshold-days 2:
Prometheus Test Timelines
Visualise promtool unit-test YAML files — see series values change over time, where evaluations happen, and when alerts fire.
timelineviz examples/promtest_label_minimal.yml --promtest
timelineviz examples/promtest_label_minimal.yml --promtest --output-dir images --no-show
Replace the path with your own promtool unit-test YAML when needed. Checked-in examples live under examples/.
from timelineviz import parse_promtest_file, plot_promtest

groups = parse_promtest_file("examples/promtest_label_minimal.yml")
plot_promtest(groups, output_file="promtest_timeline.png")
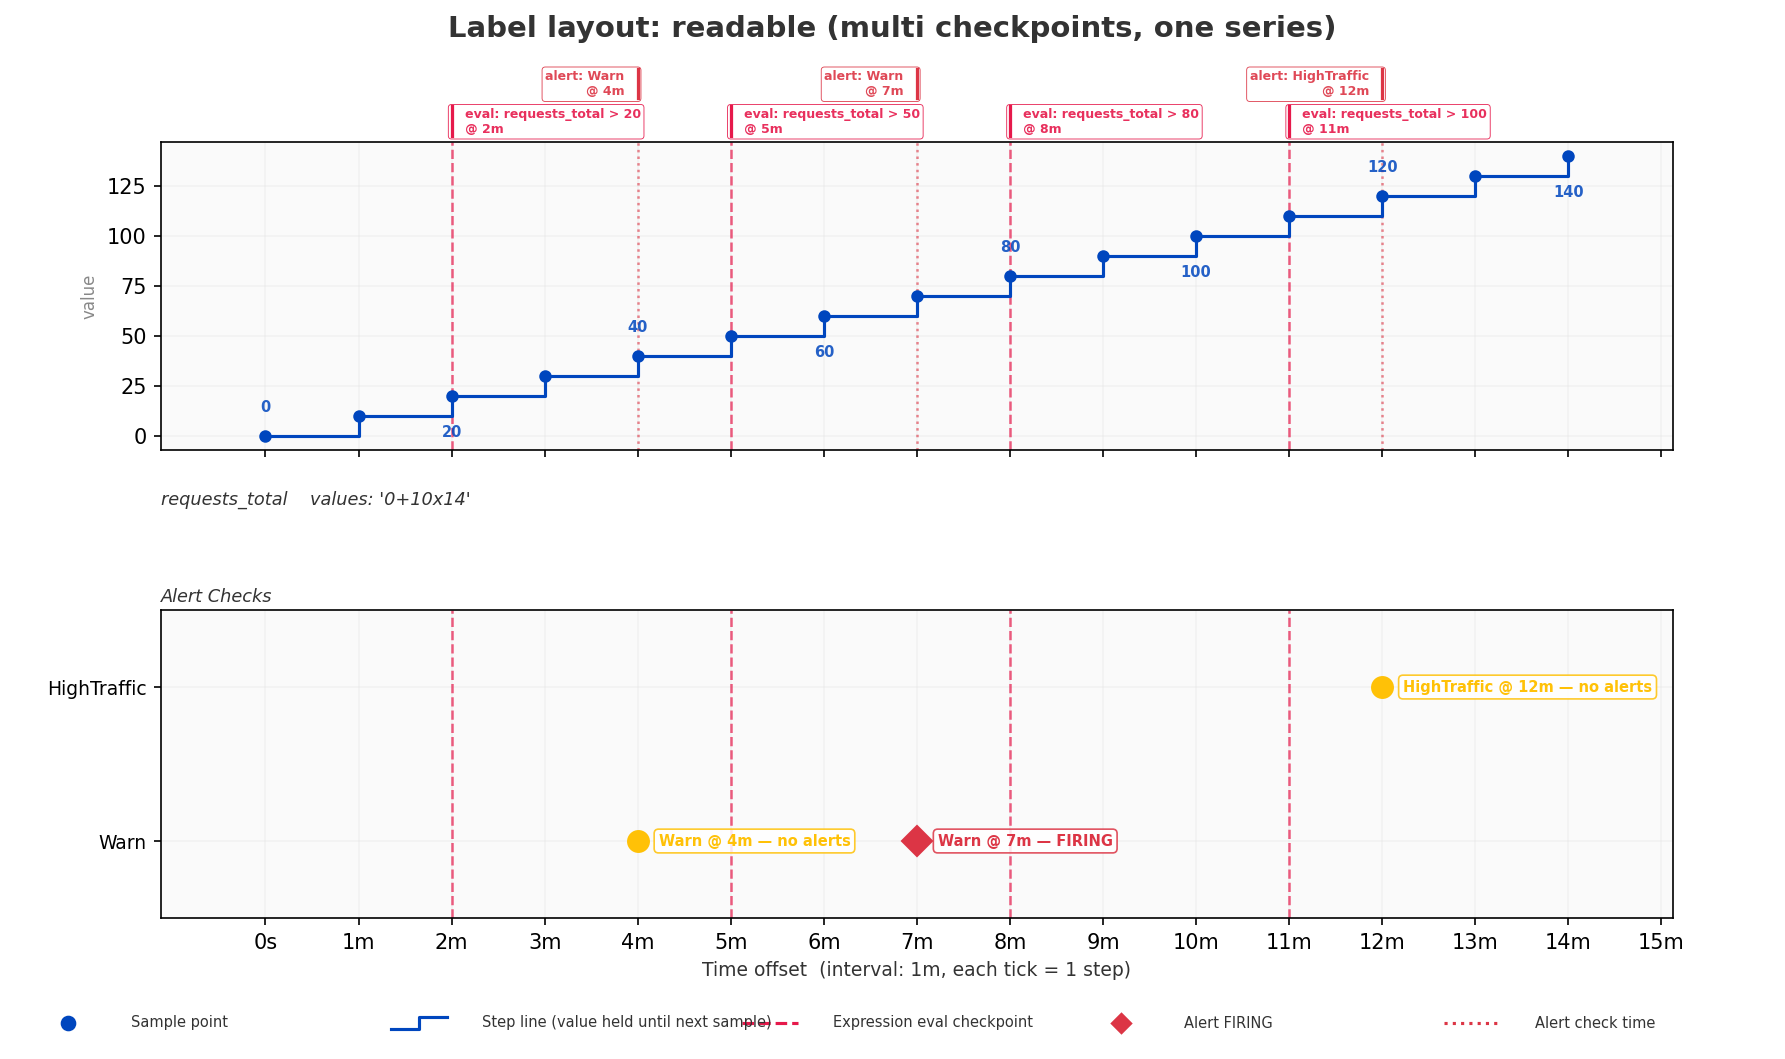
Charts are self-documenting — each subplot shows the metric name and raw notation, value labels appear at transition points, eval/alert vertical lines are labelled, and a legend strip at the bottom explains all marker types.
Full guide: PROMTEST.md — notation reference, worked examples, and all parameters.
How It Works
CSV Timelines
Wide format (default): each entity is a row; timestamps live in separate columns (for example created_at, updated_at). Those columns become labelled points on one timeline per entity.
Long format (plot_event_log_timeline / --event-log): many rows share one timestamp column; each row is one point. Filters apply before plotting.
In both cases, when time gaps exceed a threshold, the timeline is broken into segments with slash markers indicating the breaks.
Promtest Timelines
Prometheus test files define metric series as values over discrete time steps (e.g. one value per minute). The library:
- Parses the YAML and expands the compact notation (
1+2x5→1, 3, 5, 7, 9, 11) - Plots each
input_seriesas a step chart on its own subplot - Draws vertical markers at
eval_timecheckpoints - Shows alert check points with firing/pending status
- Labels the x-axis with relative time offsets (
0s,1m,2m, …)
Optional break_gap_minutes / CLI --promtest-break-gap: when gaps between anchors (0, series end, each eval/alert time) exceed that many minutes, the chart splits into multiple horizontal panels with slash markers—same idea as CSV threshold_days breaks. See PROMTEST.md and examples/promtest_time_breaks.yml.
From chart output to executive infographics
timelineviz is built for faithful, technical timelines (PNG from the CLI or output_file= in Python). For stakeholder decks, board summaries, or comms, you can treat that output as source material for a second step: a multimodal or image-focused LLM (any tool that accepts an image plus a long text brief—e.g. Nano Banana or similar) together with:
- The exported PNG (or a screenshot of the figure)
- Your structured facts: ordered milestones, dates, short business descriptions, KPIs, risks, and the story you want told
- A detailed creative prompt (audience, tone, layout, colour rules, and what not to invent)
The model can redesign the information as an infographic while you verify dates, labels, and numbers against your data. The sample below is an illustrative executive layout (sample healthcare journey) produced from that kind of workflow—not something timelineviz renders by itself.
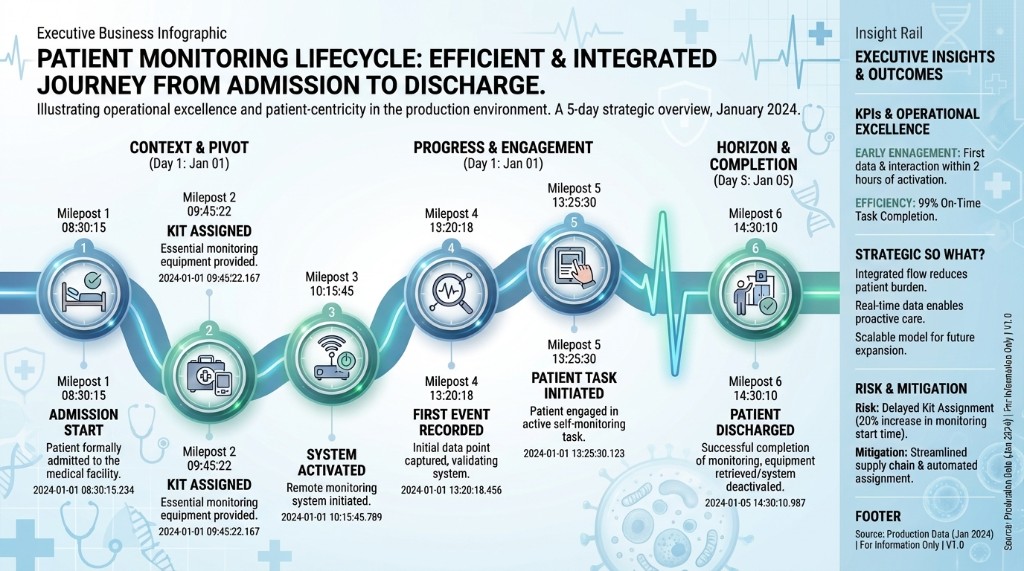
Example only: narrative layout, icons, and insight rail were generated for communication design; always validate facts against your source CSV and plots.
API Reference
CSV Mode
| Parameter | Description |
|---|---|
timestamp_columns |
Columns containing timestamp data to visualise |
id_column |
Column that uniquely identifies each entity |
threshold_days |
Time gap (in days) that triggers a timeline break |
varying_height |
Stagger labels above/below the line at varying heights for a more visually layered layout |
entity_name |
Type name for titles (e.g. "Patient", "Order") |
label_mappings |
Custom display names for timestamp columns |
color_scheme |
Dictionary of colour overrides |
Promtest Mode
| Parameter | Description |
|---|---|
figsize |
Figure dimensions (width, height) in inches |
title |
Custom figure title |
color_scheme |
Override colours (see PROMTEST.md) |
output_file |
Save to PNG |
dpi |
Resolution (default 150) |
License
Project details
Verified details
These details have been verified by PyPIProject links
GitHub Statistics
Maintainers
Release history Release notifications | RSS feed


Download files
Download the file for your platform. If you're not sure which to choose, learn more about installing packages.
Source Distribution
Built Distribution
Filter files by name, interpreter, ABI, and platform.
If you're not sure about the file name format, learn more about wheel file names.
Copy a direct link to the current filters
File details
Details for the file timelineviz-0.4.0.tar.gz.
File metadata
- Download URL: timelineviz-0.4.0.tar.gz
- Upload date:
- Size: 1.2 MB
- Tags: Source
- Uploaded using Trusted Publishing? Yes
- Uploaded via: twine/6.1.0 CPython/3.13.7
File hashes
| Algorithm | Hash digest | |
|---|---|---|
| SHA256 |
69b674b864a0722fc5f7a21f70311bea9d30ca4901ca043c4f14c47ca3442434
|
|
| MD5 |
7c9a763b8b8cf3939b2e5f3dc0a53d88
|
|
| BLAKE2b-256 |
1194a9410c4824d4587d69fdde4e1aba33570ecf2b50df19058e1ed3e6d381de
|
Provenance
The following attestation bundles were made for timelineviz-0.4.0.tar.gz:
Publisher:
release.yml on garrywilliams/timeline_viz
-
Statement:
-
Statement type:
https://in-toto.io/Statement/v1 -
Predicate type:
https://docs.pypi.org/attestations/publish/v1 -
Subject name:
timelineviz-0.4.0.tar.gz -
Subject digest:
69b674b864a0722fc5f7a21f70311bea9d30ca4901ca043c4f14c47ca3442434 - Sigstore transparency entry: 1227654172
- Sigstore integration time:
-
Permalink:
garrywilliams/timeline_viz@bd2c315551e7aace6b4619bdf8c0376b67cadb98 -
Branch / Tag:
refs/tags/v0.4.0 - Owner: https://github.com/garrywilliams
-
Access:
public
-
Token Issuer:
https://token.actions.githubusercontent.com -
Runner Environment:
github-hosted -
Publication workflow:
release.yml@bd2c315551e7aace6b4619bdf8c0376b67cadb98 -
Trigger Event:
release
-
Statement type:
File details
Details for the file timelineviz-0.4.0-py3-none-any.whl.
File metadata
- Download URL: timelineviz-0.4.0-py3-none-any.whl
- Upload date:
- Size: 50.1 kB
- Tags: Python 3
- Uploaded using Trusted Publishing? Yes
- Uploaded via: twine/6.1.0 CPython/3.13.7
File hashes
| Algorithm | Hash digest | |
|---|---|---|
| SHA256 |
ee94bb9cb2b928b48323b90cd966b425a884f506ebd8a86bdac71da93d55e672
|
|
| MD5 |
861ae1dce2c139d1bf4da4244ba18cfd
|
|
| BLAKE2b-256 |
f48b8e30ba8c2aa236c77411562972c54629deb0ee35f5b3b9f9fb0ae178700d
|
Provenance
The following attestation bundles were made for timelineviz-0.4.0-py3-none-any.whl:
Publisher:
release.yml on garrywilliams/timeline_viz
-
Statement:
-
Statement type:
https://in-toto.io/Statement/v1 -
Predicate type:
https://docs.pypi.org/attestations/publish/v1 -
Subject name:
timelineviz-0.4.0-py3-none-any.whl -
Subject digest:
ee94bb9cb2b928b48323b90cd966b425a884f506ebd8a86bdac71da93d55e672 - Sigstore transparency entry: 1227654213
- Sigstore integration time:
-
Permalink:
garrywilliams/timeline_viz@bd2c315551e7aace6b4619bdf8c0376b67cadb98 -
Branch / Tag:
refs/tags/v0.4.0 - Owner: https://github.com/garrywilliams
-
Access:
public
-
Token Issuer:
https://token.actions.githubusercontent.com -
Runner Environment:
github-hosted -
Publication workflow:
release.yml@bd2c315551e7aace6b4619bdf8c0376b67cadb98 -
Trigger Event:
release
-
Statement type:






