General-purpose time series SVG plotting library for JSONB data

Project description
timeseries-sparklines


Need backend-rendered sparklines, trend lines, mini charts, bar charts, or slicable time-series charts?
timeseries-sparklinesturns time-series data into deterministic SVG markup for SSR applications, dashboards, APIs, and Agentic workflows - no chart initialization, no canvas lifecycle management, and no frontend chart runtime required.
pip install timeseries-sparklines
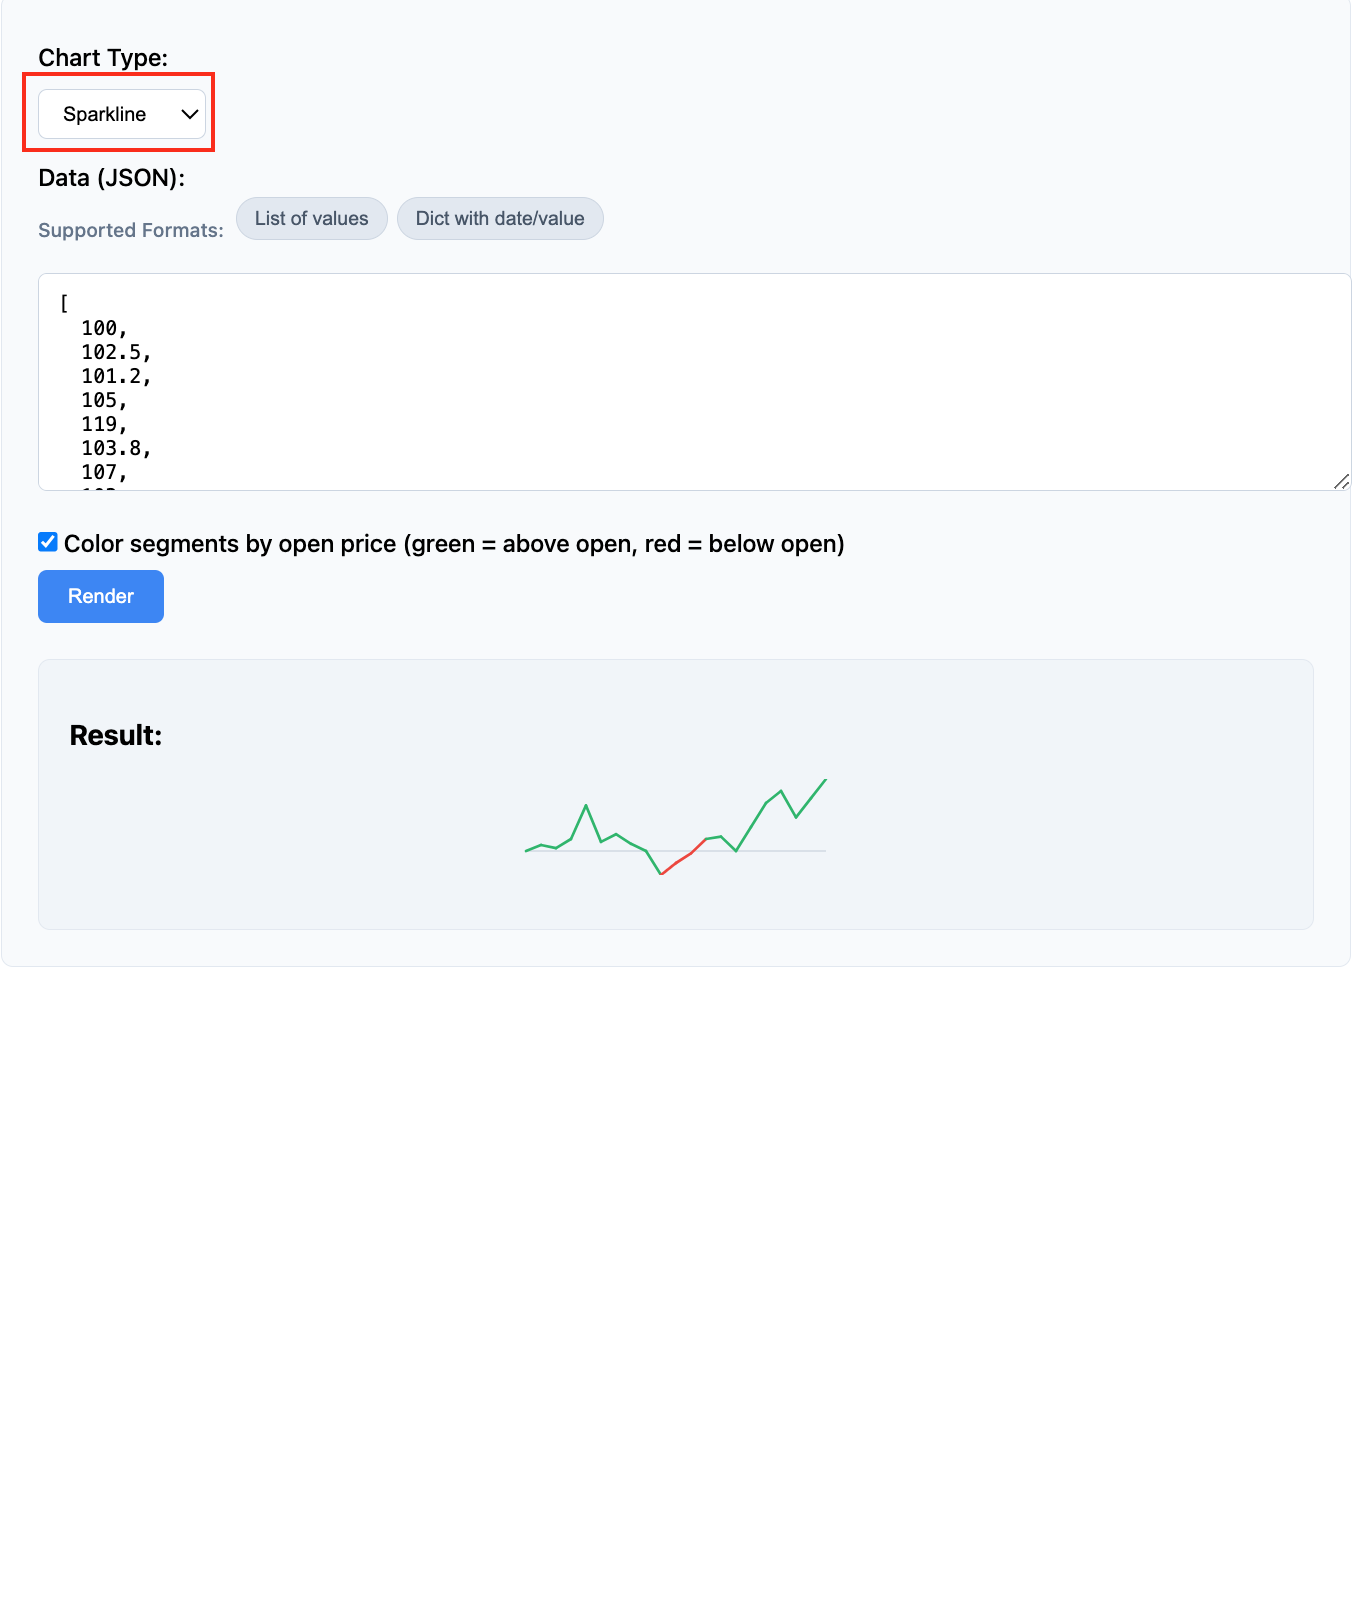
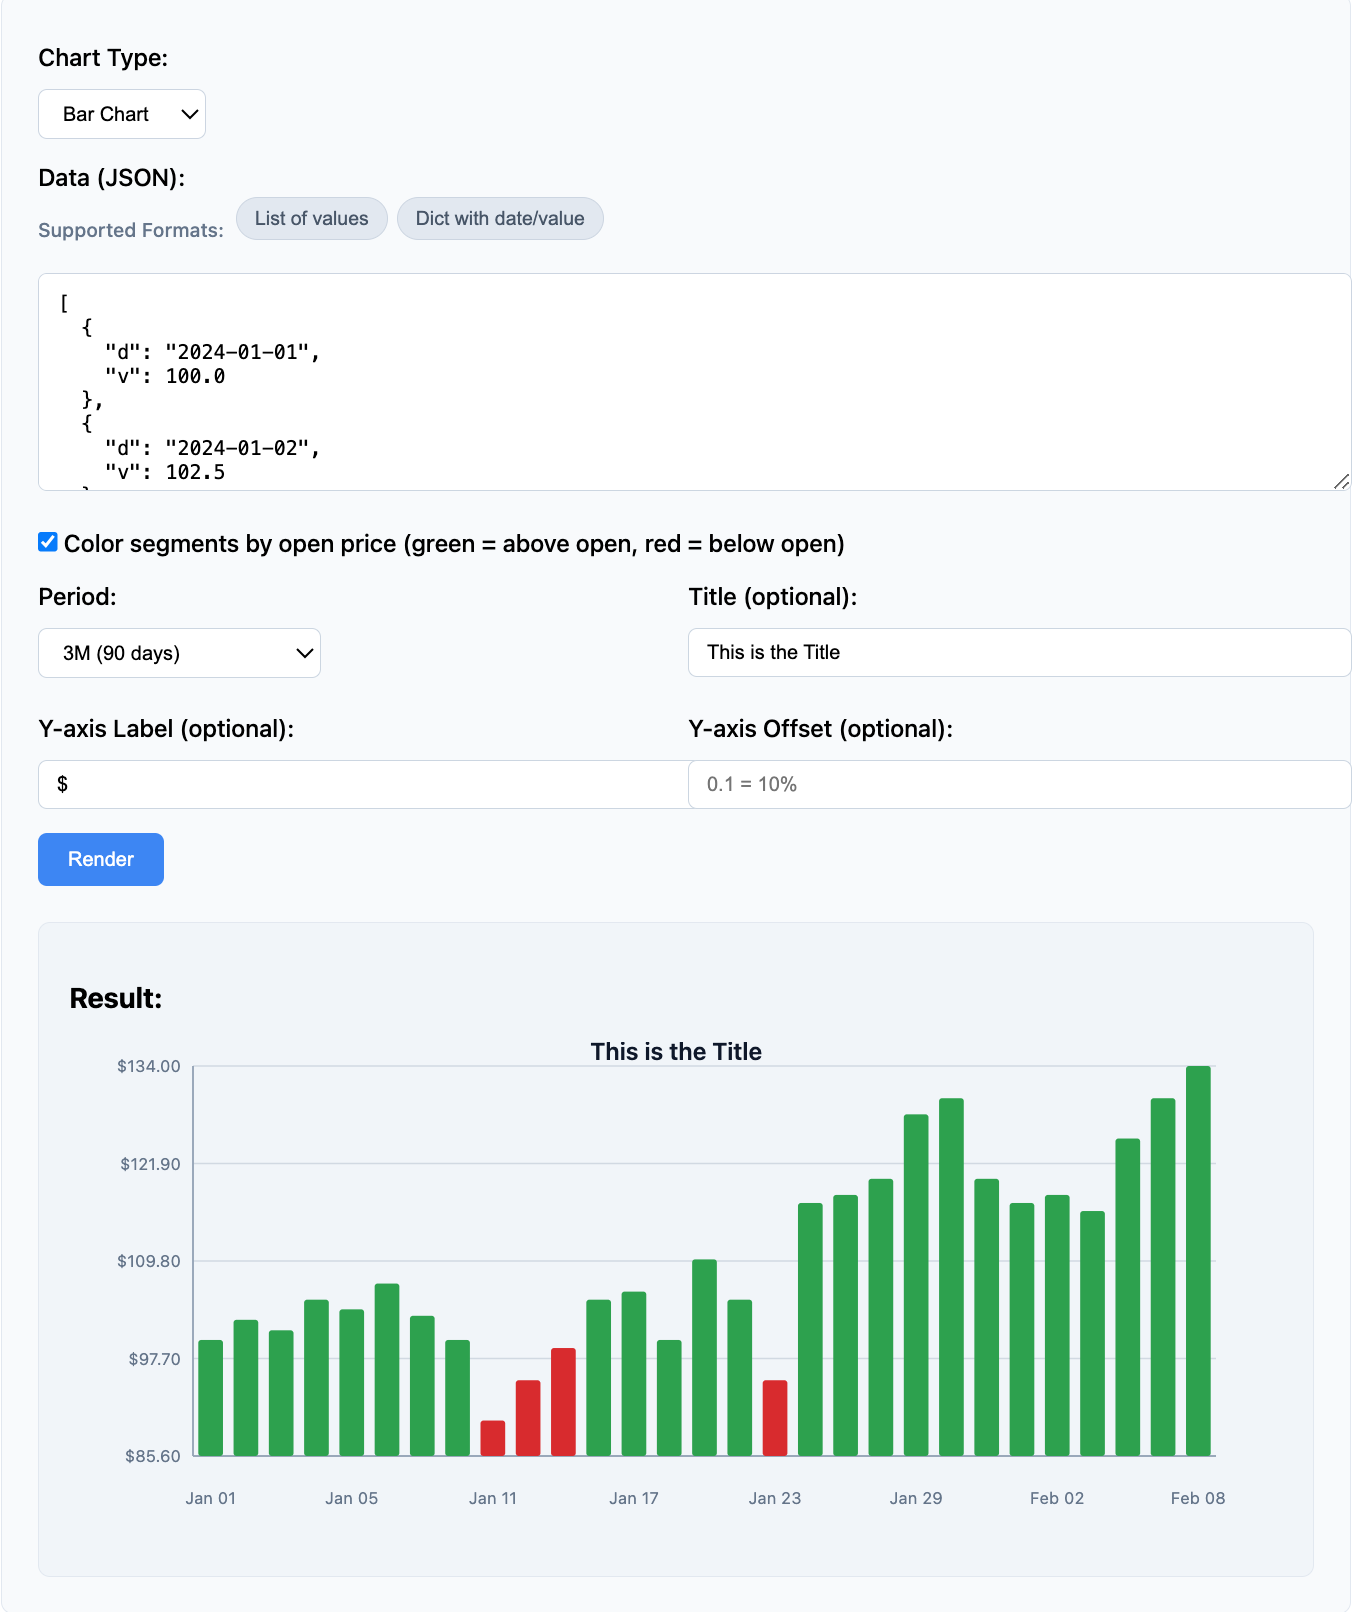
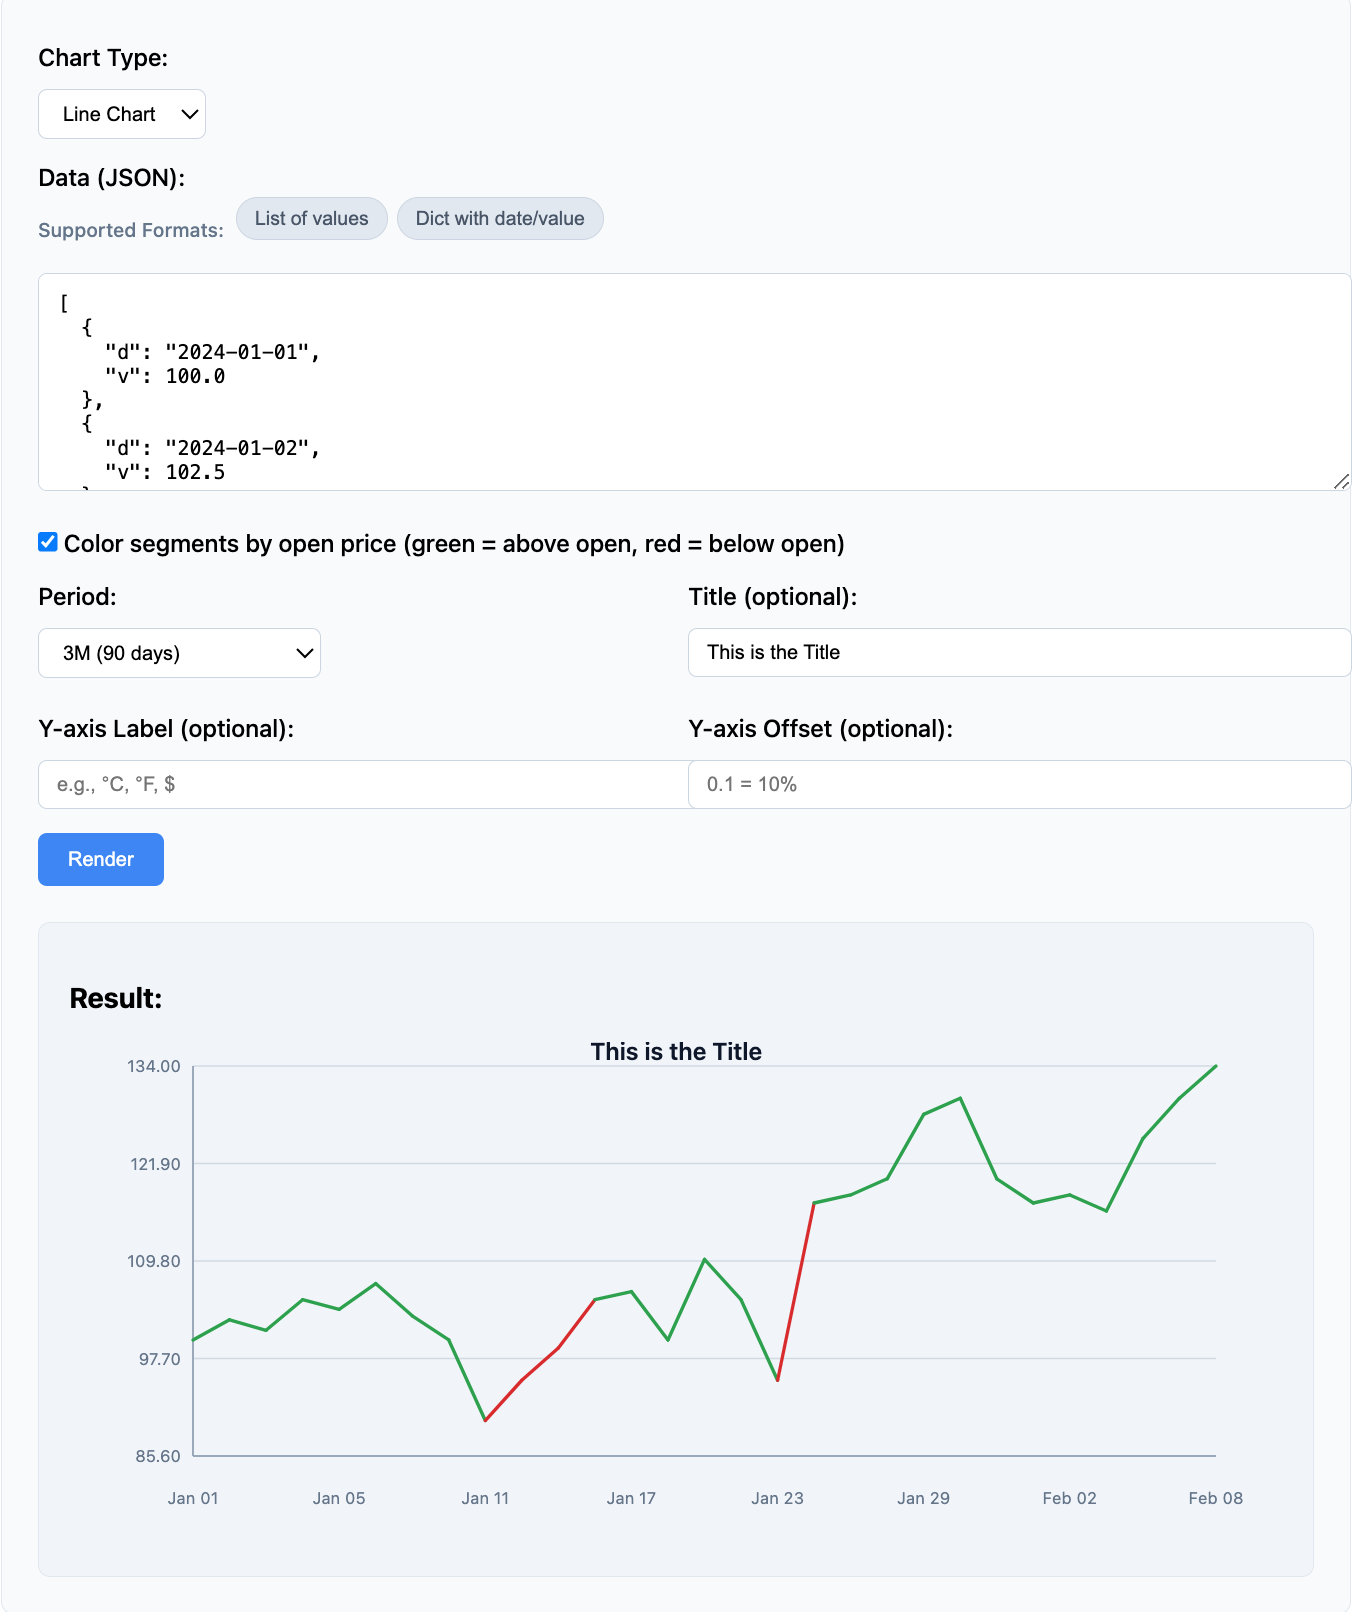
Includes an Interactive Test UI for testing data formats, period slicing, SVG output, and chart parameters.
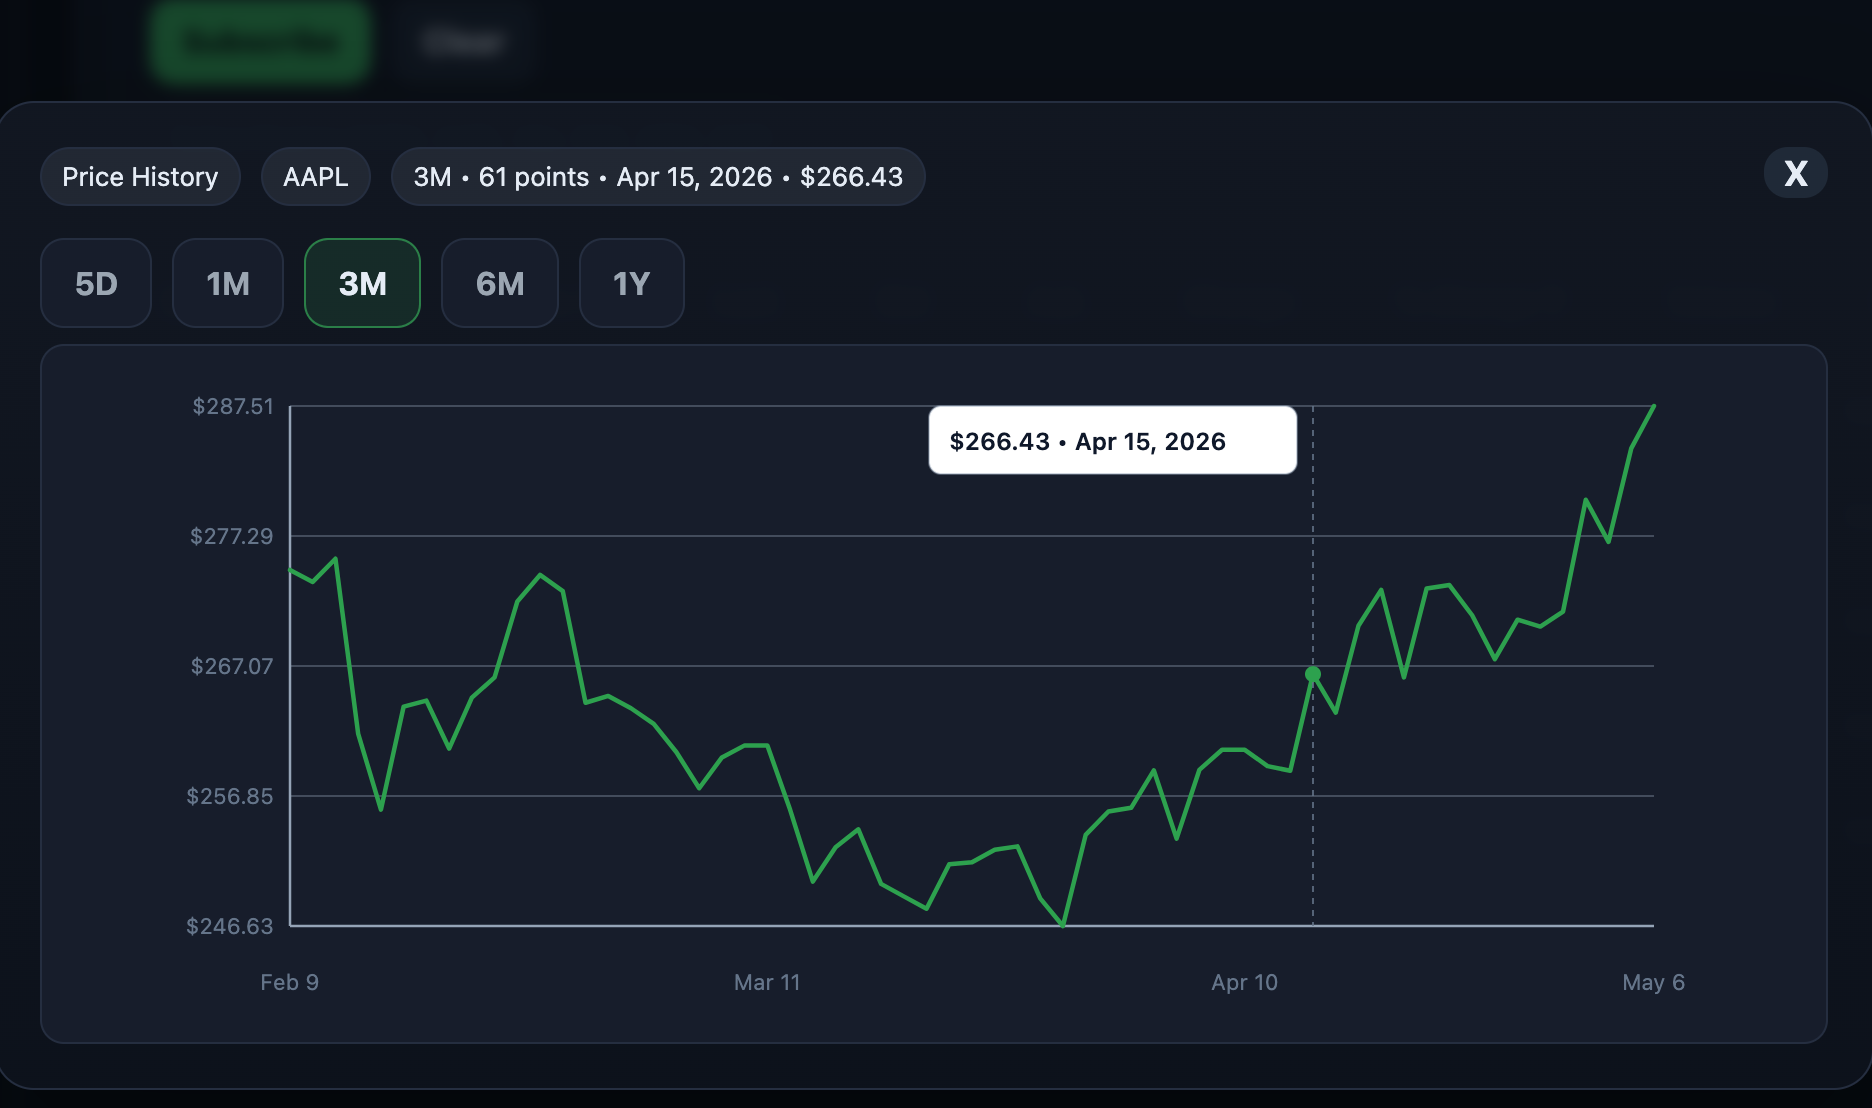
Rendered Examples
Example: an Agentic workflow returning a server-rendered SVG chart inside an LLM response.
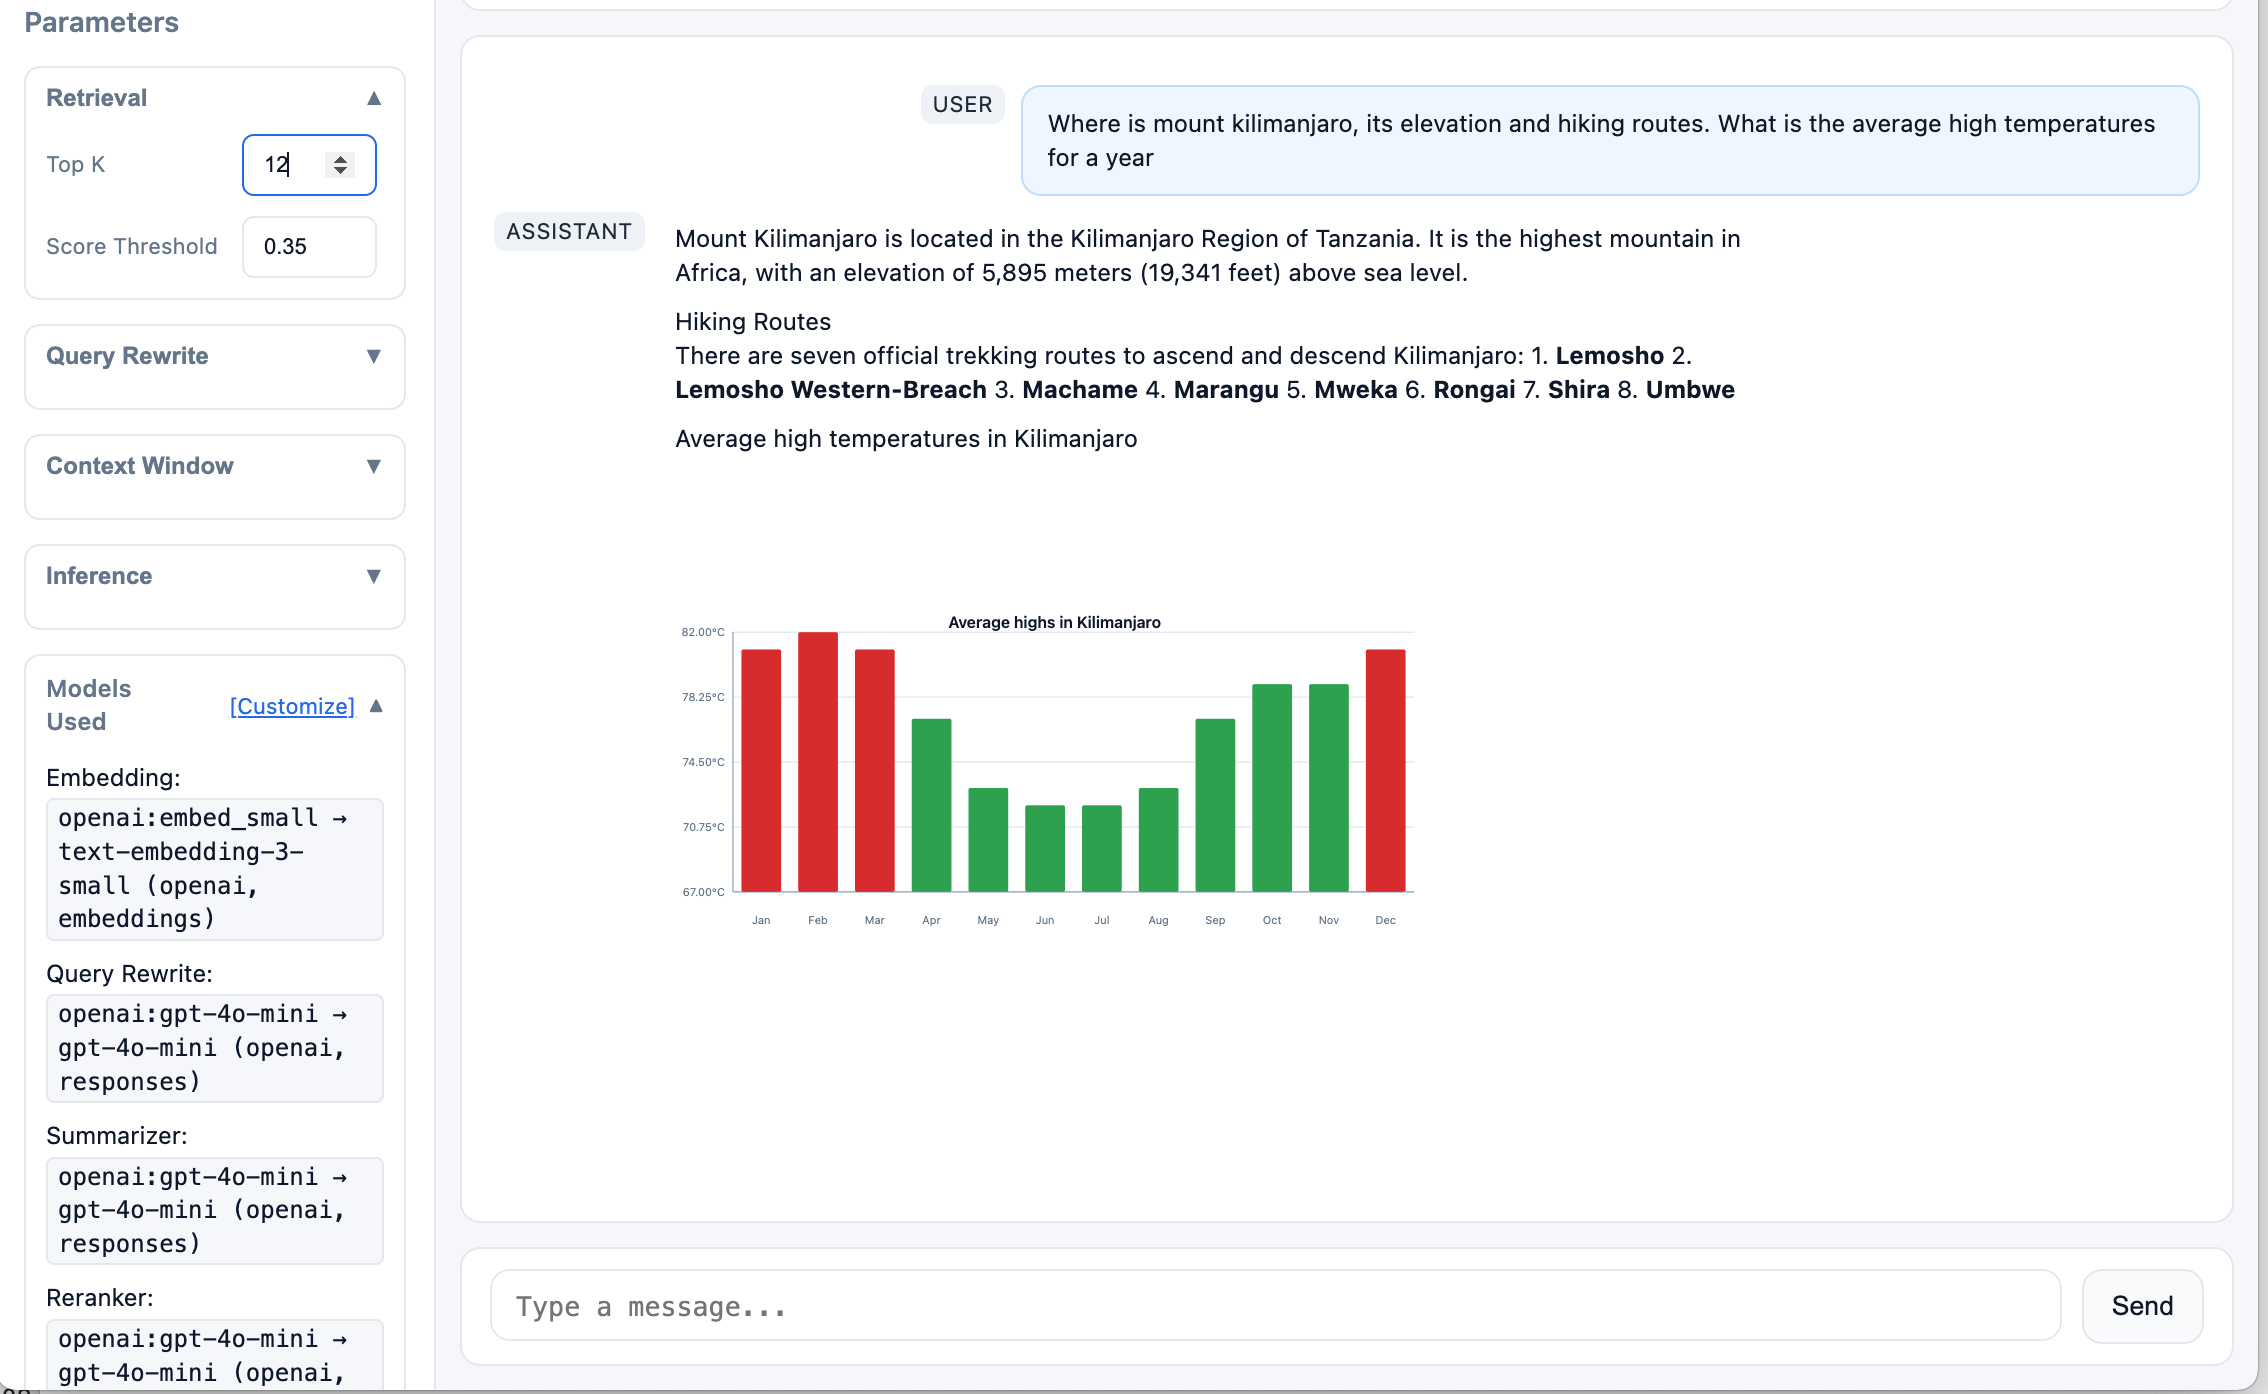
Sparklines, bar charts, and slicable SVG time-series charts rendered server-side.
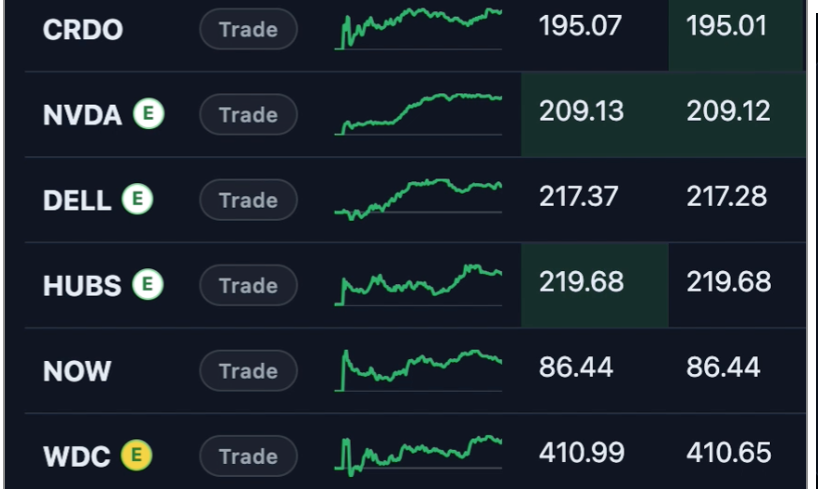
Trading Dashboard Preview
Example: backend-rendered sparklines and slicable SVG charts inside a trading dashboard.
Use Cases
Use timeseries-sparklines when your backend, API, or Agentic workflow needs to turn time-series data into lightweight SVG charts without adding frontend charting dependencies.
- Agentic workflows: Generate SVG charts from tool results and embed them in chat, dashboards, reports, or generated HTML
- SSR and backend-rendered apps: Return ready-to-display SVG from Python backends, or expose it through an API for other stacks
- Operational dashboards: Render compact sparklines, trend lines, and mini charts for periodically refreshed data
- Chart and BI APIs: Accept slice parameters like
5D,1M,6M, or1Yand return SVG for downstream consumers - Reports, notebooks, and internal tools: Embed small trend visuals directly where HTML or SVG is supported
System Architecture
The library acts as a server-side rendering harness that transforms time-series data into SVG visualizations.
Architecture overview:
System architecture showing data flow from sources through the rendering harness to downstream consumers.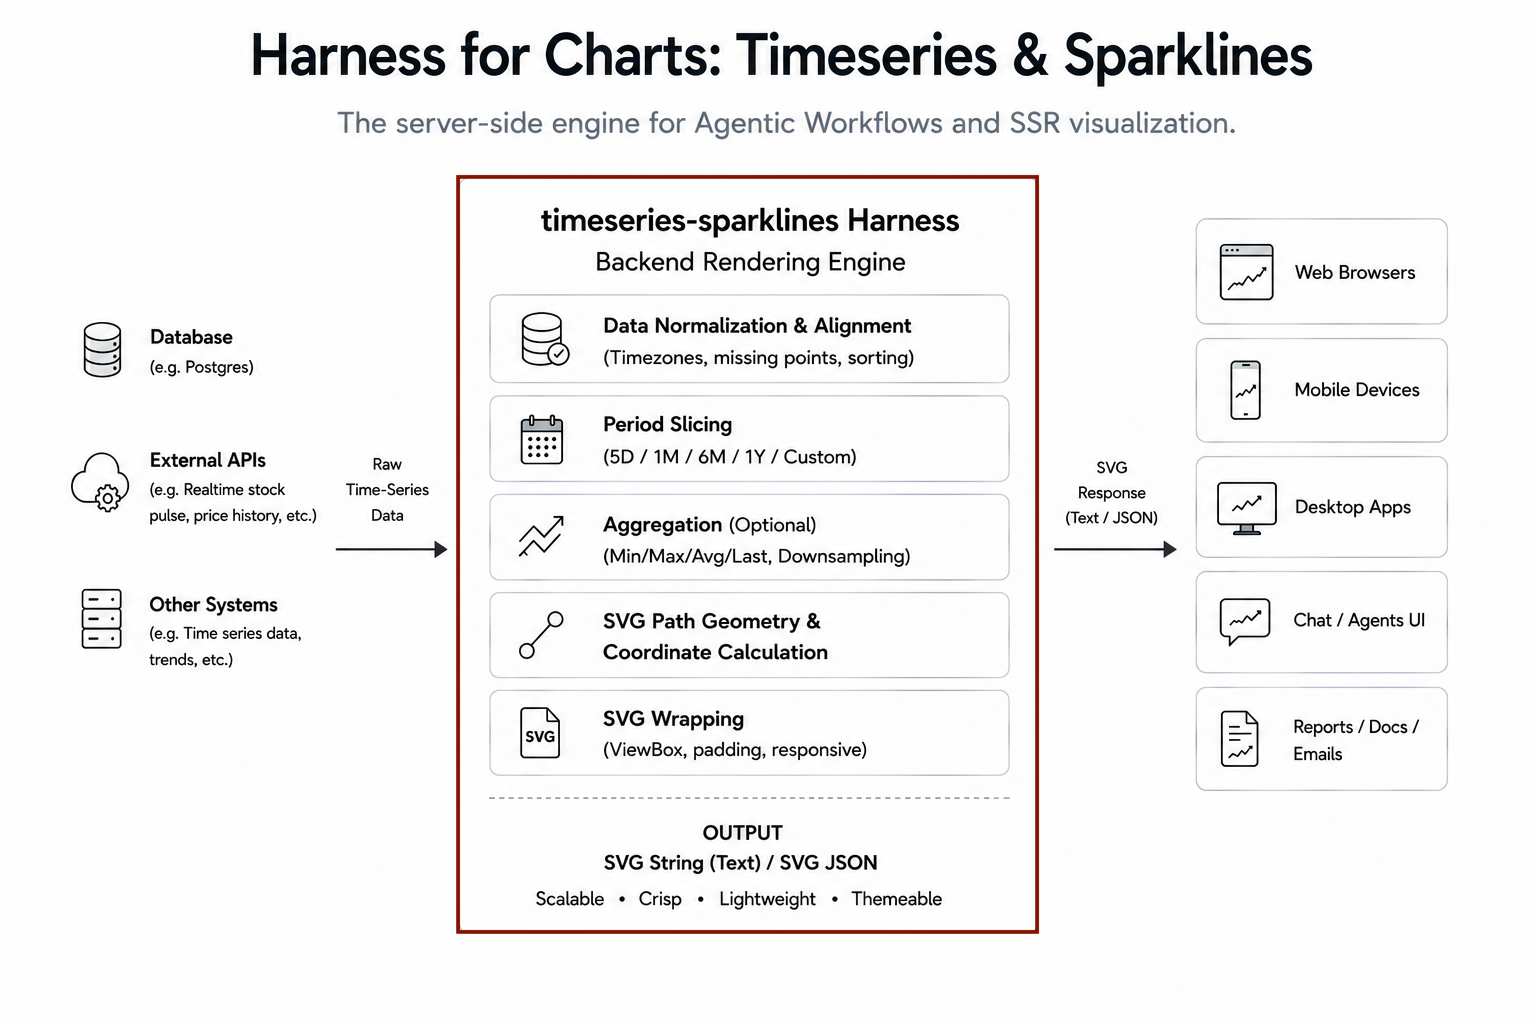
The harness handles normalization, slicing, coordinate calculation, and SVG generation - returning production-ready SVG markup.
Harness for Charts: Timeseries & Sparklines
timeseries-sparklines can act as a backend rendering harness inside Agentic workflows, APIs, dashboards, and SSR applications.
A typical workflow:
- Retrieve time-series data from a database, API, cache, or tool
- Render a sparkline or chart with a selected period (
5D,1M,6M,1Y, etc.) - Return SVG for embedding into dashboards, reports, notebooks, or chat interfaces
Because the output is lightweight SVG text, it can be cached, streamed, embedded, and passed through LLM workflows when needed.
What you get
- Python rendering library for programmatic sparkline and chart generation
- Flexible data input - Accepts 6+ Python/JSON time-series formats automatically
- Sparkline rendering - Compact sparklines, trend lines, and mini charts for inline display
- Bar charts - Vertical bar charts for time-series data with configurable bar width and colors
- Time-series charts - SVG charts with axis labels, grid lines, and period-based formatting
- Period-based slicing - Auto-filters data by time windows (5D, 1W, 2W, 1M, 3M, 6M, 1Y, or custom timedelta)
- Segment coloring - Color segments by open price for trend visualization
- REST API server - FastAPI-powered service for remote rendering
- Zero external dependencies - Pure Python, no heavy plotting libraries required
- Test UI - Interactive test page for rendering behavior and parameter tuning
Install
pip install timeseries-sparklines
Or install with REST API server:
pip install "timeseries-sparklines[api]"
Links:
- PyPI: https://pypi.org/project/timeseries-sparklines/
- GitHub: https://github.com/vrraj/timeseries-sparklines
- API Documentation: https://vrraj.github.io/timeseries-sparklines/
Quick Start
Option A: Use directly in Python
For Python applications (most common)
pip install timeseries-sparklines
Sparkline Example
from timeseries_svg import SparklineRenderer

# Input data can be in various formats
data = [
    {"d": "2024-01-01", "v": 100.0},
    {"d": "2024-01-02", "v": 102.5},
    {"d": "2024-01-03", "v": 101.2},
    {"d": "2024-01-04", "v": 105.0},
]

renderer = SparklineRenderer(width=96, height=32)
svg = renderer.render(data)
print(svg)  # Returns SVG string
Time Series Chart Example
from timeseries_svg import TimeSeriesChartRenderer

# Historical price data
data = [
    {"d": "2024-01-01", "v": 150.0},
    {"d": "2024-01-02", "v": 152.5},
    {"d": "2024-01-03", "v": 151.0},
    {"d": "2024-01-04", "v": 155.0},
    {"d": "2024-01-05", "v": 158.0},
]

renderer = TimeSeriesChartRenderer(width=760, height=320)
svg = renderer.render(data, period="5D", title="AAPL Price History")
print(svg)  # Returns SVG string
With custom y-axis label and offset:
renderer = TimeSeriesChartRenderer(
    width=760,
    height=320,
    y_axis_label="$",
    y_axis_offset=0.1
)
svg = renderer.render(data, period="5D", title="AAPL Price History")
Bar Chart Example
from timeseries_svg import BarChartRenderer

# Temperature data by month
data = [
    {"d": "2024-01-01", "v": 65.0},
    {"d": "2024-02-01", "v": 68.0},
    {"d": "2024-03-01", "v": 72.0},
    {"d": "2024-04-01", "v": 75.0},
    {"d": "2024-05-01", "v": 80.0},
]

renderer = BarChartRenderer(width=760, height=320)
svg = renderer.render(data, period="1Y", title="Temperature by Month")
print(svg)  # Returns SVG string
With custom y-axis label and offset:
renderer = BarChartRenderer(
    width=760,
    height=320,
    y_axis_label="°F",
    y_axis_offset=0.1
)
svg = renderer.render(data, period="1Y", title="Temperature by Month")
API Parameters Summary
SparklineRenderer: width, height, stroke_width, baseline_color, up_color, down_color, show_baseline, color_by_open
TimeSeriesChartRenderer: width, height, margin, up_color, down_color, grid_color, axis_color, label_color, color_by_open, y_axis_label, y_axis_offset
BarChartRenderer: width, height, margin, bar_color, bar_width_ratio, grid_color, axis_color, label_color, color_by_open, y_axis_label, y_axis_offset
Common render() parameters: data, period, title, date_key, value_key
For complete parameter details and defaults, see docs/api-reference.md.
Usage Patterns
Direct Python Library Usage
Use the renderers directly in your Python code for programmatic SVG generation. Ideal for:
- Batch rendering of time-series data
- Report generation
- Static site generation
- Data pipelines
from timeseries_svg import SparklineRenderer, TimeSeriesChartRenderer

# Sparkline
sparkline_renderer = SparklineRenderer(width=200, height=64)
sparkline_svg = sparkline_renderer.render([100.0, 102.5, 101.2, 105.0])

# Chart
chart_renderer = TimeSeriesChartRenderer()
chart_svg = chart_renderer.render(data, period="1M", title="Price History")
REST API Server Usage
Run the included FastAPI server for remote rendering. Ideal for:
- Microservices architecture
- Multi-application environments that need shared SVG rendering
- Remote deployments
- Service-oriented integration
pip install "timeseries-sparklines[api]"
timeseries-server
The server starts on http://0.0.0.0:9300 with endpoints:
POST /sparkline-raw- Render sparkline from JSON dataPOST /chart-raw- Render chart from JSON dataGET /test-charts- Interactive test UIGET /health- Health check
Interactive Test UI
The GitHub repository includes a FastAPI-powered Test UI for testing rendering behavior, inspecting SVG output, and tuning chart parameters.
It acts as an interactive experimentation environment. You can test different data formats, adjust period filters, customize chart styling, and iteratively refine rendering settings using the included UI.
This helps you visualize how different data formats are normalized and how charts are rendered before using the settings in production.
Run locally:
git clone https://github.com/vrraj/timeseries-sparklines.git
cd timeseries-sparklines
pip install "timeseries-sparklines[api]"
timeseries-server
Open:
http://localhost:9300/test-charts
Why Server-Side SVG?
Backend Rendering Advantages
- Zero frontend chart runtime: No frontend chart dependency, no chart-specific bundle weight, and no browser-side chart initialization.
- SSR-friendly output: SVG can be embedded directly in HTML generated by Django, FastAPI/Jinja, Flask, Next.js, Laravel, Rails, or HTMX-style applications.
- Built-in normalization: The renderer maps raw values into SVG coordinates by calculating local min/max ranges, viewport dimensions, margins, and path geometry.
- Consistent visual output: Rendering happens in one controlled backend layer, so the same input data produces the same SVG markup across clients.
Slice, Scale, Draw, Respond
Your backend can expose chart views instead of raw chart logic. For example, you could implement an endpoint like:
GET /chart/AAPL?period=6M&theme=dark
This would fetch data for AAPL, render it with the specified period, and return SVG - all handled by your backend using the timeseries-sparklines renderer.
Data Input Formats
The library automatically normalizes various input formats. Use the format that best matches your data source:
List of Dicts (Standard Format)
Recommended for most use cases. Uses d for date and v for value.
data = [
    {"d": "2024-01-01", "v": 100.0},
    {"d": "2024-01-02", "v": 102.5},
    {"d": "2024-01-03", "v": 101.2},
    {"d": "2024-01-04", "v": 105.0},
]
List of Lists
Each inner list is [date, value]:
data = [
    ["2024-01-01", 100.0],
    ["2024-01-02", 102.5],
    ["2024-01-03", 101.2],
]
Dict with Date Keys
Date strings as keys, values as the data:
data = {
    "2024-01-01": 100.0,
    "2024-01-02": 102.5,
    "2024-01-03": 101.2,
}
Simple Value List
Auto-generates dates as "day-0", "day-1", etc. Best for sparklines where dates don't matter:
data = [100.0, 102.5, 101.2, 105.0]
Custom Keys
If your data uses different key names, specify them:
data = [
    {"date": "2024-01-01", "price": 100.0},
    {"date": "2024-01-02", "price": 102.5},
]

renderer.render(data, date_key="date", value_key="price")
Nested Format (JSONB from databases)
Common format for database JSONB storage:
data = {
    "history": [
        {"d": "2024-01-01", "v": 100.0},
        {"d": "2024-01-02", "v": 102.5},
    ]
}

# The library extracts the array automatically
Configuration
Sparkline Renderer
renderer = SparklineRenderer(
    width=96,              # SVG width in pixels
    height=32,             # SVG height in pixels
    stroke_width=1.8,      # Line stroke width
    baseline_color="rgba(148,163,184,0.35)",  # Baseline color
    up_color="#12b76a",    # Upward trend color
    down_color="#f04438",  # Downward trend color
    show_baseline=True,    # Show baseline reference line
)
Chart Renderer
renderer = TimeSeriesChartRenderer(
    width=760,              # SVG width in pixels
    height=320,             # SVG height in pixels
    margin={'top': 16, 'right': 20, 'bottom': 44, 'left': 58},  # Chart margins
    up_color="#16a34a",     # Upward trend color
    down_color="#dc2626",   # Downward trend color
    grid_color="rgba(148,163,184,0.35)",  # Grid line color
    axis_color="#94a3b8",   # Axis line color
    label_color="#64748b",  # Axis label color
)
Period Formatting
Charts support different time periods for label formatting:
5D: Daily labels (weekday)1M: Weekly labels (month day)3M: Every 3 weeks (month day)6M: Monthly labels (month)1Y: Every 2 months (month)
renderer.render(data, period="1M") # Use 1M label formatting
Data Normalization
Use the data normalization utilities directly if needed:
from timeseries_svg import normalize_timeseries_data, extract_values, extract_dates

normalized = normalize_timeseries_data(data)
values = extract_values(normalized)
dates = extract_dates(normalized)
Integration with Web Frameworks
FastAPI Example
from fastapi import FastAPI, Response
from timeseries_svg import SparklineRenderer

app = FastAPI()
renderer = SparklineRenderer()

@app.get("/sparkline/{symbol}")
async def get_sparkline(symbol: str):
    # Fetch data from your database/API
    data = await fetch_price_data(symbol)
    svg = renderer.render(data)
    return Response(content=svg, media_type="image/svg+xml")
Flask Example
from flask import Flask, Response
from timeseries_svg import TimeSeriesChartRenderer

app = Flask(__name__)
renderer = TimeSeriesChartRenderer()

@app.route("/chart/<symbol>")
def chart(symbol):
    data = fetch_historical_data(symbol)
    svg = renderer.render(data, period="1M")
    return Response(svg, mimetype="image/svg+xml")
Data Ownership
timeseries-sparklines is a rendering service, not a data service. Your application controls:
- Data fetching from databases, APIs, caches, or other systems
- Polling frequency, retries, and error handling
- Caching and business logic
- When to call the renderer and refresh the SVG
Typical backend pattern:
@app.get("/api/stocks/sparkline")
async def sparkline_api(symbol: str, period: str = "5D"):
    data = await get_price_history(symbol, period)
    svg = renderer.render(data, color_by_open=True)
    return Response(content=svg, media_type="image/svg+xml")
Frontend Integration Patterns
For frequently refreshed sparklines, server-side SVG rendering works best when updates are periodic, cacheable, and backed by server-side caching rather than sub-second.
For high-frequency streaming views, a hybrid approach is usually more efficient:
- Use
timeseries-sparklinesfor the initial sparkline render or SSR response - Batch multiple sparklines server-side when rendering many charts on one page, such as 50 symbols in a watchlist
- Cache rendered SVGs or source data on the backend when multiple users request the same view
- Use WebSockets or incremental frontend updates for live changes
- Pause polling when browser tabs are inactive and refresh the full sparkline on wake-up or focus
This pattern works best when:
- Update frequency is moderate, such as 30-60 seconds for sparklines
- Many similar charts can share cached data or rendered SVG output
- Multiple sparklines can be batched into a single backend response
- The frontend mainly displays SVG and does not need heavy chart interaction
Recommended pattern:
-
Render charts or sparklines from backend data
- Your backend fetches or receives the latest time-series data
timeseries-sparklinesrenders the SVG- The frontend replaces the SVG markup in the target container
-
Render larger charts on demand
- User selects a symbol, metric, chart, or period
- Frontend requests a chart with a period such as
5D,1M,3M,6M, or1Y - The backend returns a sliced SVG chart
Example: Batch multiple sparklines in one request
// Batch fetch multiple sparklines
async function fetchSparklines(symbols) {
  const response = await fetch('/api/sparklines', {
    method: 'POST',
    body: JSON.stringify({ symbols, period: '5D' })
  });
  const data = await response.json();
  // data.svgs = { 'AAPL': '<svg>...', 'GOOGL': '<svg>...' }
  Object.entries(data.svgs).forEach(([symbol, svg]) => {
    document.getElementById(`sparkline-${symbol}`).innerHTML = svg;
  });
}

// Poll with visibility API to pause when tab is inactive
let pollInterval;
function startPolling(symbols) {
  pollInterval = setInterval(() => {
    if (!document.hidden) {
      fetchSparklines(symbols);
    }
  }, 30000); // 30 seconds
}
document.addEventListener('visibilitychange', () => {
  if (!document.hidden) fetchSparklines(symbols); // Refresh on wake-up
});
Best practice: set a minimum height on the target container to avoid layout shifts when SVG is injected.
.sparkline-container {
  min-height: 64px;
}

.chart-container {
  min-height: 320px;
}
License
MIT License - see LICENSE file for details.
Contributing
Contributions welcome! Please feel free to submit a Pull Request.
Release history Release notifications | RSS feed

Download files
Download the file for your platform. If you're not sure which to choose, learn more about installing packages.
Source Distribution
Built Distribution
Filter files by name, interpreter, ABI, and platform.
If you're not sure about the file name format, learn more about wheel file names.
Copy a direct link to the current filters
File details
Details for the file timeseries_sparklines-0.1.1.tar.gz.
File metadata
- Download URL: timeseries_sparklines-0.1.1.tar.gz
- Upload date:
- Size: 21.8 kB
- Tags: Source
- Uploaded using Trusted Publishing? No
- Uploaded via: twine/6.2.0 CPython/3.11.9
File hashes
| Algorithm | Hash digest | |
|---|---|---|
| SHA256 |
b115e3147c9a54beedc0b3e465454b9c5b11060b935aaf06035880a87adc63e9
|
|
| MD5 |
bc5fb55b6585b2951ca97dbd36b82305
|
|
| BLAKE2b-256 |
6638c52d73c620cc6e4891c56ba8d8e0af95da05a48e675e249075e4cb9a8a77
|
File details
Details for the file timeseries_sparklines-0.1.1-py3-none-any.whl.
File metadata
- Download URL: timeseries_sparklines-0.1.1-py3-none-any.whl
- Upload date:
- Size: 27.1 kB
- Tags: Python 3
- Uploaded using Trusted Publishing? No
- Uploaded via: twine/6.2.0 CPython/3.11.9
File hashes
| Algorithm | Hash digest | |
|---|---|---|
| SHA256 |
21166097948d9cb2acd689022f4eea6eddc05b869e1cfd37358bbf8ce3a240b5
|
|
| MD5 |
4c5c5f04cfb571c6e888263e9cc12edc
|
|
| BLAKE2b-256 |
47552a4a6040efe8cb08faec7c373be26a32c6ccfd451d931c4d207a5a999b7e
|


