
Tendermint Metrics Monitor - A TUI for monitoring blockchain metrics
Verified details
These details have been verified by PyPIProject links
GitHub Statistics
Maintainers

Project description
Tendermint Metrics Monitor (tmm)
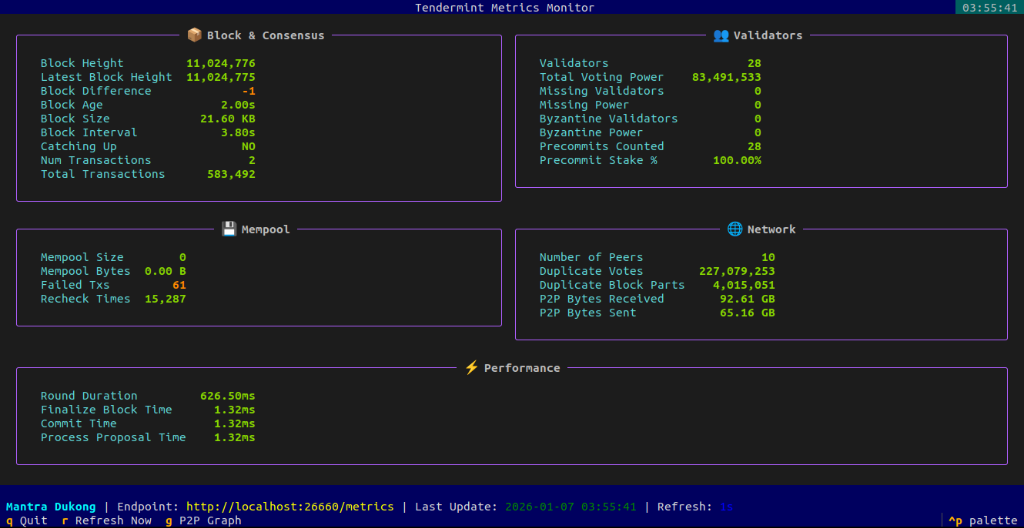
A beautiful terminal-based TUI (Text User Interface) for monitoring Tendermint/CometBFT blockchain metrics from Prometheus endpoints.
Features
- 📊 Real-time Metrics Display: Auto-refreshing dashboard with customizable intervals
- 🎨 Visually Appealing: Color-coded metrics with grouped panels for easy reading
- ⚙️ Configurable: Chain-specific metric configurations via JSON files
- 🔄 Auto-refresh: Configurable refresh intervals (default: 1 second)
- 🌐 Flexible: Works with any Prometheus-compatible metrics endpoint
Supported Chains
| Chain | Network IDs |
|---|---|
| 0G Chain | 0gchain-16602, 0G-mainnet-aristotle |
| Babylon | bbn-1, bbn-test-6 |
| Celestia | celestia, mocha-4, arabica-11 |
| Cosmos Hub | cosmoshub-4, theta-testnet-001 |
| Dymension | dymension_1100-1, blumbus_111-1 |
| Mantra | mantra-dukong-1, mantra-1 |
| Neutron | neutron-1, pion-1 |
| Nillion | nillion-1, nillion-chain-testnet-1 |
| Terra | phoenix-1, pisco-1 |
| Xion | xion-mainnet-1, xion-testnet-2 |
Installation
From PyPI
pip3 install tmm-monitor
From GitHub
pip3 install git+https://github.com/bert2002/tmm.git
From Source (Local Development)
-
Clone the repository:
git clone https://github.com/bert2002/tmm.git
cd tmm
-
Install in editable mode:
pip3 install -e .
This will install the tmm command to your environment. Ensure your python binary directory (e.g., ~/.local/bin) is in your PATH.
Running from Source
If you prefer not to install the package, you can run it directly from the repository:
-
Install dependencies:
pip3 install -r requirements.txt
-
Run using Python:
export PYTHONPATH=$PYTHONPATH:$(pwd)/src
python3 -m tmm.main [OPTIONS]
Usage
Basic Usage
tmm
This will connect to http://localhost:26660/metrics and display metrics for cosmoshub-4.
Command Line Options
tmm [OPTIONS]
Options:
--metrics <URL>- Prometheus metrics endpoint (default:http://localhost:26660/metrics)--refresh <SECONDS>- Refresh interval in seconds (default:1)--chain <CHAIN_ID>- Chain identifier (default: auto-detect)--namespace <NAMESPACE>- Metrics namespace (default:cometbft)
Examples
Monitor a custom endpoint with 2-second refresh:
tmm --metrics http://validator.example.com:26660/metrics --refresh 2
Monitor a different chain:
tmm --chain osmosis-1 --namespace cometbft
Keyboard Shortcuts
q- Quit the applicationr- Refresh metrics immediately
Metrics Display
The TUI organizes metrics into the following panels:
📦 Block & Consensus
- Block height and latest block height
- Block size and interval
- Sync status
- Transaction counts
👥 Validators
- Total validators and voting power
- Missing validators and their power
- Byzantine validators (double-signers)
- Precommit statistics
💾 Mempool
- Mempool size (transactions and bytes)
- Failed and evicted transactions
- Recheck statistics
🌐 Network
- Connected peer count
- Duplicate votes and block parts
- P2P bytes sent and received
⚡ Performance
- Round duration
- ABCI method timings (finalize_block, commit, process_proposal)
Chain Configuration
Chain-specific metrics are defined in JSON files located in the chains/ directory.
Creating a Custom Chain Configuration
-
Create a new JSON file in
chains/directory:cp chains/cosmoshub-4.json chains/my-chain.json
-
Edit the configuration to define which metrics to display:
{
  "name": "My Chain",
  "chain_id": ["my-chain-1", "my-chain-alternative-id"],
  "endpoints": ["http://localhost:26660/metrics"],
  "metrics": {
    "block_consensus": [
      {
        "name": "Block Height",
        "metric": "consensus_height",
        "type": "gauge",
        "format": "int"
      }
    ]
  }
}
-
Run tmm with your chain:
tmm --chain my-chain
Metric Configuration Format
Each metric entry supports:
name- Display namemetric- Prometheus metric name (without namespace prefix)type- Metric type (gauge,counter,histogram)format- Display format (int,bytes,duration,percent,bool)stat- For histograms:avg,sum,countlabels- Optional label filters
Chain Endpoints & Auto-detection
You can specify a list of endpoints in the configuration file. TMM uses these endpoints to auto-detect the active chain when no --chain argument is provided.
"endpoints": [
  "http://localhost:26660/metrics",
  "http://IP:26660/metrics"
]
When running tmm without arguments, it probes these endpoints and selects the first one that returns metrics matching the configuration's chain_id.
Fallback Behavior
If a chain configuration file is not found, tmm automatically falls back to cosmoshub-4.json.
Project Structure
tmm/
├── src/
│   └── tmm/                  # Package source
│       ├── main.py           # Entry point
│       └── chains/           # Chain configurations
├── tests/                    # Tests
├── pyproject.toml            # Project configuration
└── README.md                   # This file
License
MIT
Contributing
Contributions are welcome! Please feel free to submit pull requests or open issues.
Project details
Verified details
These details have been verified by PyPIProject links
GitHub Statistics
Maintainers


Download files
Download the file for your platform. If you're not sure which to choose, learn more about installing packages.
Source Distribution
Built Distribution
Filter files by name, interpreter, ABI, and platform.
If you're not sure about the file name format, learn more about wheel file names.
Copy a direct link to the current filters
File details
Details for the file tmm_monitor-1.1.7.tar.gz.
File metadata
- Download URL: tmm_monitor-1.1.7.tar.gz
- Upload date:
- Size: 15.6 kB
- Tags: Source
- Uploaded using Trusted Publishing? Yes
- Uploaded via: twine/6.1.0 CPython/3.13.7
File hashes
| Algorithm | Hash digest | |
|---|---|---|
| SHA256 |
a48e314db28cc882630d12a0937c5044d200052e609a3fe98b2bc84f23441768
|
|
| MD5 |
4cd4308b85169e977ac3ebb7a19278a4
|
|
| BLAKE2b-256 |
46ebff824bc143edbe02f47f97be9f364c3304d1e9deacfb7c29e0849e148b97
|
Provenance
The following attestation bundles were made for tmm_monitor-1.1.7.tar.gz:
Publisher:
publish.yml on bert2002/tmm
-
Statement:
-
Statement type:
https://in-toto.io/Statement/v1 -
Predicate type:
https://docs.pypi.org/attestations/publish/v1 -
Subject name:
tmm_monitor-1.1.7.tar.gz -
Subject digest:
a48e314db28cc882630d12a0937c5044d200052e609a3fe98b2bc84f23441768 - Sigstore transparency entry: 844571963
- Sigstore integration time:
-
Permalink:
bert2002/tmm@68eb4036b93a3b4193f1e99d5730b9b13742859a -
Branch / Tag:
refs/tags/v1.1.7 - Owner: https://github.com/bert2002
-
Access:
public
-
Token Issuer:
https://token.actions.githubusercontent.com -
Runner Environment:
github-hosted -
Publication workflow:
publish.yml@68eb4036b93a3b4193f1e99d5730b9b13742859a -
Trigger Event:
push
-
Statement type:
File details
Details for the file tmm_monitor-1.1.7-py3-none-any.whl.
File metadata
- Download URL: tmm_monitor-1.1.7-py3-none-any.whl
- Upload date:
- Size: 20.4 kB
- Tags: Python 3
- Uploaded using Trusted Publishing? Yes
- Uploaded via: twine/6.1.0 CPython/3.13.7
File hashes
| Algorithm | Hash digest | |
|---|---|---|
| SHA256 |
4aa70a9fbf83edf3a0bf3d988b67dc2521be1b74ea4a8148d3ec852cb0c31dd5
|
|
| MD5 |
be5fd224510329afee34ec014e5efe6c
|
|
| BLAKE2b-256 |
cff3d467fc3c4be62ae49cdc0d8460d9f5fbf274071412a3aa9772c919bb21ff
|
Provenance
The following attestation bundles were made for tmm_monitor-1.1.7-py3-none-any.whl:
Publisher:
publish.yml on bert2002/tmm
-
Statement:
-
Statement type:
https://in-toto.io/Statement/v1 -
Predicate type:
https://docs.pypi.org/attestations/publish/v1 -
Subject name:
tmm_monitor-1.1.7-py3-none-any.whl -
Subject digest:
4aa70a9fbf83edf3a0bf3d988b67dc2521be1b74ea4a8148d3ec852cb0c31dd5 - Sigstore transparency entry: 844571964
- Sigstore integration time:
-
Permalink:
bert2002/tmm@68eb4036b93a3b4193f1e99d5730b9b13742859a -
Branch / Tag:
refs/tags/v1.1.7 - Owner: https://github.com/bert2002
-
Access:
public
-
Token Issuer:
https://token.actions.githubusercontent.com -
Runner Environment:
github-hosted -
Publication workflow:
publish.yml@68eb4036b93a3b4193f1e99d5730b9b13742859a -
Trigger Event:
push
-
Statement type:






