
TNO PET Lab - Synthetic Data Generation (SDG) - Tabular - Evaluation - Utility Metrics
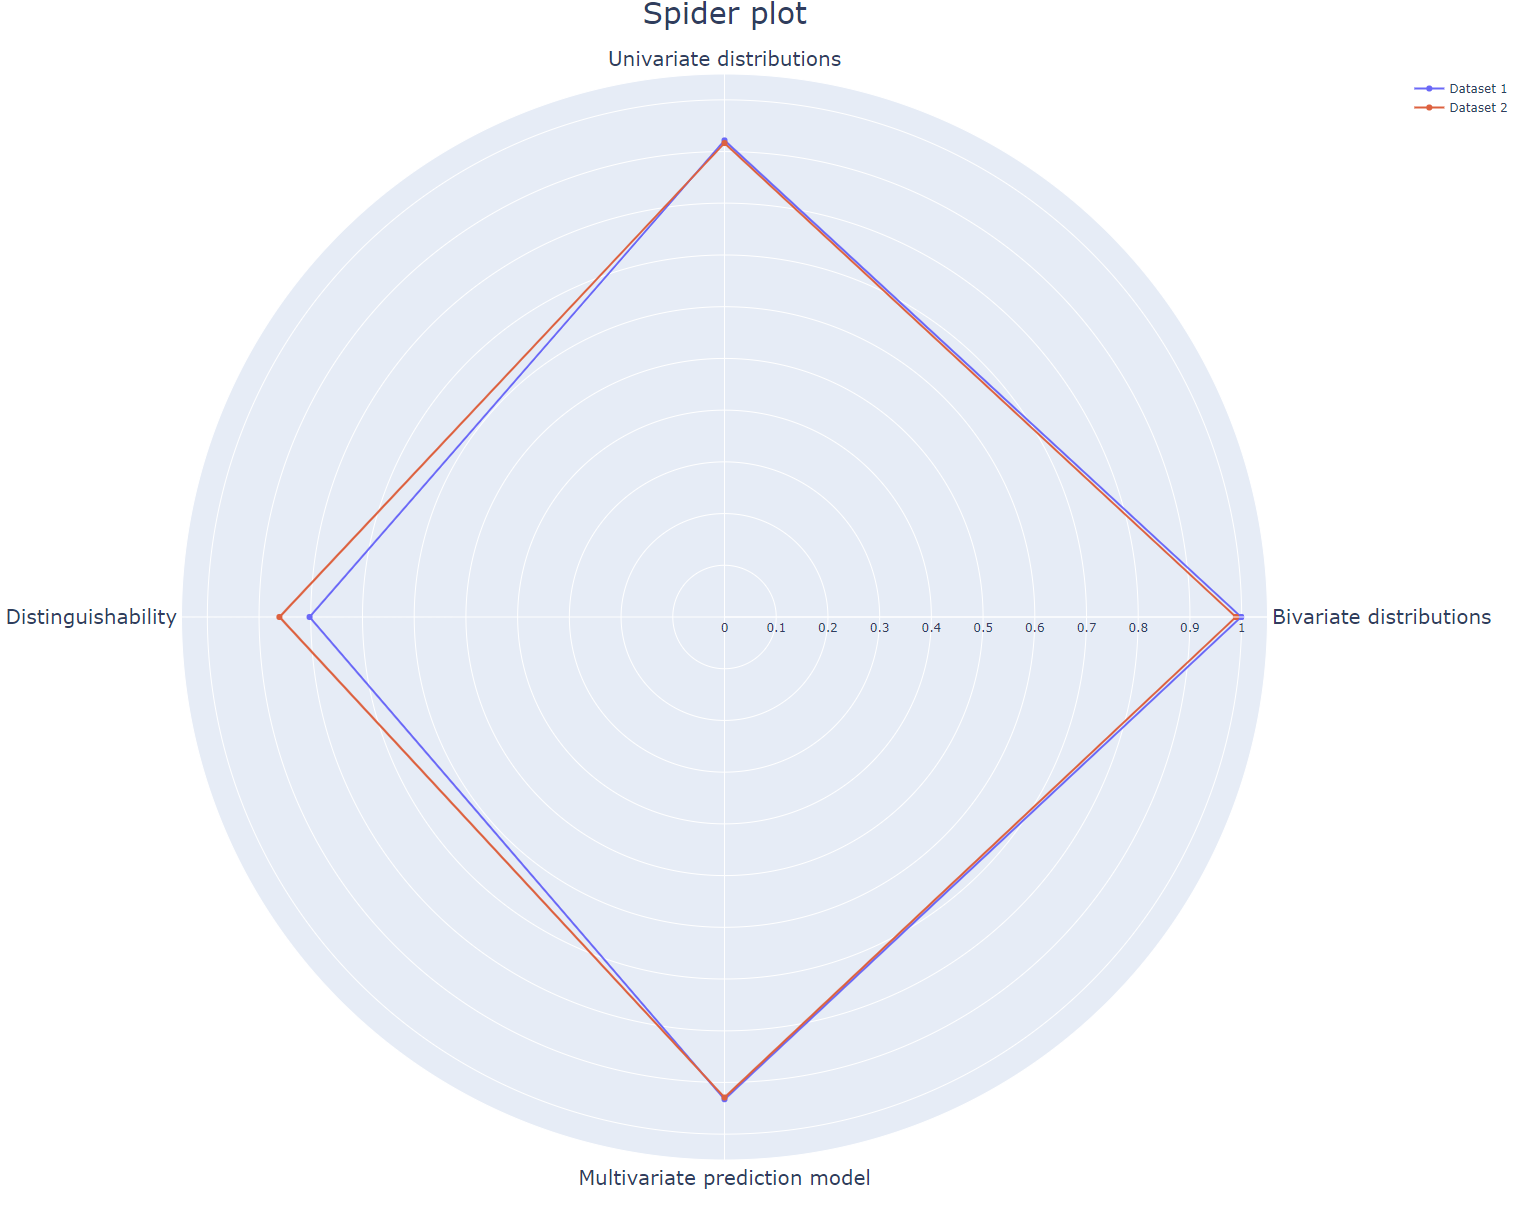
Extensive evaluation of the utility of synthetic data sets. The original and synthetic data are compared on distinguishability and on a univariate, bivariate and multivariate level. All four metrics are visualized in one plot with a spiderplot. Where one equals 'complete overlap' and zero equals 'no overlap' between original and synthetic data. This plot can depict multiple synthetic data sets. Therefore it can be used to evaluate different levels of privacy protection in synthetic data sets, varying parameter settings in synthetic data generators, or completely different synthetic data generators.
All individual metrics depicted in the spiderplot can be visualized as well. The example_script.py shows you step by step how to generate all visualizations. The main functionalities of the scripts are:
- Univariate distributions: shows the distributions of one variable for the original and synthetic data.
- Bivariate correlations: visualizes a Pearson-r correlation matrix for all variables.
- Multivariate predictions: shows an SVM classifier predicts accuracies for each variable training on either original or synthetic data tested on original data.
- Distinguishability: shows the AUC of a logistic classifier that classifies samples as either original or synthetic.
- Spiderplot: generates spiderplot for these four metrics.
Note that any required pre-processing of the (synthetic) data sets should be done prior. Take into account addressing NANs, missing values, outliers and scaling the data.
For more information on the selected metrics, please refer to the paper (link will be added upon publication) or contact madelon.molhoek@tno.nl. As we aim to keep developing our code feedback and tips are welcome.
PET Lab
The TNO PET Lab consists of generic software components, procedures, and functionalities developed and maintained on a regular basis to facilitate and aid in the development of PET solutions. The lab is a cross-project initiative allowing us to integrate and reuse previously developed PET functionalities to boost the development of new protocols and solutions.
The package tno.sdg.tabular.eval.utility_metrics is part of the TNO Python Toolbox.
Limitations in (end-)use: the content of this software package may solely be used for applications that comply with international export control laws.
This implementation of cryptographic software has not been audited. Use at your own risk.
Documentation
Documentation of the tno.sdg.tabular.eval.utility_metrics package can be found
here.
Install
Easily install the tno.sdg.tabular.eval.utility_metrics package using pip:
$ python -m pip install tno.sdg.tabular.eval.utility_metrics
Note: If you are cloning the repository and wish to edit the source code, be sure to install the package in editable mode:
$ python -m pip install -e 'tno.sdg.tabular.eval.utility_metrics'
If you wish to run the tests you can use:
$ python -m pip install 'tno.sdg.tabular.eval.utility_metrics[tests]'
Usage
See the script in the scripts directory.
1 maintainer

Release files for tno.sdg.tabular.eval.utility-metrics 0.4.1
For a detailed explanation of source distributions (sdists) and built distributions (wheels), please see the package formats documentation.
Source distribution (sdist)
| File | Size | Uploaded | |
|---|---|---|---|
| tno_sdg_tabular_eval_utility_metrics-0.4.1.tar.gz | 264.2 kB | Details |
Built distribution (wheel)
| File | Interpreter | ABI | Platform | Reset |
|---|---|---|---|---|
| tno.sdg.tabular.eval.utility_metrics-0.4.1-py3-none-any.whl | Python 3 | none | any | Details |
Total release size: 299.6 kB
Release files / tno_sdg_tabular_eval_utility_metrics-0.4.1.tar.gz
| Download URL | tno_sdg_tabular_eval_utility_metrics-0.4.1.tar.gz |
|---|---|
| Size | 264.2 kB |
| Tags | Source |
|
SHA-256 checksum How to use checksums |
0cf27d73c74457c7df1bb4c17f85ff5cf648e7e7f37a4925f57d145fc758bcdb
|
|
BLAKE2b-256 checksum How to use checksums |
5be5602559c5a760c24afdef56933cceb8d958806540b74c14714fb28f6bdd4e
|
| Upload date | |
|
Uploaded using Trusted Publishing? What is trusted publishing? |
No |
| Uploaded via |
twine/4.0.2 CPython/3.9.18
|
Release files / tno.sdg.tabular.eval.utility_metrics-0.4.1-py3-none-any.whl
| Download URL | tno.sdg.tabular.eval.utility_metrics-0.4.1-py3-none-any.whl |
|---|---|
| Size | 35.4 kB |
| Tags | Python 3 |
|
SHA-256 checksum How to use checksums |
f9612930152b4d3877d94ebfa1ac83af6dcd35e762721c2930dbe334bd4fd27b
|
|
BLAKE2b-256 checksum How to use checksums |
12059fa3367f90bb81074a8263ef845fc8cc94d394f6be8bb144d8584a1b0003
|
| Upload date | |
|
Uploaded using Trusted Publishing? What is trusted publishing? |
No |
| Uploaded via |
twine/4.0.2 CPython/3.9.18
|














