Totally Bearable Spectrometer UI

Project description
tobes-ui: Totally Bearable Spectrometer UI
This is a UI for several spectrometers:
- Torch Bearer Spectrometer (
Y21B7W10034CCPD) that is available on Amazon and AliExpress (TB Store) - Ocean Optics Flame-S, USB4000 (and maybe others)
Originally forked from ZoidTechnology/Torch-Bearer-Tools[^1] and improved (beyond recognition).
It also supports displaying its own json saves and importing csv data from
yet another Chinese range of spectrometers (Hopoocolor HPCS-320, HPCS-330).
Install
pipx install tobes-ui
or:
pip install tobes-ui
If you want support for Ocean Optics, you also need to install tobes-ui[ocean],
and also (for Linux and Windows) follow the
OS support instructions
on python-seabreeze.
Usage
usage: main.py [-h] [-b] [-L] [-e EXPOSURE] [-q | -t GRAPH_TYPE] [-o | -n]
               [-f FILE_TEMPLATE] [-d [DATA ...]] [-s HISTORY_SIZE] [-l LOG_LEVEL]
               [--log-file LOG_FILE] [-m MODE]
               [input_device]

Totally Bearable Spectrometer UI

positional arguments:
  input_device          Spectrometer device (dev:string); ; e.g. /dev/ttyUSB0, or
                        type:/dev/foo (registered types: fake, fake-spectrometer, oo, ocean,
                        oceanoptics, tb, torchbearer)

options:
  -h, --help            show this help message and exit
  -b, --backends        List all spectrometer backends
  -L, --loaders         List all file loaders
  -e, --exposure EXPOSURE
                        Exposure time in milliseconds (0.1-5000) or 'auto' (default: auto)
  -q, --quick-graph     Enable quick (LINE) graph mode
  -t, --graph_type GRAPH_TYPE
                        Graph type (LINE, SPECTRUM, CIE1931, CIE1960UCS, CIE1976UCS, TM30,
                        OVERLAY) (default SPECTRUM)
  -o, --oneshot         One shot mode (single good capture)
  -n, --no-refresh      Start without refresh
  -f, --file_template FILE_TEMPLATE
                        File template (without .ext) for data export (default:
                        'spectrum-{timestamp_full}{graph_type}'),
                        '{name}-{timestamp_full}{graph_type}' might be also useful
  -d, --data [DATA ...]
                        File(s) to load for viewing (disables data refresh); (loaders: hpcs,
                        json)
  -s, --history-size HISTORY_SIZE
                        Size of the measurement history (default: 50)
  -l, --log-level LOG_LEVEL
                        Logging level to configure: DEBUG, INFO, WARN, ERROR, FATAL (default
                        WARN)
  --log-file LOG_FILE   Logfile to write to (defaults to none (=console))
  -m, --mode MODE       Mode to run in: PLOT, WLC (default PLOT)
usage: main.py [-h] [-b] [-L] [-e EXPOSURE] [-q | -t GRAPH_TYPE] [-o | -n]
               [-f FILE_TEMPLATE] [-d [DATA ...]] [-s HISTORY_SIZE] [-l LOG_LEVEL]
               [--log-file LOG_FILE] [-m MODE]
               [input_device]
My typical use is:
# To gather new data from Torch Bearer:
python3 -m tobes_ui.main /dev/ttyUSB0 -e auto -o
# or (if you use pipx): tobes-ui /dev/...

# To gather new data from Ocean Optics:
python3 -m tobes_ui.main oo: -e auto -o

# To "replay" existing samples:
python3 -m tobes_ui.main -d examples/*.json
# or (if you use pipx): tobes-ui -d ...

# To wavelength calibrate (OO only):
python3 -m tobes_ui.main oo: -m wlc

# To wavelength calibrate using fake (replay) spectrometer
python3 -m tobes_ui.main fake:examples/cali-sample.json -m wlc
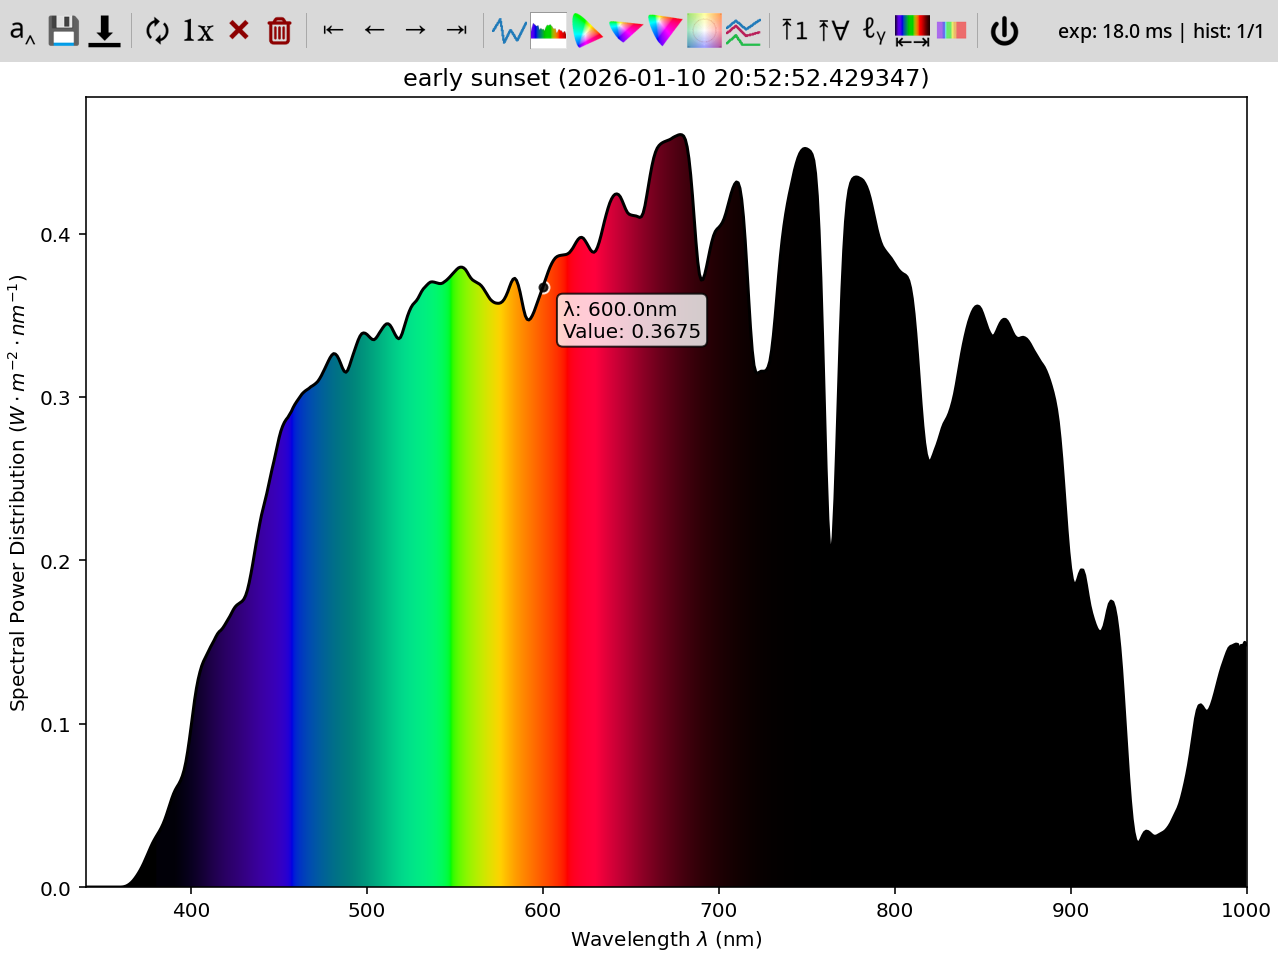
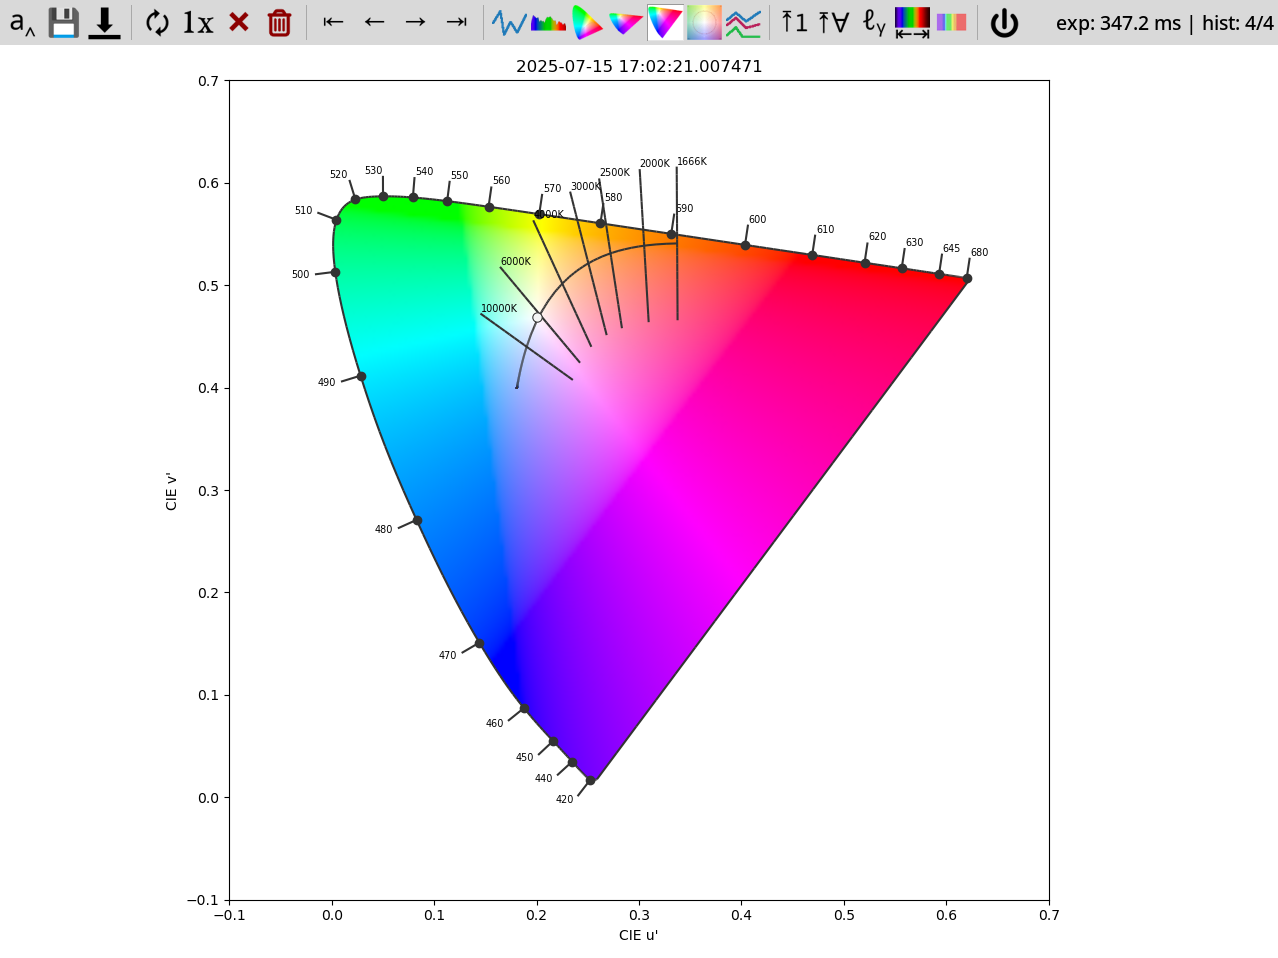
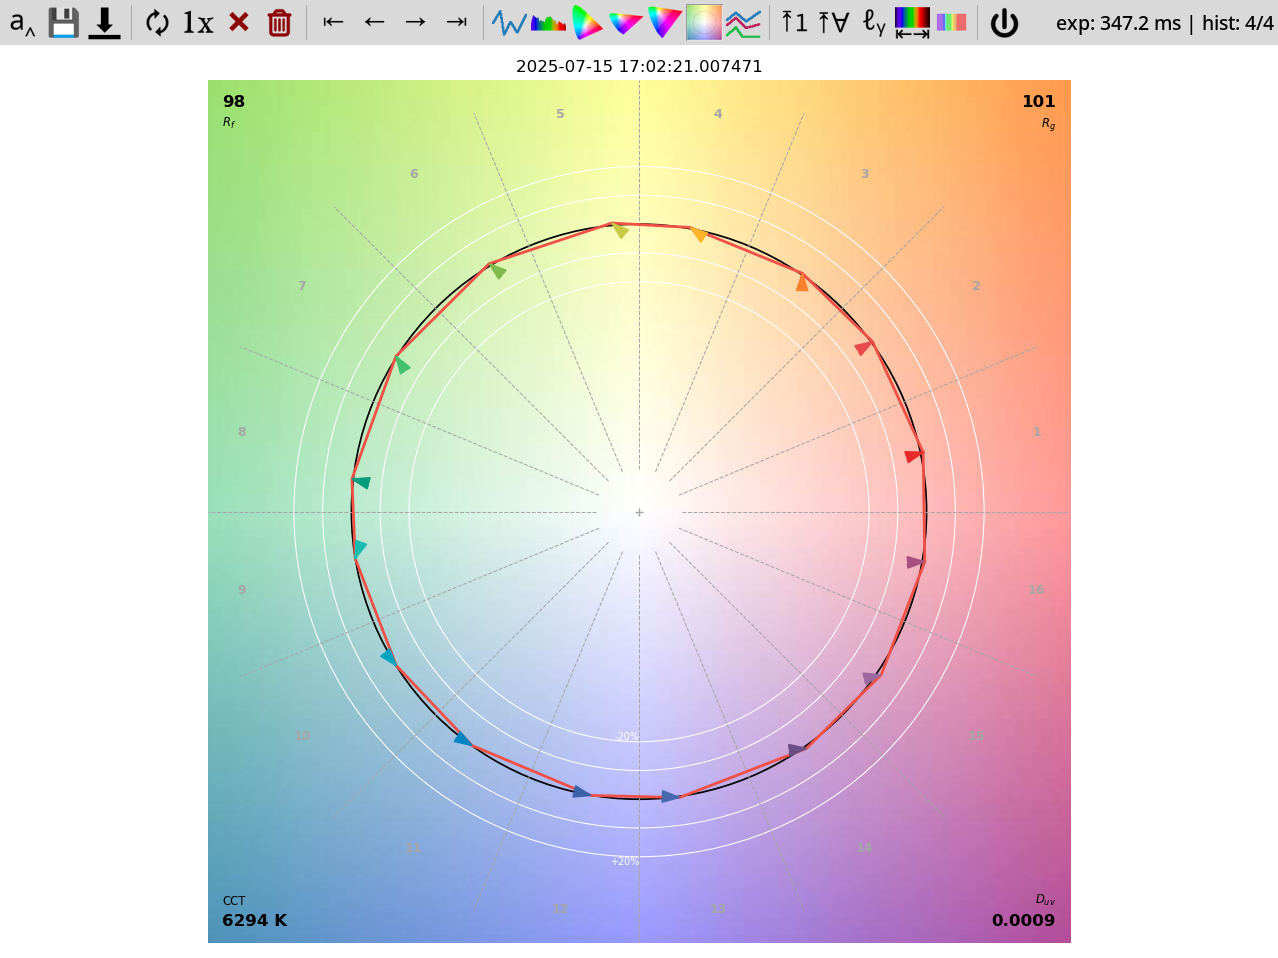
The first invocation gives one-shot spectrum on auto exposure (from /dev/ttyUSB0):
Or, if you prefer, screenshot of the CIE1976UCS locus or screenshot of the TM30 graph.
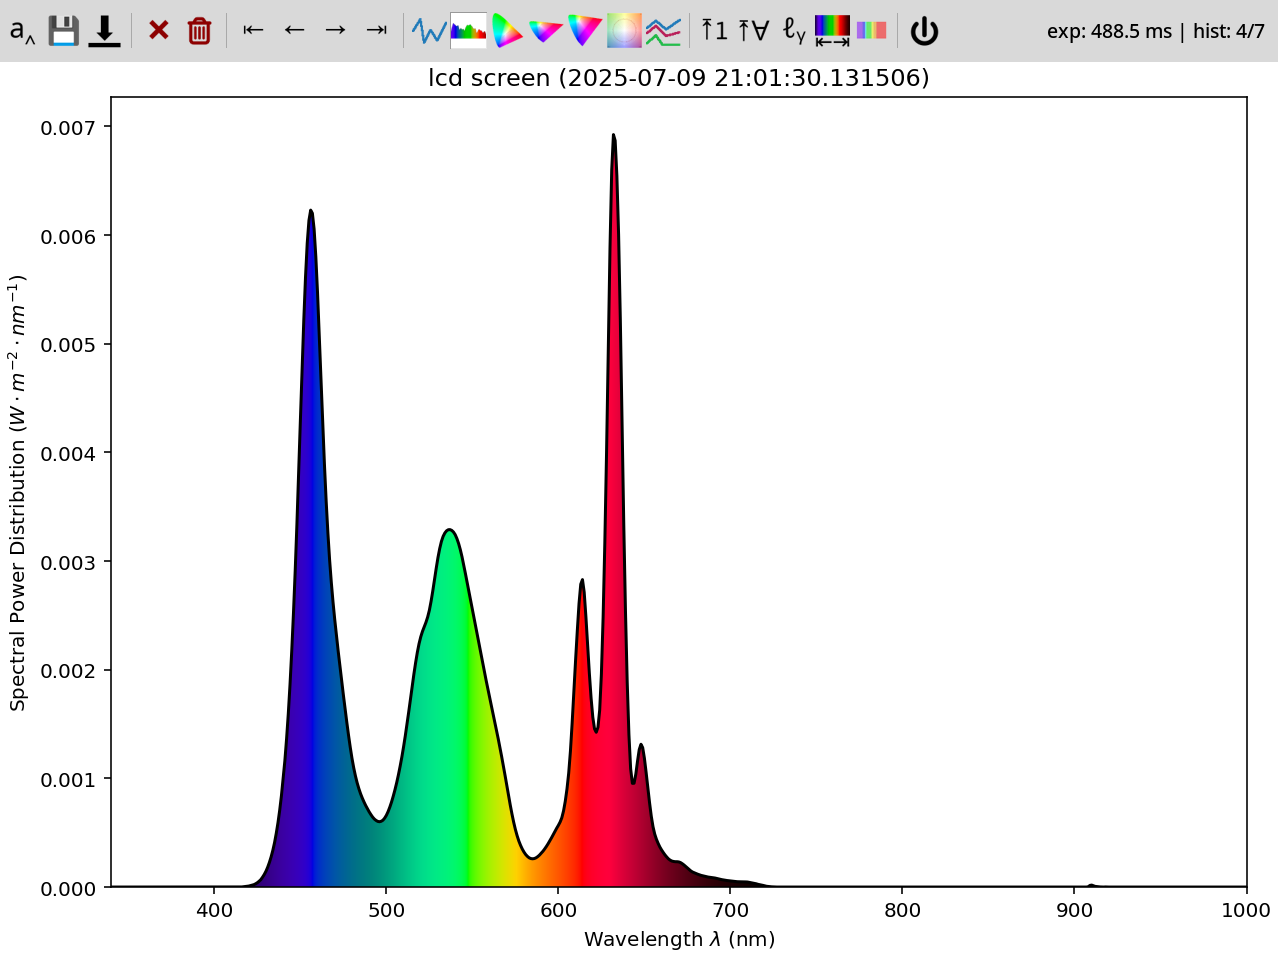
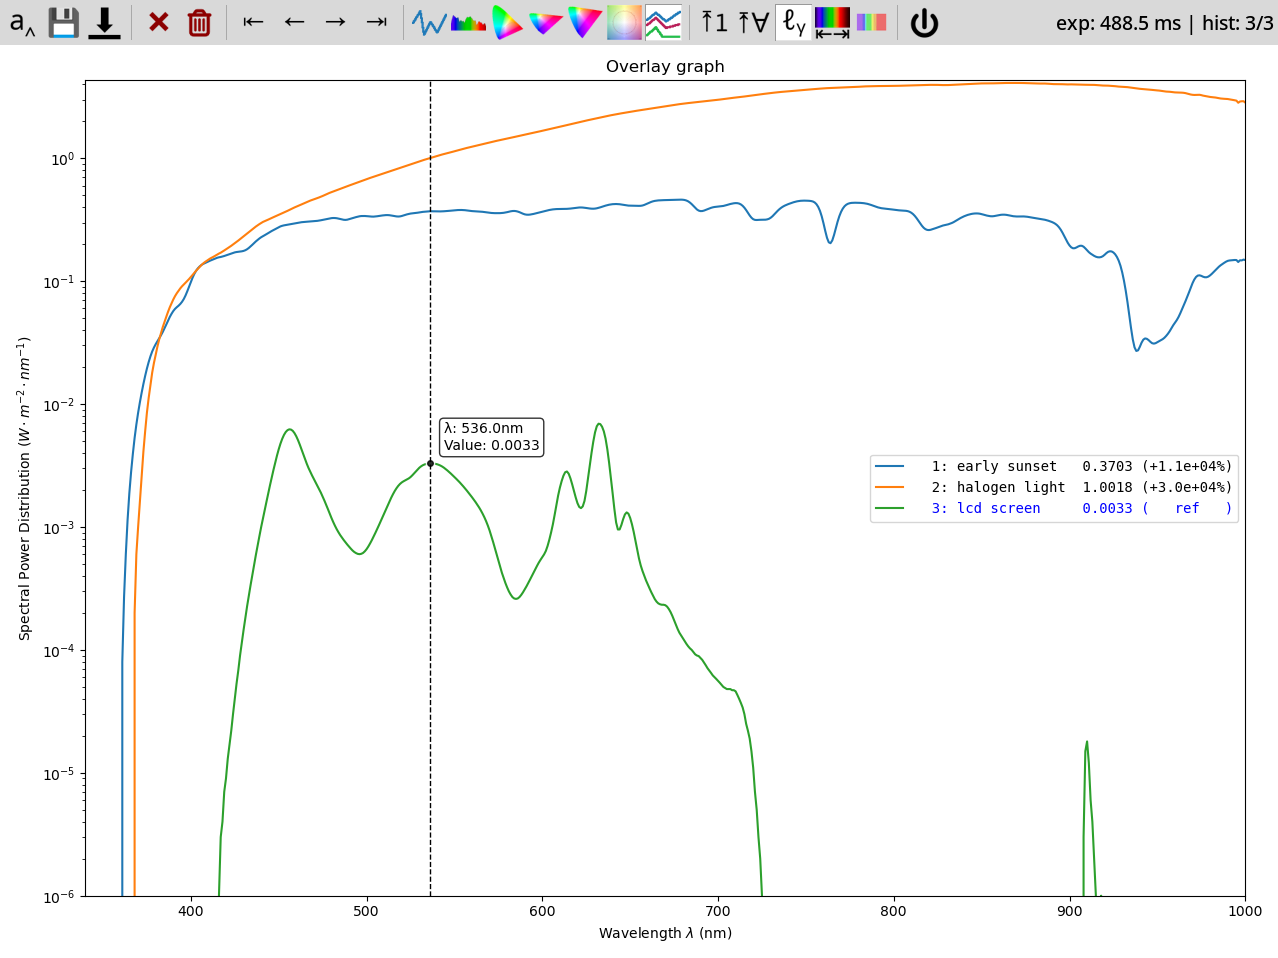
The "replay" invocation shows you saved data from examples (no spectrometer needed!):
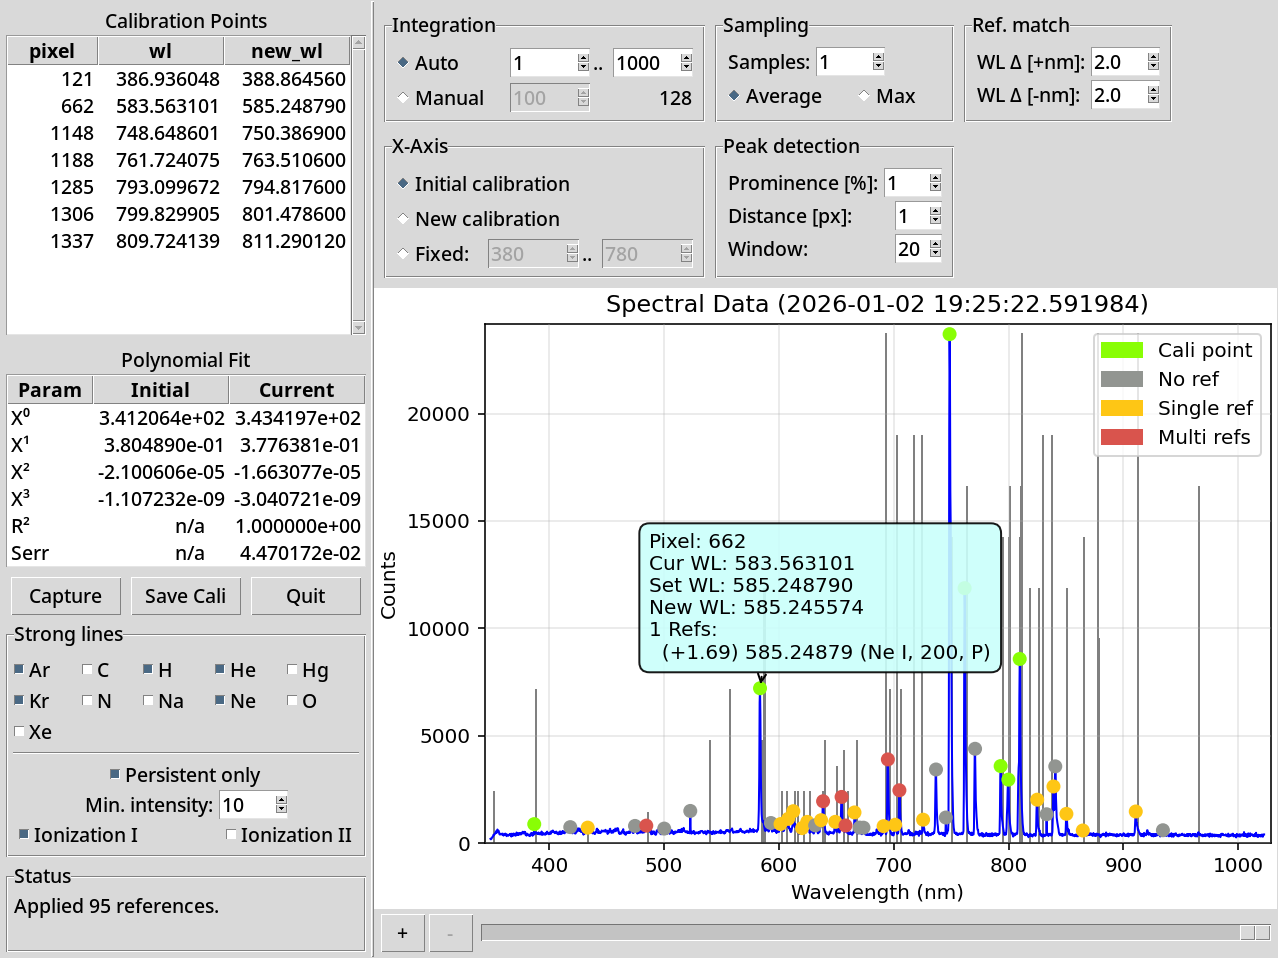
The "wavelength calibration" allows you to calibrate wavelength of supported spectrometers (currently only Ocean Optics or fake (replay) spectrometer):
Plot tools
There are several icons on the toolbar:
| Icon | Key | Explanation |
|---|---|---|
 |
Enter, A |
Name the current spectrum data |
 |
S |
Saves rendered graph as png |
 |
D |
Save raw data as json |
 |
R |
Keep refreshing data |
 |
1, O |
One good acquisition |
 |
Delete, X |
Remove the current spectrum data (from UI) |
 |
- |
Remove all the spectrum data (from UI) |
 |
Home, H |
Go to start of history |
 |
←, P |
Go to previous sample |
 |
→, N |
Go to next sample |
|
End, E |
Go to end of history |
 |
Q, L |
Line graph |
 |
C |
Spectrum graph (slow to draw) |
 |
3 |
CIE1931 locus graph |
 |
6 |
CIE1960UCS locus graph |
 |
7 |
CIE1976UCS locus graph |
 |
T |
TM30 graph |
 |
V |
Overlay graph -- all spectra at once |
 |
Y |
Only line+spectrum: Fix Y-axis range based on current graph |
 |
G |
Only line+spectrum: Fix Y-axis range based on all graphs |
 |
K |
Only line+overlay: Use logarithmic Y-axis |
 |
Z |
Only line, spectrum, overlay: Limit X axis to visible spectrum (380..750 nm) |
 |
| |
Only line, overlay: Show spectrum + photosensitivities overlay |
 |
Esc, Ctrl+Q |
Quit the app |
Exported data
Sample exported data:
{
    "status": "normal",
    "exposure": "automatic",
    "time": 329.1,
    "spd": {
        "340": 0.0,
        "341": 0.0,
        "...": "......",
        "595": 0.013011,
        "596": 0.013095,
        "597": 0.013176,
        "598": 0.013251,
        "599": 0.013318,
        "600": 0.013385,
        "601": 0.01345,
        "602": 0.013515,
        "603": 0.013575,
        "604": 0.013621,
        "605": 0.013648,
        "...": "......",
        "995": 0.005143,
        "996": 0.005075,
        "997": 0.005119,
        "998": 0.004982,
        "999": 0.004944,
        "1000": 0.004859
    },
    "wavelength_range": [
        340,
        1000
    ],
    "wavelengths_raw": [
        340,
        341,
        "...",
        999,
        1000
    ],
    "spd_raw": [
        0.0,
        0.0,
        "......",
        0.013011,
        0.013095,
        0.013176,
        0.013251,
        0.013318,
        0.013385,
        0.01345,
        0.013515,
        0.013575,
        0.013621,
        0.013648,
        "......",
        0.005143,
        0.005075,
        0.005119,
        0.004982,
        0.004944,
        0.004859
    ],
    "ts": 1751704901.025932,
    "name": "my fancy spectrum",
    "y_axis": "$W\\cdot{}m^{-2}\\cdot{}nm^{-1}$",
    "device": "Y21B7W10034CCPD",
    "meta": {
        "key": "value"
    }
}
Meaning of the keys:
| Key | Type | Default | Meaning |
|---|---|---|---|
| status | enum | required | Status of the exposure (normal, over, under) |
| exposure | enum | required | Type of the exposure (manual, automatic) |
| time | float | required | Time (ms) of the exposure |
| spd | dict[int, float] | required | Dictionary of wavelength: intensity |
| wavelength_range | range | from spd | Range of spd |
| wavelengths_raw | list[float] | None | Raw wavelengths (device-specific) |
| spd_raw | list[float] | None | Raw intensities (device-specific) |
| ts | unix ts | required | Time when the measurement took place |
| name | str | None | Human name for the measurement |
| y_axis | str | "counts" |
Unit for the Y axis |
| device | str | None | Identifier of the device that took the measurement |
| meta | dict[str, any] | {} |
Spectrometer-specific metadata |
License
GPLv3
[^1]: Discussed in the Software Hacks Unlock Cheap Spectrometer article.
Release history Release notifications | RSS feed


Download files
Download the file for your platform. If you're not sure which to choose, learn more about installing packages.
Source Distribution
Built Distribution
Filter files by name, interpreter, ABI, and platform.
If you're not sure about the file name format, learn more about wheel file names.
Copy a direct link to the current filters
File details
Details for the file tobes_ui-0.3.3.tar.gz.
File metadata
- Download URL: tobes_ui-0.3.3.tar.gz
- Upload date:
- Size: 769.5 kB
- Tags: Source
- Uploaded using Trusted Publishing? No
- Uploaded via: twine/6.1.0 CPython/3.13.5
File hashes
| Algorithm | Hash digest | |
|---|---|---|
| SHA256 |
661eb27249c816c8ce10b2d6ba2116d510685bdab907057c4ada4f41f1d7c3ba
|
|
| MD5 |
1a3d7828086942aae92686ace2207ad9
|
|
| BLAKE2b-256 |
1c24e8d6a8809dc4e74035cdcdd2850d77e3ec71721dcdc36da002f0b480f634
|
File details
Details for the file tobes_ui-0.3.3-py3-none-any.whl.
File metadata
- Download URL: tobes_ui-0.3.3-py3-none-any.whl
- Upload date:
- Size: 898.6 kB
- Tags: Python 3
- Uploaded using Trusted Publishing? No
- Uploaded via: twine/6.1.0 CPython/3.13.5
File hashes
| Algorithm | Hash digest | |
|---|---|---|
| SHA256 |
1cffeb4fd6a63458584cf024b6d956627422e8bf5f88096f1a606ecd3955e70f
|
|
| MD5 |
e89d21b2fcfff73f9cb0a61c0b0e4b26
|
|
| BLAKE2b-256 |
8634de951d563c75d50b223322481d4c3e3eacec2acb36414aee0b89f530af92
|


