
Token Bill
Why is your AI agent bill so high? Token Bill reads a log of your agent's API calls and shows you, in dollars, what was wasted and the exact line to fix.




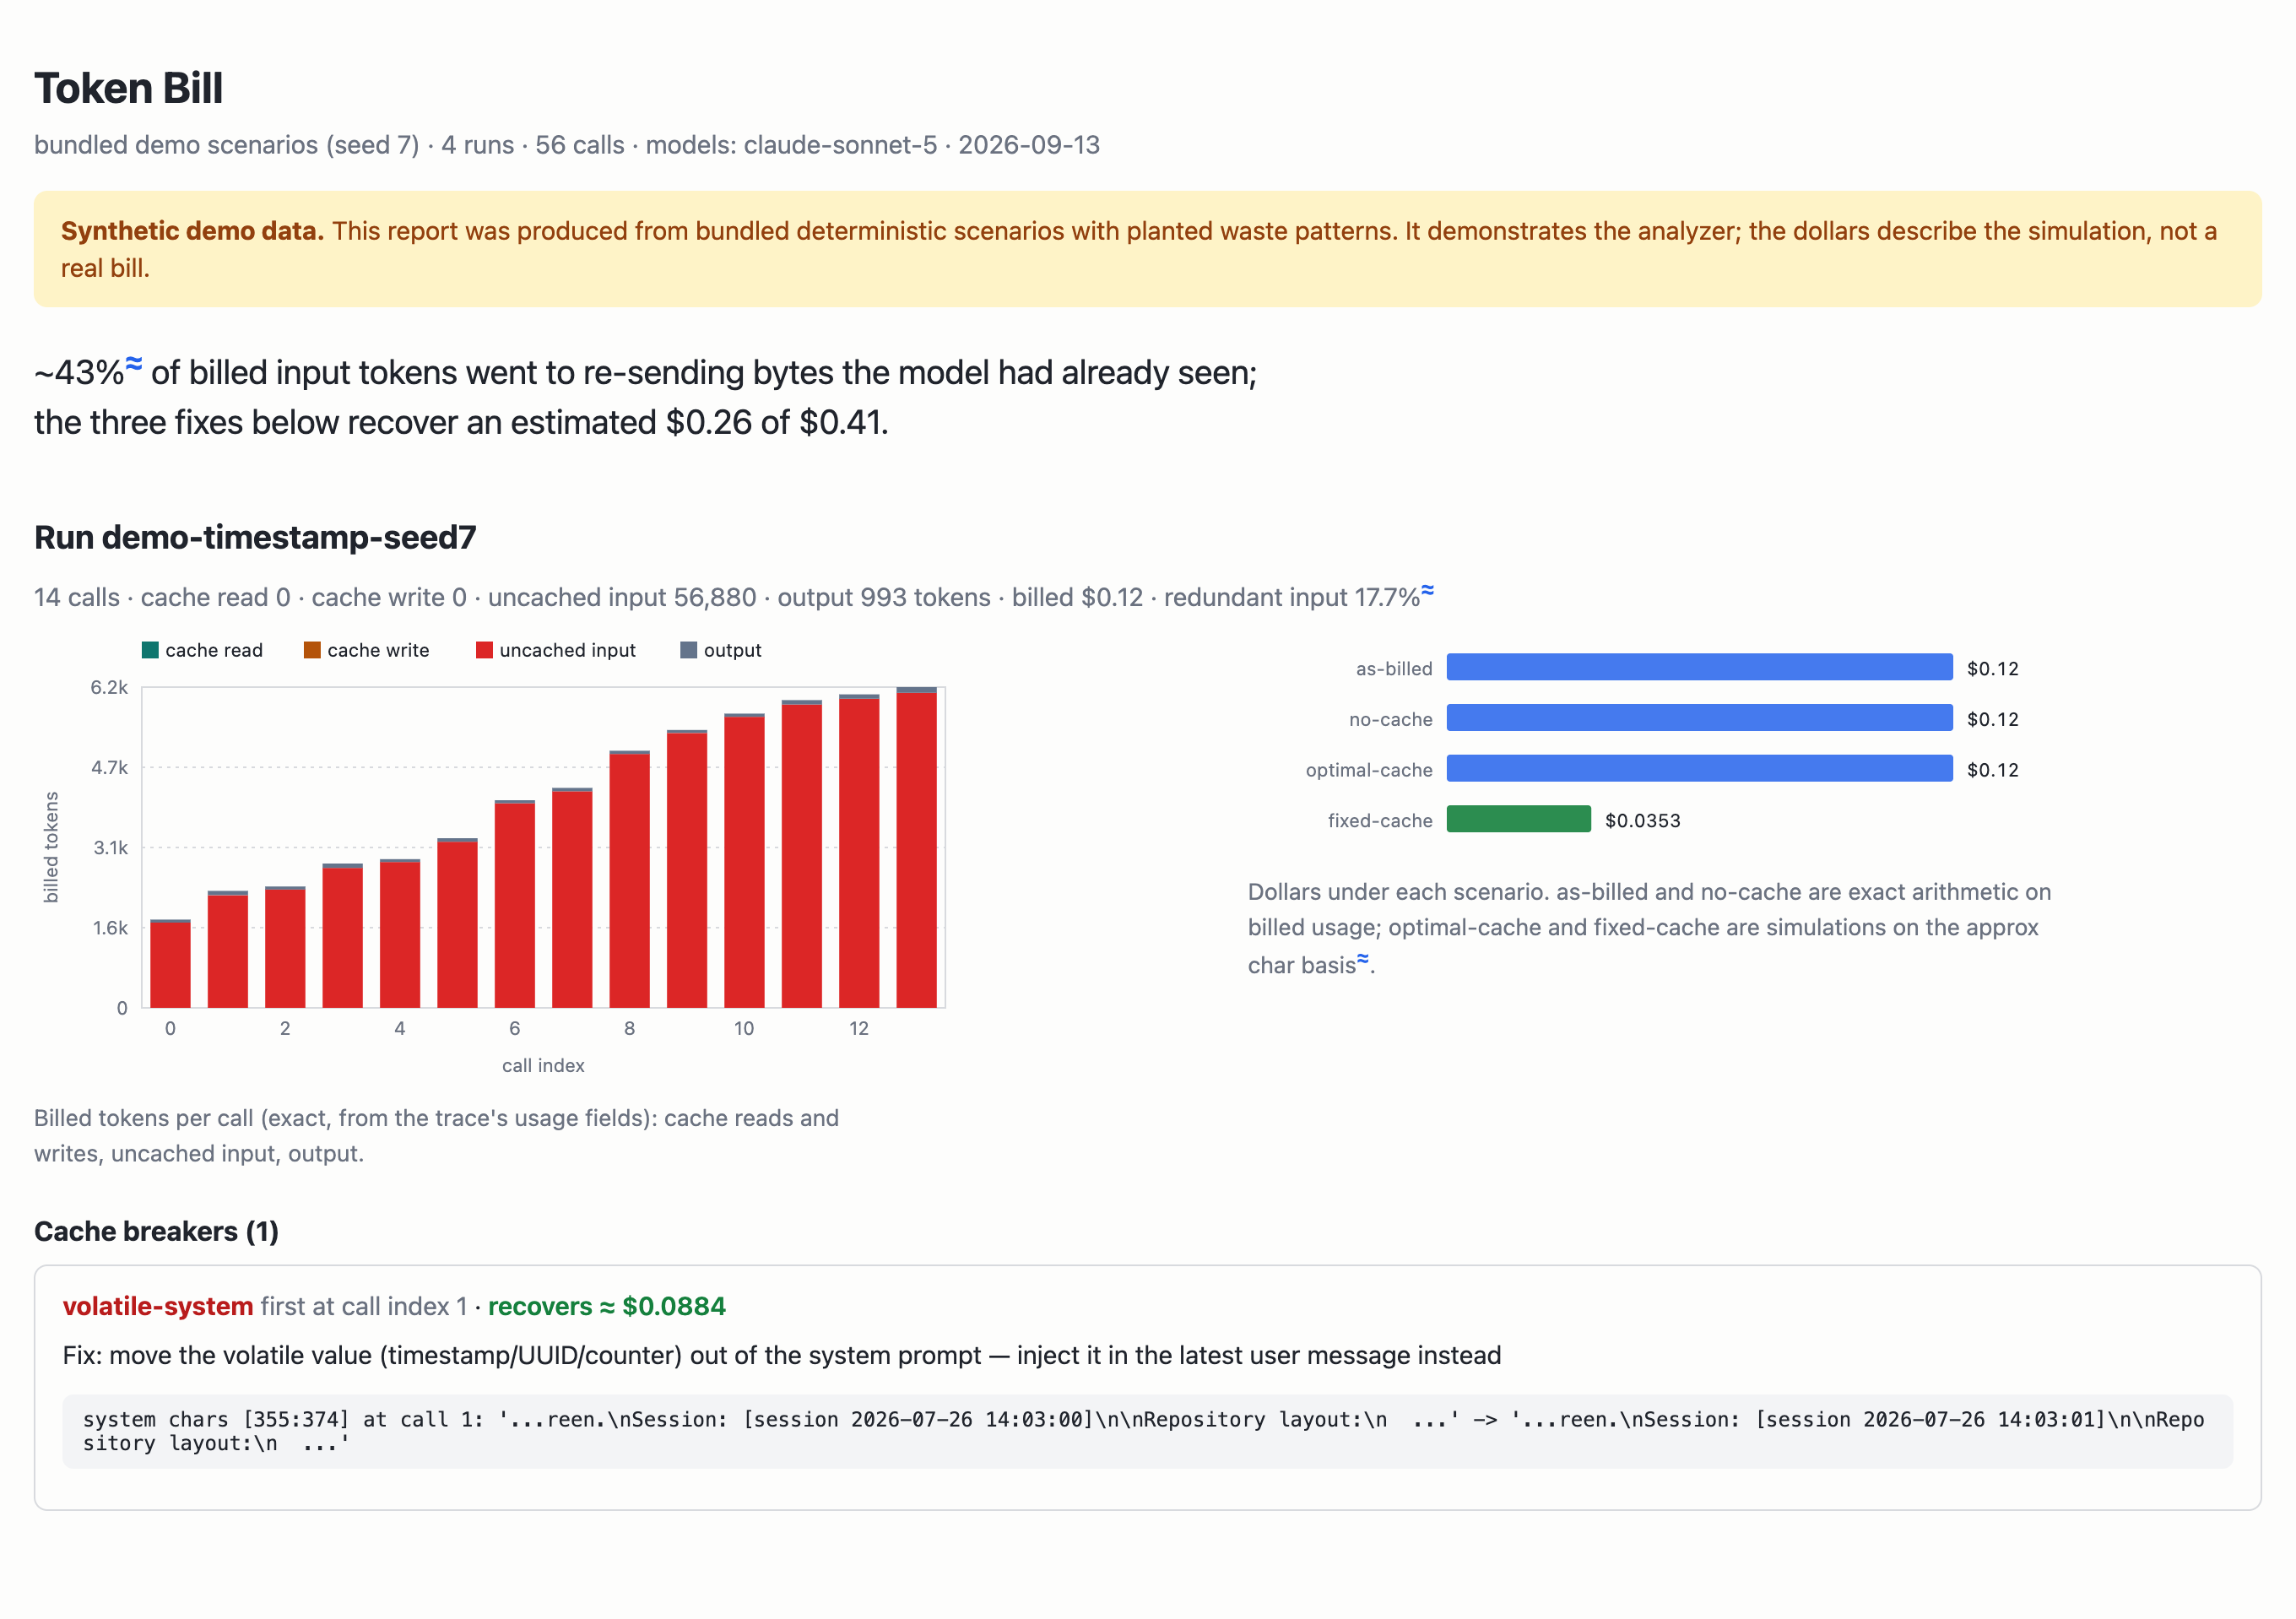
A Token Bill report for one run of the bundled demo (synthetic data; no API key needed).
The problem, in plain English
An AI agent works in a loop. On every step it sends the model the whole conversation so far: its instructions, its list of tools, every earlier message, plus one new line. A 20-step task pays to send almost the same text 20 times.
Anthropic softens this with a discount called the prompt cache. Text the model saw in the last few minutes costs a tenth of the normal price (or less, on some models) to send again. The catch: the discount only applies while the start of the request is exactly the same as last time, character for character. Change one character near the top and everything after it is billed at full price again.
Think of a print shop that gives you 90% off reprinting any page it printed a few minutes ago, as long as every page before it is unchanged. Put today's time on page 1, and every page in the stack costs full price.
The usual causes are small and easy to miss:
- A clock time or random ID in the agent's instructions (
Current time: 14:03:07) - The tool list changing order between steps
- Caching never switched on for the request
- Editing earlier messages, or switching models partway through
Nothing warns you. The bill is just higher than it should be.
What Token Bill tells you
Point it at a trace (a log of the API calls one agent run made, with the usage the API billed) and it reports:
- Where the money went. Each call split into cached text, full-price text, and output, in tokens and dollars, straight from what you were billed.
- How much was wasted. The share of input you paid full price to send again.
- What broke the discount, and what fixing it is worth. The cause, the step where it started, a one-sentence fix, and the dollars that fix recovers.
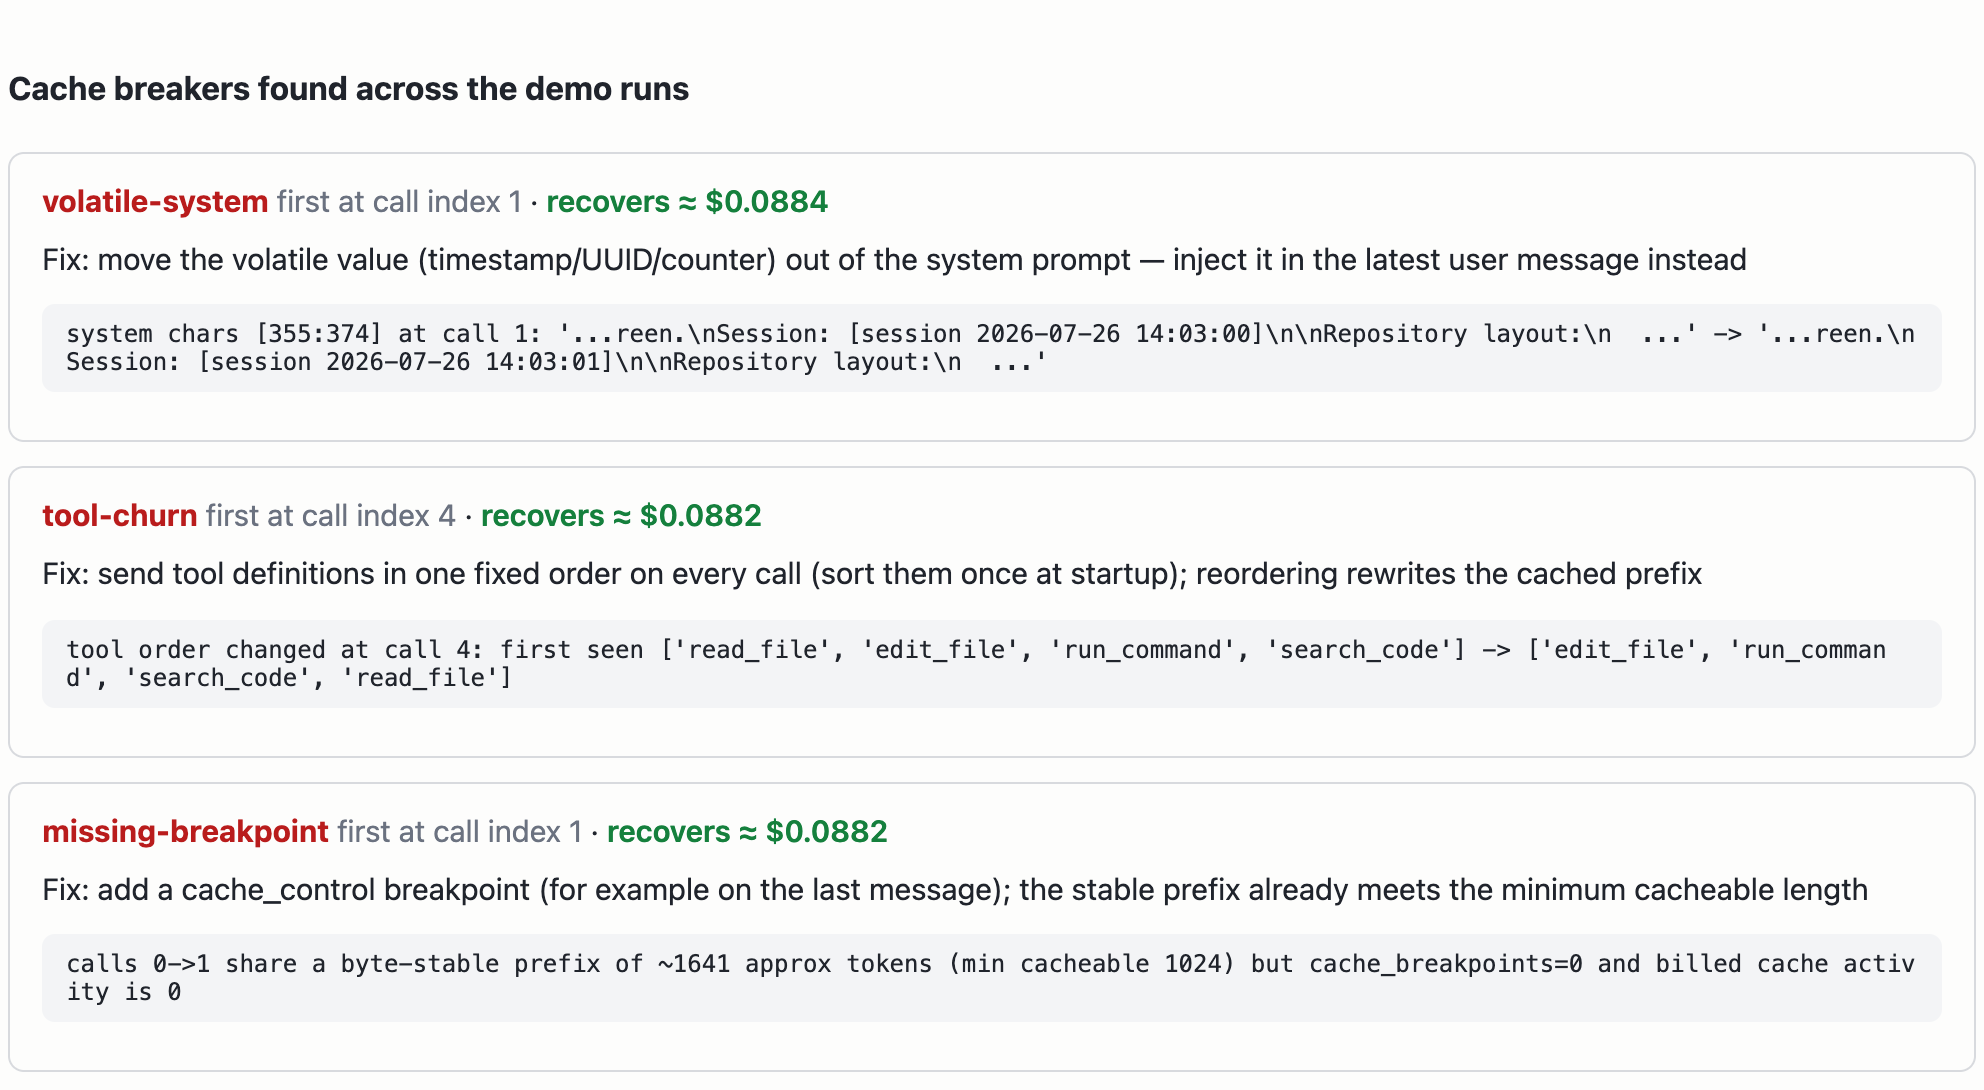
Everything runs on your machine: no account, no network, no dependencies beyond Python 3.10+. v0.1 covers Anthropic's prompt cache; the trace format itself is provider-neutral (adapters welcome, see the roadmap).
Token Bill is an independent open-source project, not affiliated with or endorsed by Anthropic.
60-second start (no keys, no network)
pip install tokenbill
tokenbill demo
(Latest development version: pip install git+https://github.com/sedai77/tokenbill-llm-agent-cost-profiler.)
No
pipon your machine? Common on stock macOS, whose built-in Python is also too old (3.9). The painless path is uv:curl -LsSf https://astral.sh/uv/install.sh | sh, reopen your terminal, thenuv tool install tokenbill— uv brings its own Python, andtokenbillis on your PATH from then on.
The demo runs the whole pipeline on four made-up agent runs with problems
planted in them (a timestamp in the instructions, a shuffling tool list,
caching never switched on) plus one healthy run for comparison, then finds
exactly what was planted. No API key, no network, no other package. Add
-o report.html to also get the HTML report shown above.
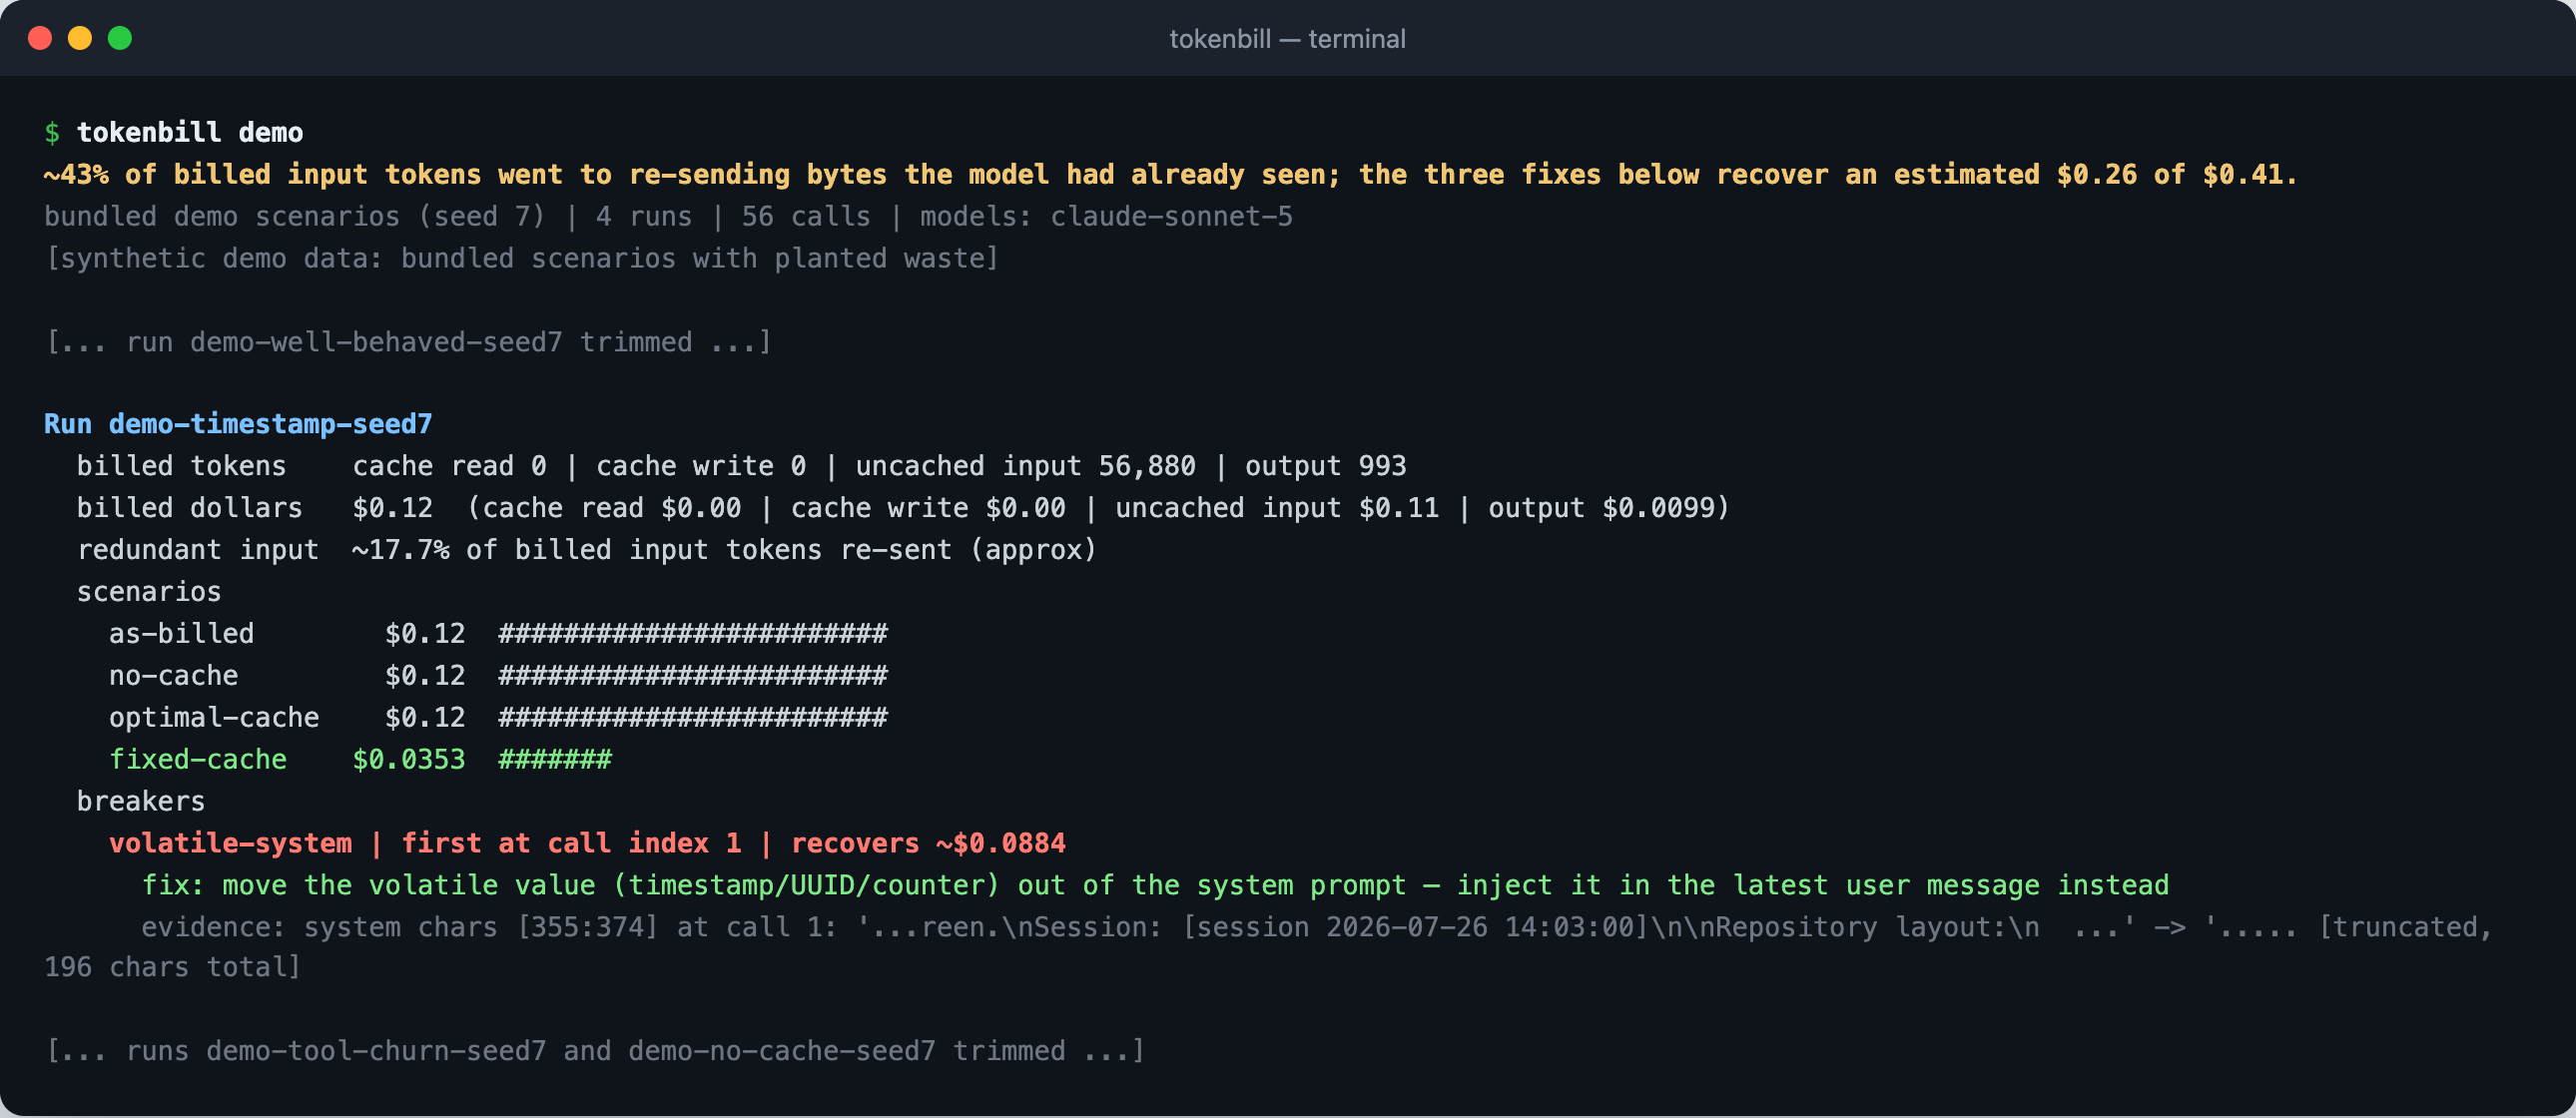
The same output as text (trimmed to one of the four runs; the demo is deterministic, so your numbers will match)
~43% of billed input tokens went to re-sending bytes the model had already seen; the three fixes below recover an estimated $0.26 of $0.41.
bundled demo scenarios (seed 7) | 4 runs | 56 calls | models: claude-sonnet-5
[synthetic demo data: bundled scenarios with planted waste]

[... run demo-well-behaved-seed7 (the control: zero breakers) trimmed ...]

Run demo-timestamp-seed7
  billed tokens    cache read 0 | cache write 0 | uncached input 56,880 | output 993
  billed dollars   $0.12  (cache read $0.00 | cache write $0.00 | uncached input $0.11 | output $0.0099)
  redundant input  ~17.7% of billed input tokens re-sent (approx)
  scenarios
    as-billed        $0.12  ########################
    no-cache         $0.12  ########################
    optimal-cache    $0.12  ########################
    fixed-cache    $0.0353  #######
    note (as-billed): exact: real billed usage priced at published rates (ground truth)
    note (no-cache): counterfactual: every billed input token repriced at the full uncached rate (no cache reads, no write premium)
    note (optimal-cache): simulated (approx): documented cache rules — 300s TTL sliding on read, min-cacheable gate, one breakpoint at end of messages; char-based token split scaled to billed totals
    note (fixed-cache): simulated (approx): optimal-cache rules over the breaker-repaired rendering; billed usage totals reused for the token split
  breakers
    volatile-system | first at call index 1 | recovers ~$0.0884
      fix: move the volatile value (timestamp/UUID/counter) out of the system prompt — inject it in the latest user message instead
      evidence: system chars [355:374] at call 1: '...reen.\nSession: [session 2026-07-26 14:03:00]\n\nRepository layout:\n  ...' -> '..... [truncated, 196 chars total]

[... runs demo-tool-churn-seed7 and demo-no-cache-seed7 trimmed ...]

approx (~): char-based attribution scaled to billed totals; dollar and token totals come from real billed usage.
Your first real trace (5 minutes, ~$0.05)
Ready-made path from zero to a report about real API calls —
examples/record_demo.py is a miniature agent
(12 Claude calls on Haiku, ~5 cents total) with the recorder already wired in:
pip install tokenbill anthropic
export ANTHROPIC_API_KEY="sk-ant-..."   # console.anthropic.com → API keys
curl -O https://raw.githubusercontent.com/sedai77/tokenbill-llm-agent-cost-profiler/main/examples/record_demo.py
python record_demo.py                   # watch real cache_read tokens appear from turn 2
tokenbill analyze trace.jsonl -o report.html
(The curl is because a pip install ships no examples/ directory — skip it if
you cloned the repo and run python examples/record_demo.py instead.)
The report will show the system prompt being cached for real (billed
cache_read tokens from Anthropic's servers) and call out that the growing
conversation history is re-sent uncached each turn — an honest finding about
that script's design, with dollars attached. Then do the experiment in the
script's docstring: prepend a volatile per-turn value (e.g. f"[session {turn}] ")
to the system prompt, record to a second trace file, and watch Token Bill catch
the cache breaker you just introduced.
Recording your own agent
Wrap your Anthropic SDK client; run your agent exactly as before:
from pathlib import Path
from anthropic import Anthropic
from tokenbill.instrument import Recorder

client = Recorder(Path("trace.jsonl")).wrap(Anthropic())
Then:
tokenbill analyze trace.jsonl -o report.html
Honest notes on what the recorder does: it duck-types the client — Token Bill
never imports anthropic — wrapping messages.create and messages.stream
(streaming usage is read from get_final_message()). AsyncAnthropic works
too: the async wrapper awaits the response before recording, and
async with client.messages.stream(...) is supported. At call time it
captures the model, system prompt, tools, messages, and cache-breakpoint
count; from the response it captures billed usage and stop reason. Each
completed call is appended to the JSONL immediately, so a crashed run keeps
every call that finished. One caveat: raw streaming via
messages.create(stream=True) returns a stream object that carries no
usage, so those calls are not recorded (a warning tells you to use
messages.stream(...) instead) — never silently logged as zero-cost. Your
API calls, your credentials, your SDK — Token Bill only observes. Treat the
resulting trace file as a secret: it contains your prompts
(see SECURITY.md).
You can price models Token Bill doesn't know (self-hosted, brand-new) with
--model-price MODEL=IN,OUT ($/MTok); unknown models otherwise report tokens
with dollars marked unknown rather than guessing.
Exact vs. approximate — where the line is
Most cost tools hand-wave this line; Token Bill draws it explicitly:
- Every dollar total is exact. It comes from the trace's real billed
usagefields (input_tokens,cache_read_input_tokens,cache_creation_input_tokens,output_tokens) times the published prices — the provider's own accounting, not an estimate. - Attribution is approximate, and labeled. Splitting one call's billed input across system/tools/history segments, and locating divergence points in token terms, uses a character heuristic (chars ÷ 3.7) — never tiktoken, which is the wrong tokenizer for Claude. Every approximate number is scaled so segments sum to the call's exact billed total, and carries an "approx" label everywhere it surfaces.
The full rationale — the redundancy formula, why 3.7, error bounds, threats to validity — is in DESIGN.md.
What it finds: the cache breakers
| Breaker | What it looks like in the trace | The shape of the fix |
|---|---|---|
volatile-system |
Consecutive calls' system prompts differ only in a timestamp / UUID / counter span | Move the volatile value out of the system prompt (e.g. into the latest user message) |
tool-churn |
The tool definition list changes order or content mid-run | Freeze tool registration order |
history-rewrite |
An already-delivered message was edited or truncated in place | Append new messages; never rewrite delivered history |
model-switch |
The model changes mid-run | Pin one model per run, or budget for a cold cache per switch |
missing-breakpoint |
Prefix is byte-stable and big enough to cache, but no cache_control marker was sent and nothing was cached |
Add a cache breakpoint |
Each detected breaker comes with the evidence span from your trace, the first
call it appears at, and est_recovered_usd — what you actually paid minus the
run re-simulated with only that breaker repaired (positive = money the fix
recovers). model-switch and history-rewrite have no mechanical repair
(rewriting your content or model would change semantics), so no dollar
estimate is attached to them — the report says "recovery estimate
unavailable" rather than printing a number the fix couldn't deliver.
How the simulator works
The replay implements the provider's documented prompt caching rules (pricing
and cache constants are versioned data in tokenbill/pricing.py, sourced from
the published pricing doc,
verified 2026-09 and re-verified each release): caching operates on a
byte-identical prefix of the rendered request in the documented render order
tools → system → messages, per model (a cache entry written under one model is
cold for every other model); the 5-minute cache (TTL 300 s, refreshed on
read — a flagged assumption); a per-model minimum cacheable prefix (512–4096
tokens); cache writes at 1.25× base input; cache reads at 0.10× (0.025× on
claude-fable-5-1). Dated snapshot ids such as claude-haiku-4-5-20251001 are
priced as their base model.
Four scenarios, all priced:
- as-billed — ground truth from
usage. Exact. - no-cache — every input token at full price. What caching is saving you today.
- optimal-cache — the run's actual bytes replayed with an ideally placed breakpoint every call. The caching ceiling for the bytes as sent (repairing the bytes themselves is fixed-cache's job). Write premiums are counted retrospectively: an optimal policy knows the whole run, so it never pays the 1.25× premium for an entry nothing ever reads back — which also means optimal-cache can never cost more than no-cache.
- fixed-cache — optimal-cache after repairing the detected breakers. What the fixes above are worth. This minus as-billed is the headline dollar number.
How you know the simulator isn't making it up: whenever a trace's billed
usage shows real cache activity, the simulator compares its predicted cache
reads against the billed cache reads and prints the agreement ratio. On the
demo's well-behaved scenario the two must agree within rounding — CI enforces
this on every commit via the flagship test
(tests/test_demo_recovers_planted_waste.py), which also asserts each demo
scenario's planted waste is recovered exactly. Scenario semantics and the full
assumption table: DESIGN.md.
Trace format
JSONL, one API call per line, schema: "tokenbill/trace@1": run id, call
index, timestamp, model, system prompt, tool definitions, messages,
cache-breakpoint count, billed usage, stop reason. The recorder writes it; you
can also generate it from any logging you already have — the exact contract is
in docs/SPEC.md.
Limitations
- Anthropic-shaped traces only in v0.1. The schema is provider-neutral, but usage fields, cache rules, and pricing model the Anthropic prompt cache. Adapters welcome.
- Attribution is approximate (see above); billed totals are exact.
- The simulator models the documented rules, not undocumented server behavior — no eviction under load, no regional effects, no concurrency races. The agreement check surfaces divergence when the trace has real cache activity to compare against.
- No live proxy yet. Recording is in-process via the SDK wrapper;
tokenbill analyzeis post-hoc. - The demo data is synthetic and labeled as such in the report. It certifies the instruments, not any real agent.
Roadmap
- OpenAI adapter (usage-field mapping + their cache semantics).
- A recording proxy, so anything speaking HTTP can be traced without SDK integration.
- Claude Code session-log importer.
- 1-hour-TTL cache scenarios.
- Batch-pricing awareness (batch discounts change what "waste" is worth).
Related work
- Provider usage dashboards (Anthropic Console, OpenAI usage page) show spend totals by model and day — indispensable for what you spent, silent on why. No per-call waterfall, no counterfactual, no fix.
- LangSmith / Langfuse / W&B Weave-style agent observability are excellent at traces: spans, latencies, token counts, prompt playgrounds. They treat cost as an attribute to display; none replays your run under the provider's cache rules, measures re-sent-prefix redundancy, or prices a specific fix. Token Bill is deliberately narrow: cache economics, with receipts.
- Anthropic's prompt-caching docs and token-counting endpoint define the rules Token Bill implements. The docs tell you how to cache; Token Bill tells you why your cache hit rate isn't what the docs promised — from your own trace.
Contributing
See CONTRIBUTING.md — dev setup is uv plus nothing, and
docs/SPEC.md is the authoritative internal contract. Security
policy in SECURITY.md; design rationale and threats to validity
in DESIGN.md; release history in CHANGELOG.md.
MIT © 2026 Token Bill contributors — see LICENSE.
1 maintainer

Metadata
1 maintainer
Release files for tokenbill 0.1.2
For a detailed explanation of source distributions (sdists) and built distributions (wheels), please see the package formats documentation.
Source distribution (sdist)
| File | Size | Uploaded | |
|---|---|---|---|
| tokenbill-0.1.2.tar.gz | 793.4 kB | Details |
Built distribution (wheel)
| File | Interpreter | ABI | Platform | Reset |
|---|---|---|---|---|
| tokenbill-0.1.2-py3-none-any.whl | Python 3 | none | any | Details |
Total release size: 854.0 kB
Release files / tokenbill-0.1.2.tar.gz
| Download URL | tokenbill-0.1.2.tar.gz |
|---|---|
| Size | 793.4 kB |
| Tags | Source |
|
SHA-256 checksum How to use checksums |
c4c7821fd0aad39cc15ebff3769a3309801658bbf619a93b2469c08724a3f4e2
|
|
BLAKE2b-256 checksum How to use checksums |
f343505b752e8fe3cc7bc9e3fc92eaaadb3512d88c8d80518b36b9c151d884ef
|
| Upload date | |
|
Uploaded using Trusted Publishing? What is trusted publishing? |
Yes |
| Uploaded via |
twine/7.0.0 CPython/3.13.14
|
Provenance
Provenance describes where a file came from. On PyPI, provenance is shared via attestations, which provide a verifiable record of the build or publishing details. View details, limitations and caveats.


PyPI Publish Attestation
PyPI verified that this artifact, at this checksum, originated from the publisher listed below.
Signed by GitHub Actions, verified by PyPI on Sep 13, 2026.
Transparency logRelease files / tokenbill-0.1.2-py3-none-any.whl
| Download URL | tokenbill-0.1.2-py3-none-any.whl |
|---|---|
| Size | 60.6 kB |
| Tags | Python 3 |
|
SHA-256 checksum How to use checksums |
589f8f2171de4c48f61ddf50bc16efaa66e3e9efca1bafc04060410144099971
|
|
BLAKE2b-256 checksum How to use checksums |
a1a9addc4d7b281393cc58a00703c78996c7a7e4536193f68581bb5dc85944b9
|
| Upload date | |
|
Uploaded using Trusted Publishing? What is trusted publishing? |
Yes |
| Uploaded via |
twine/7.0.0 CPython/3.13.14
|
Provenance
Provenance describes where a file came from. On PyPI, provenance is shared via attestations, which provide a verifiable record of the build or publishing details. View details, limitations and caveats.
PyPI Publish Attestation
PyPI verified that this artifact, at this checksum, originated from the publisher listed below.
Signed by GitHub Actions, verified by PyPI on Sep 13, 2026.
Transparency log













