
tokenol


Audit Claude Code JSONL session logs for cost, cache health, context blow-ups, and 5-hour rate-limit pressure.
tokenol parses the session transcripts that Claude Code writes to ~/.claude*/projects/**/*.jsonl and produces per-day, per-session, per-project, and per-model rollups — plus a live burn-rate view for the active 5-hour window.
Why tokenol
Claude Code bills you for everything the model reads — input, output, and cache creation/reads. When the prompt cache is working, 95%+ of your context tokens cost a tenth of full input price. When it isn't — idle gaps past the 5-minute TTL, context compaction, two sessions in the same repo thrashing each other — the same conversation can cost 10× more without looking any different.
tokenol tells you which sessions, projects, and hours did that, and usually why. It also splits each turn's cost across the tools that drove it — so you can see which tools (Read, Bash, MCP servers, …) eat spend, in which projects, on which models. You run it locally over the JSONL logs Claude Code already writes; nothing is uploaded anywhere.
Dashboard
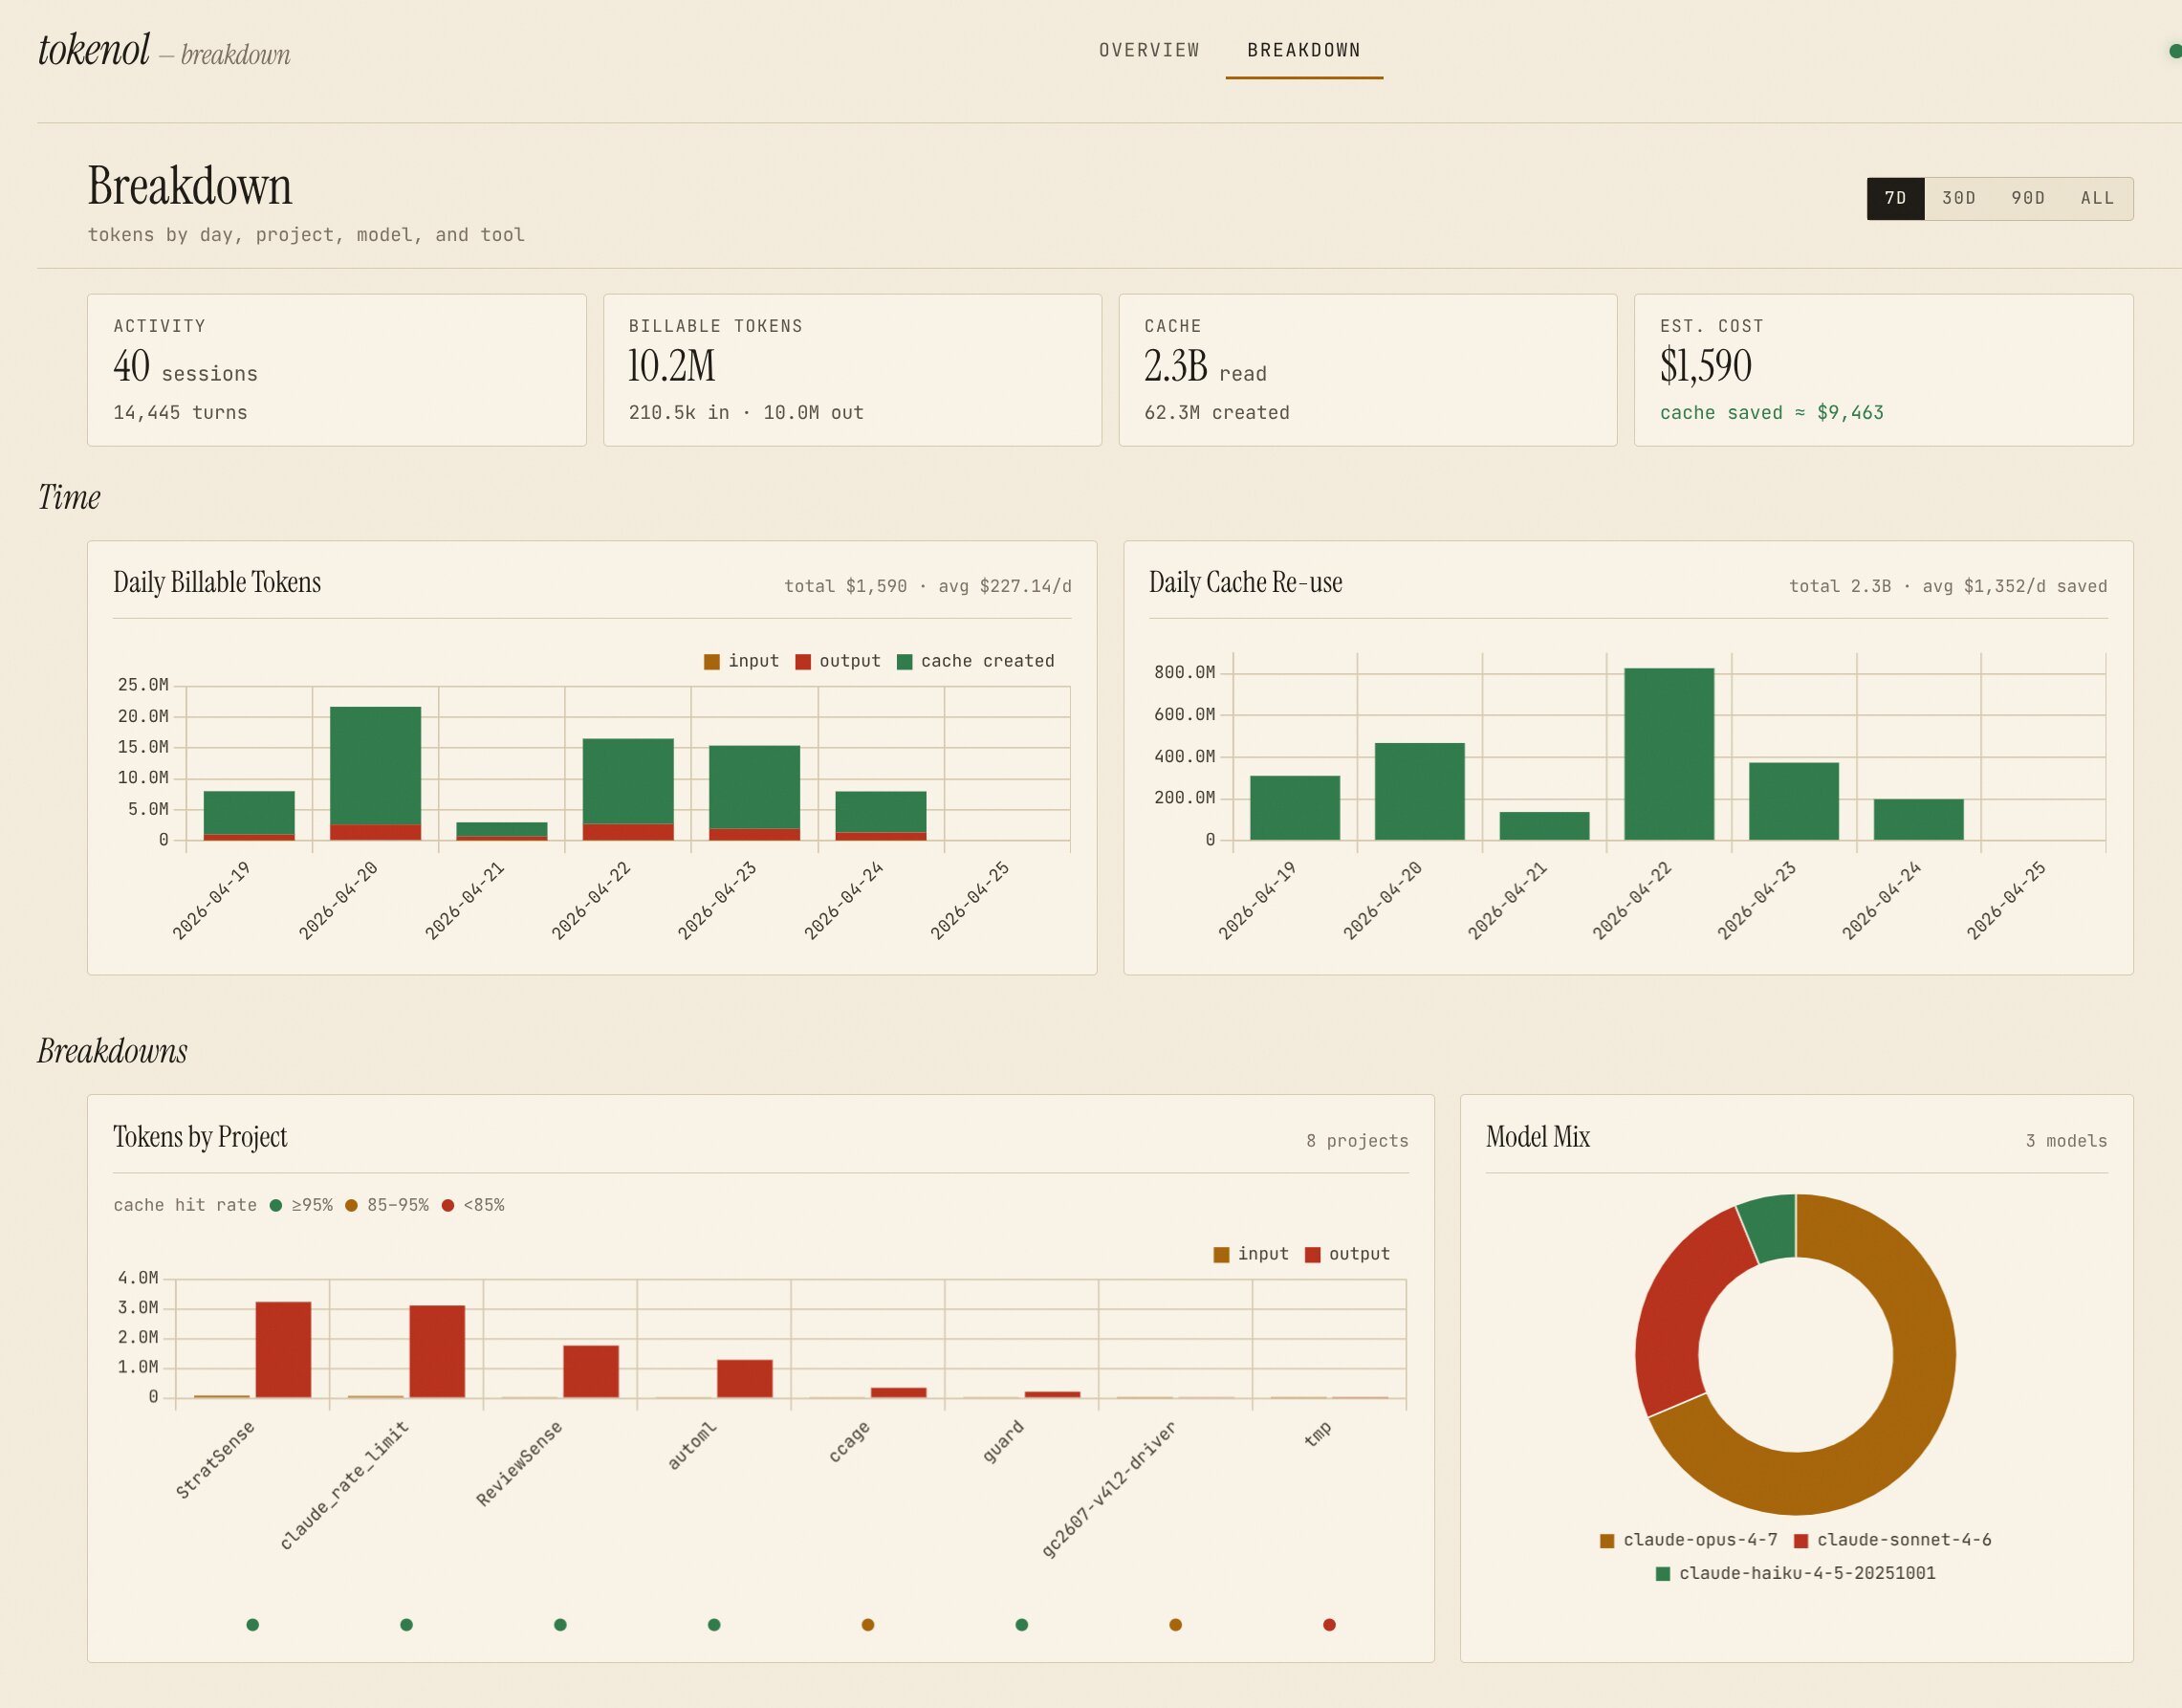
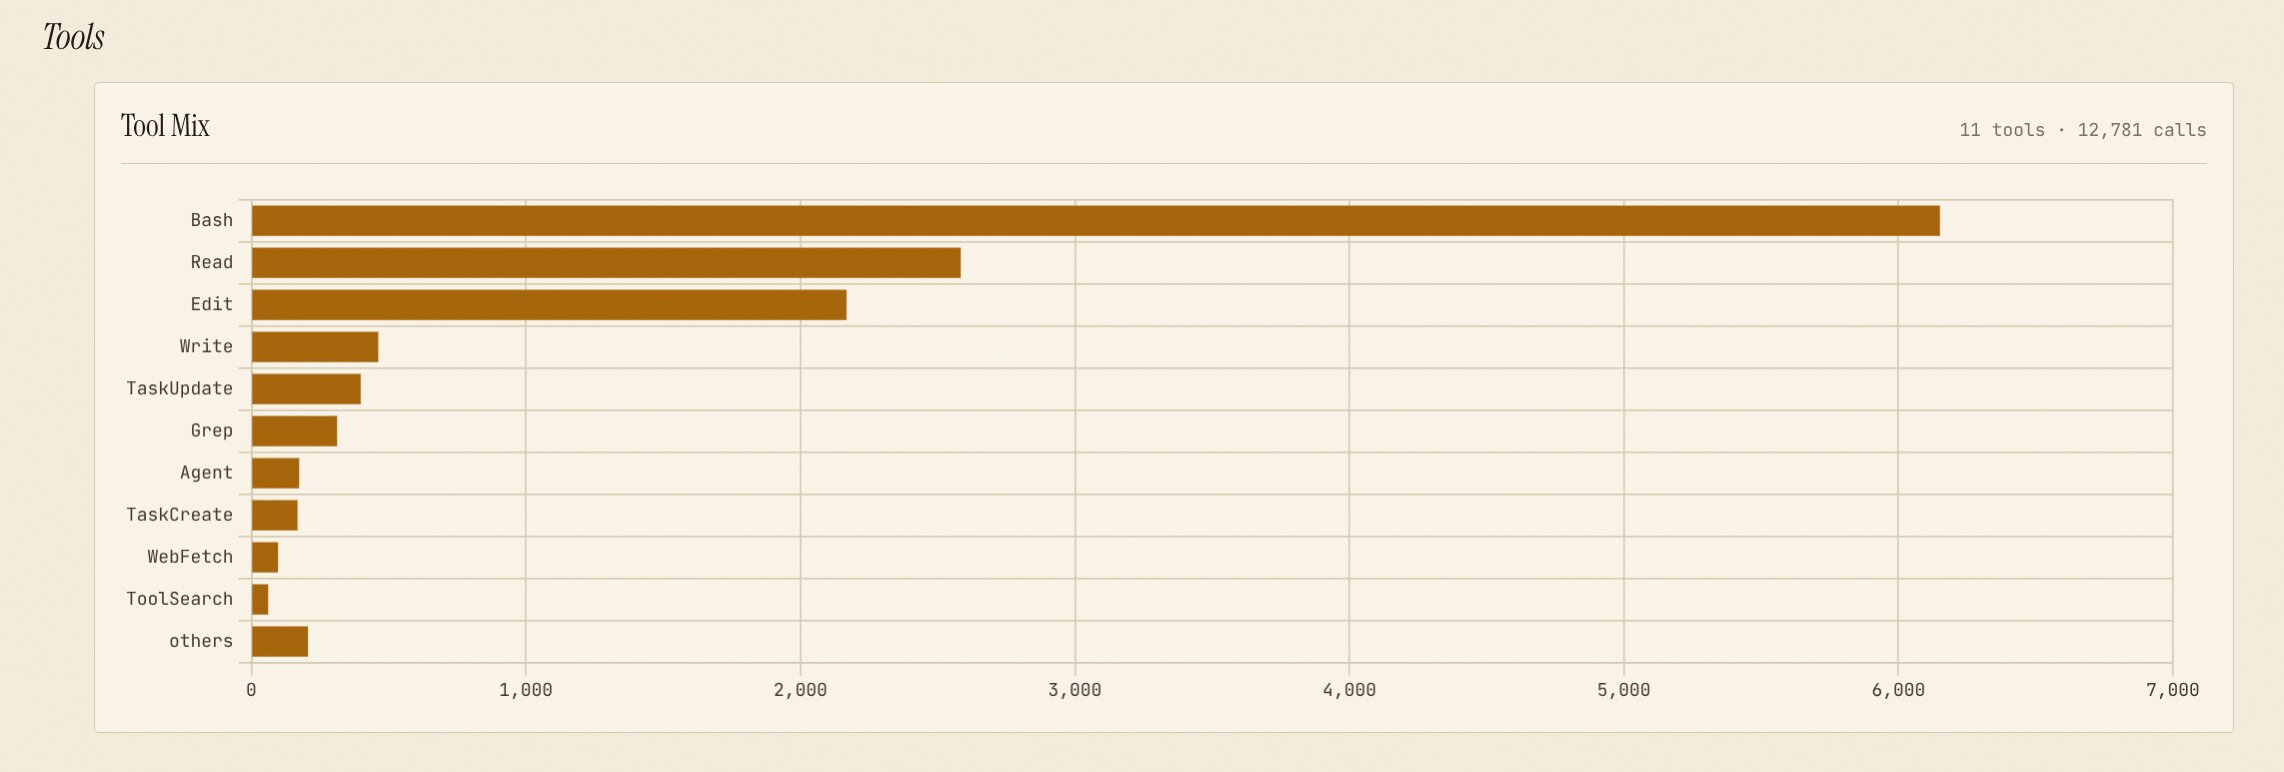
Breakdown page — daily work / cache trends plus four entity mixes (project · model · tool · skill) under one Breakdowns section, each row clicking through to a detail page. Daily Billable Tokens, Tokens by Project, Model Mix, Tool Mix, and Skill Mix each have a small TOKENS / $ toggle that swaps token counts for actual cost without a roundtrip; the Tool Mix and Skill Mix subheadings also report their share of the whole (% of total spend in $, % of billable tokens under TOKENS — the two differ because $/token isn't uniform). Tool Mix in $ mode additionally exposes a PRO-RATA / EXCL CACHE-READ attribution toggle that controls whether cache_read_usd is split across visible tools by byte share or routed entirely to a non-tool residual. Every panel carries a small ⓘ with a plain-language note on what it does and doesn't measure (per-tool and unrecognised-model costs are estimates; Skill Mix excludes un-skilled work, so it won't sum to the total):
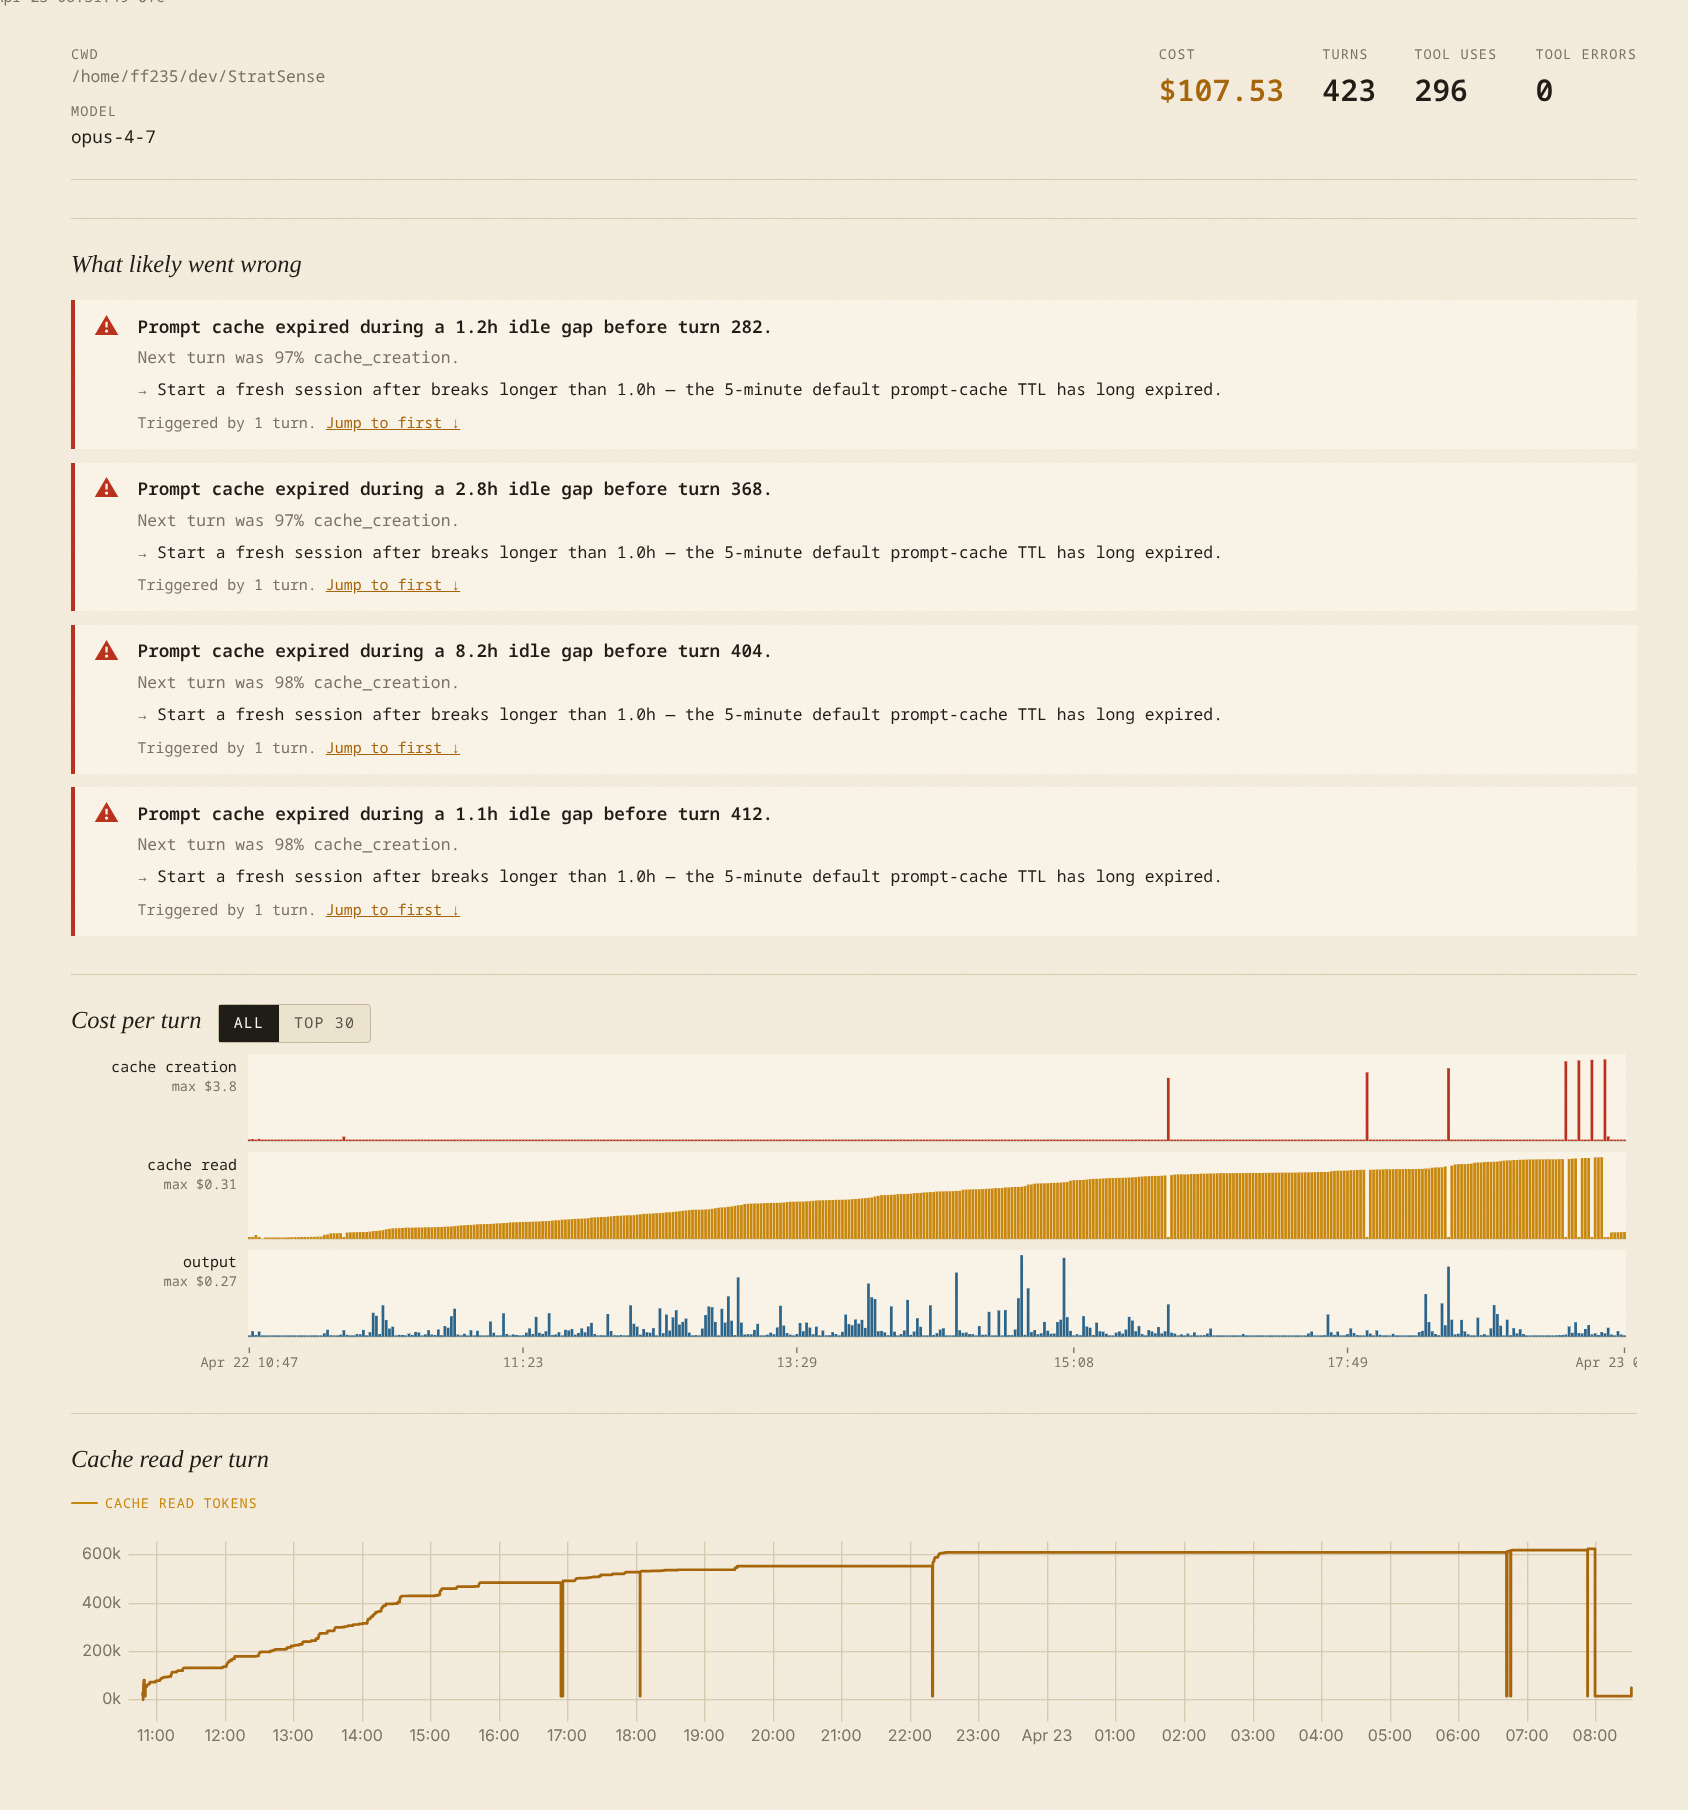
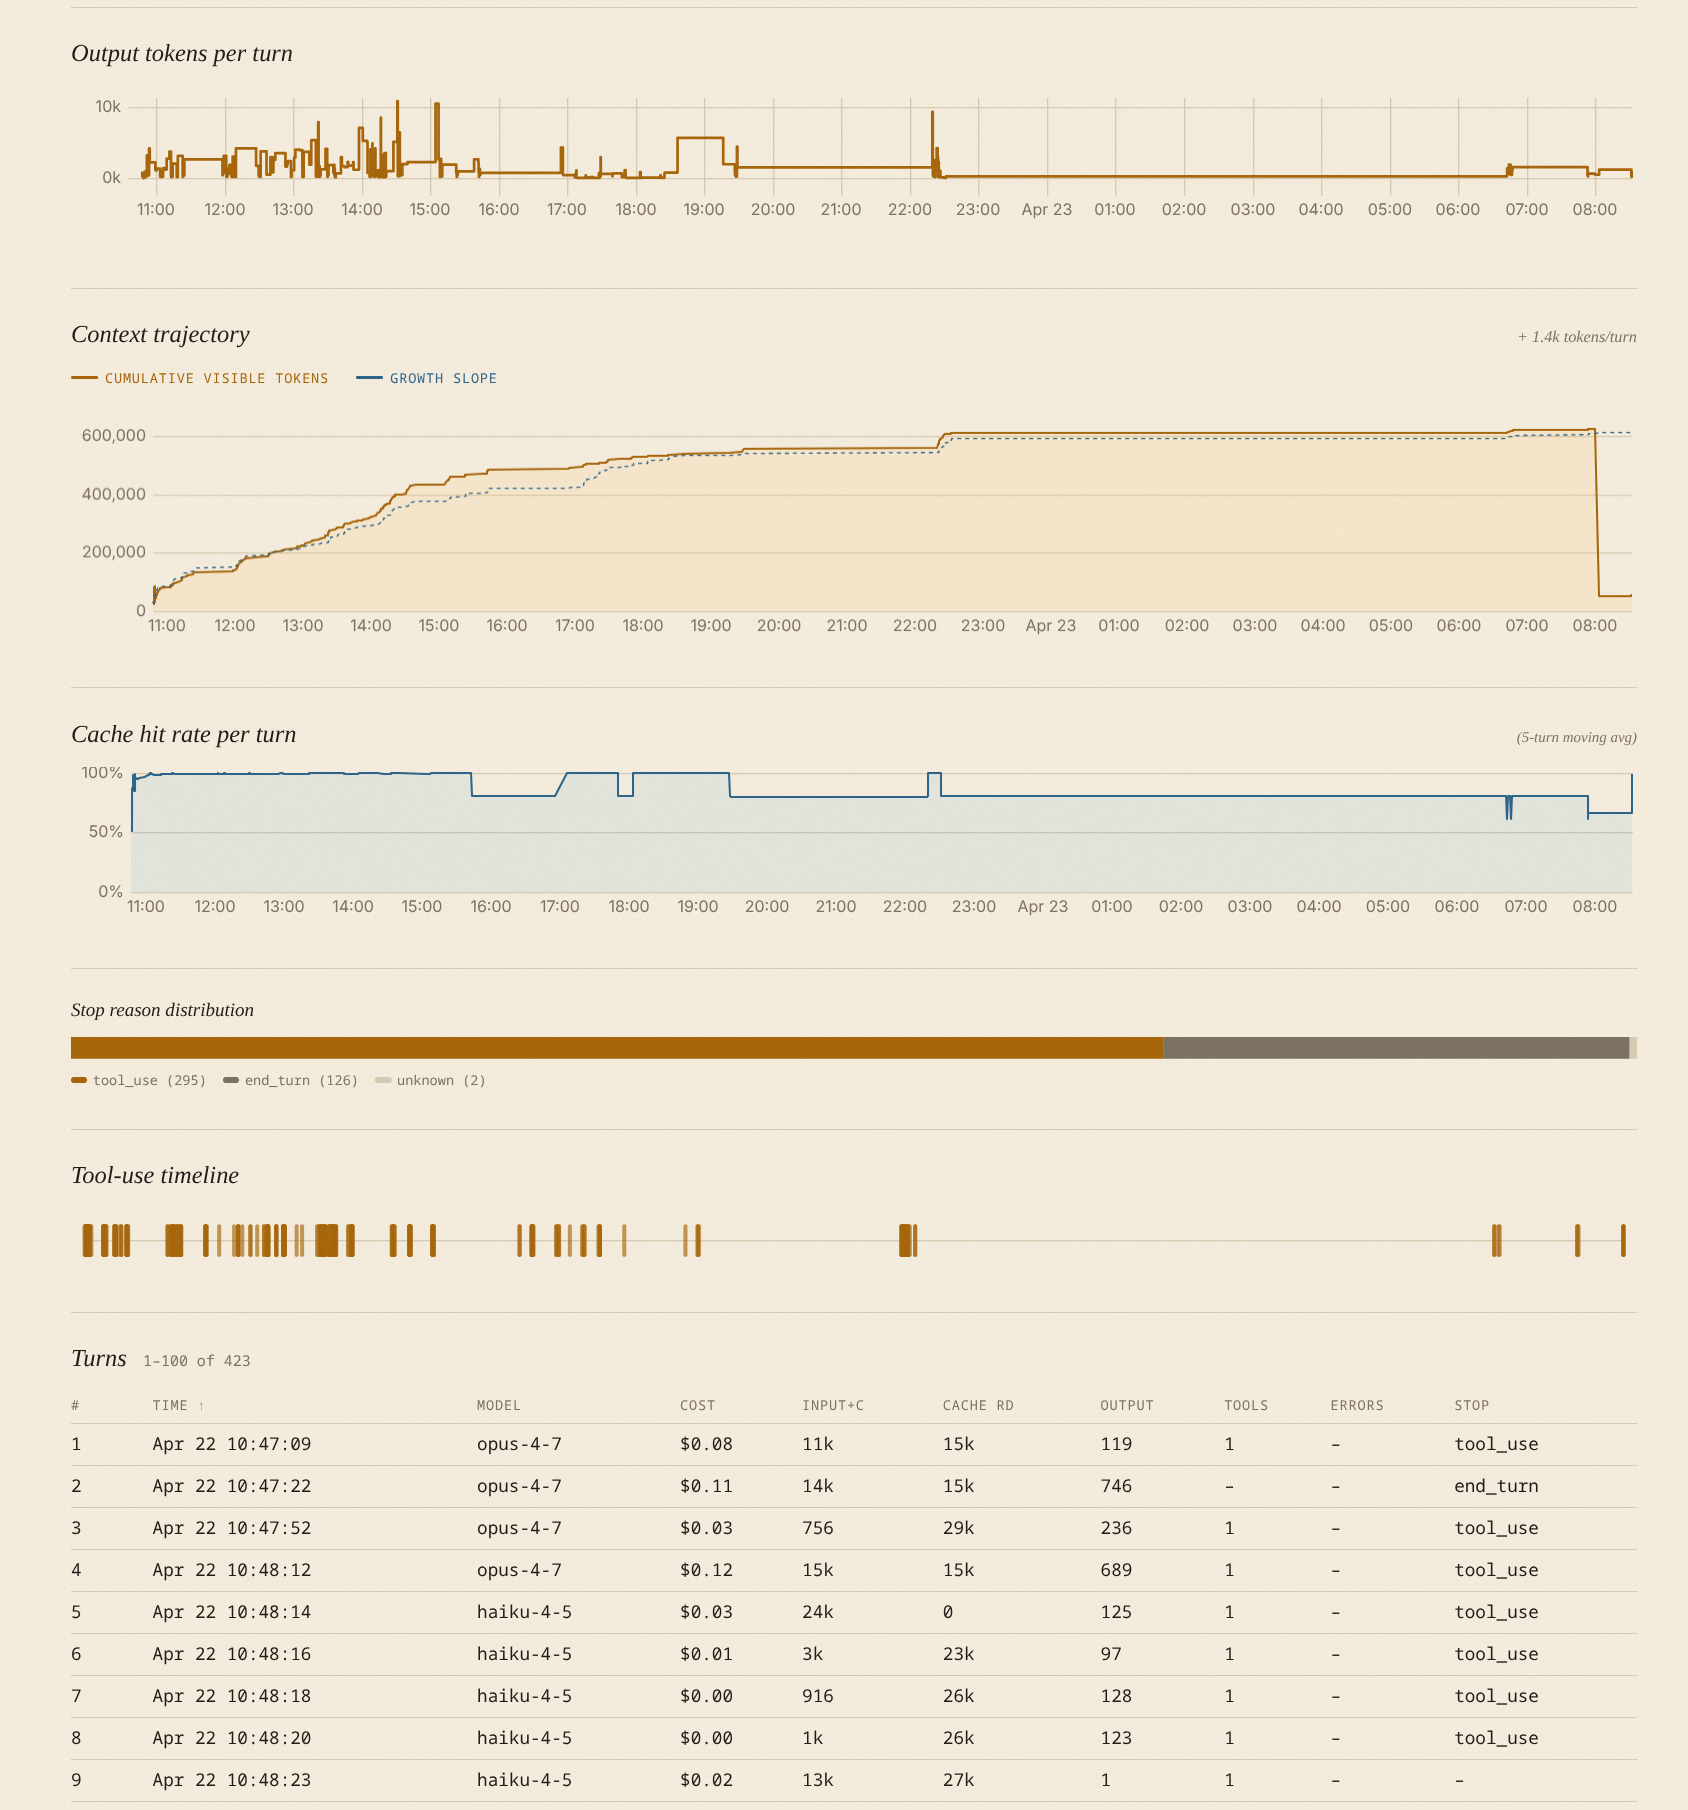
Session drill-down — pattern detection + cost-per-turn small multiples:
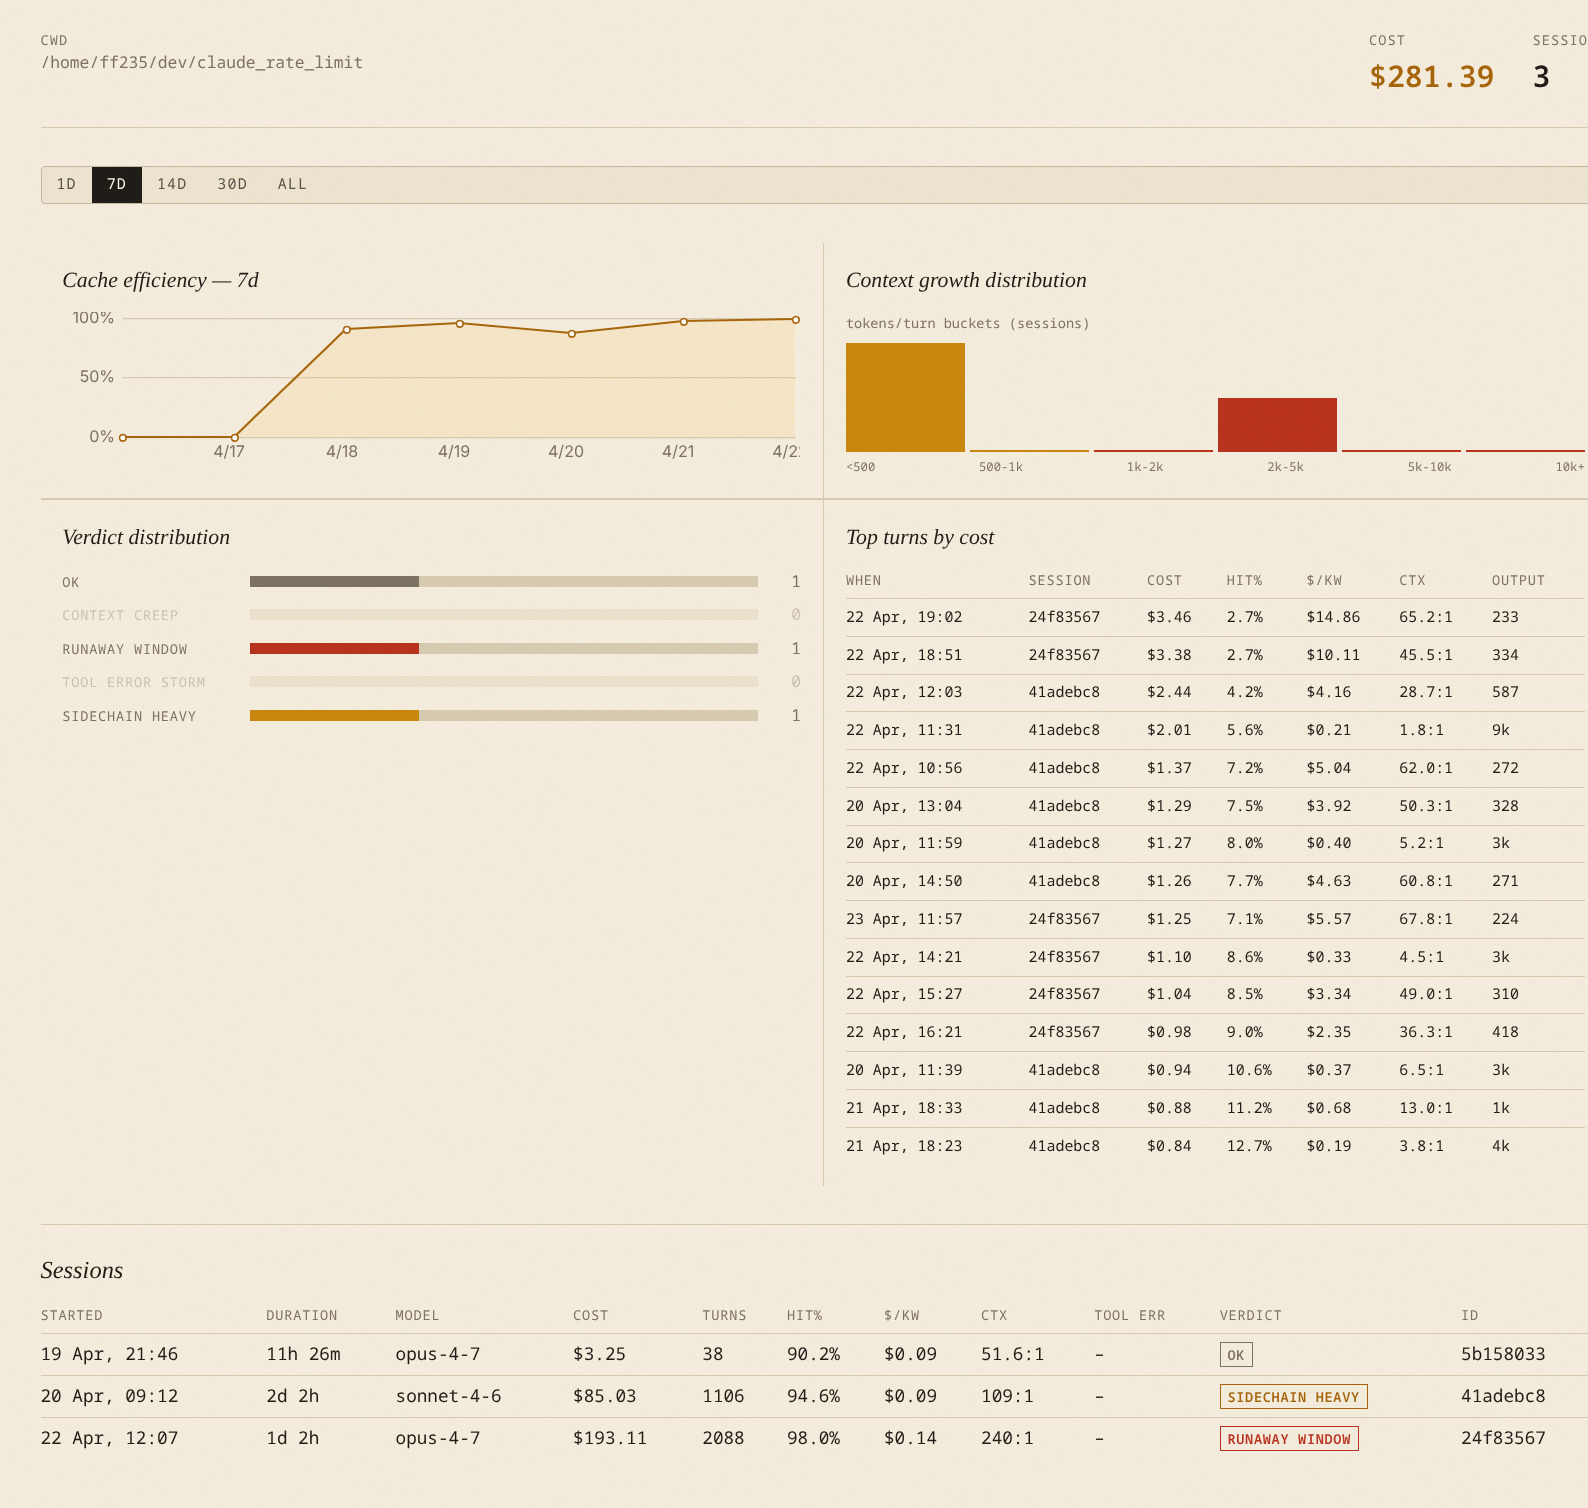
Project page — cache efficiency trend, verdict distribution, top turns, and cost-by-tool / cost-by-skill:
Install
pip install tokenol                        # CLI commands (daily, sessions, projects, ...)
pip install 'tokenol[serve]'               # adds the live dashboard (tokenol serve)
pip install 'tokenol[serve,persist]'       # adds DuckDB-backed history that survives JSONL deletion
Requires Python 3.10+. See tokenol on PyPI.
Quick start
# Daily token / cost aggregates over the last 14 days
tokenol daily

# Hourly breakdown for today
tokenol hourly

# Top 10 most expensive sessions in the last 30 days
tokenol sessions --since 30d --top 10 --sort cost

# Per-project rollup
tokenol projects

# Live view: burn rate + projected end-of-window cost
tokenol live --last 20m
All commands scan every JSONL file under $CLAUDE_CONFIG_DIR (falling back to the standard ~/.claude* locations) and deduplicate turns using the same message.id:requestId compound key that ccusage uses.
Scanning multiple projects
If you use workspace isolation (one ~/.claude-<project> directory per repo, pointed at via CLAUDE_CONFIG_DIR):
-
CLI commands (
daily,sessions,projects, …) default to the currently-active project. Pass--all-projects(or-A) for a cross-project view:# Total spend across every project in the last 14 days tokenol daily --since 14d --all-projects # Which sessions cost the most, globally tokenol sessions --since 30d --top 10 -A
-
The dashboard (
tokenol serve) defaults to all projects —CLAUDE_CONFIG_DIRis ignored so the dashboard is never silently scoped to a single workspace. Pass--scopedto opt into single-project view.
You can also set CLAUDE_CONFIG_DIR to a colon- or comma-separated list of paths to scan a specific subset (CLI commands only).
Commands
| Command | What it shows |
|---|---|
daily |
Per-day tokens (input, output, cache read/creation), cost, turn count |
hourly |
Per-hour breakdown for a single day (defaults to today) |
live |
Active 5-hour window burn rate, recent-activity rate, projected final cost |
sessions |
Per-session detail table with blow-up verdict (RUNAWAY, CONTEXT_CREEP, …) |
projects |
Per-project rollup grouped by cwd |
models |
Per-model rollup with tool-use counts and error rates (--all-models to include non-Claude) |
verify |
Cross-check tokenol totals against ccusage --json (if installed) |
serve |
Launch a local browser dashboard with live burn-rate gauge and all panels |
Every command accepts:
--since 14d— lookback window (e.g.7d,30d, or an ISO date)--all-projects/-A— scan every~/.claude*directory (ignoresCLAUDE_CONFIG_DIR)--strict— exit non-zero if any cost-computation assumption fired--show-assumptions— always print the assumption footer--log-level debug|info|warning
tokenol models accepts --all-models to include non-Claude providers (DeepSeek, Qwen, GLM, etc.) in the count.
tokenol sessions additionally takes --sort (cost, input, output, cache_read, turns, max_input, duration) and --top.
tokenol live takes --last 20m|2h|30s and exits non-zero if the projected window cost exceeds the configured reference.
Live dashboard
# Install with dashboard dependencies
pipx install 'tokenol[serve]'

# Start the dashboard (binds to http://127.0.0.1:8787)
tokenol serve

# Scope to the currently-active project (honor CLAUDE_CONFIG_DIR); faster tick, custom reference threshold
tokenol serve --scoped --tick 2s --reference 25

# Open browser automatically
tokenol serve --open
The dashboard updates via SSE as Claude Code writes events to disk. The server gates rebuilds on JSONL file changes — when no files have changed, it idles at near-zero CPU and forces a refresh at most once a minute (so time-windowed panels like Recent Activity don't drift more than ~60 s from wall clock). Multiple browser tabs share a single producer, so opening more tabs does not multiply server cost.
If SSE delivery silently stalls (browser tab throttling, extension hooks, long-lived EventSource quirks), the client self-heals: it polls /api/snapshot every 30 s as a backstop, force-reconnects on tab-visibility return, and runs a 90 s staleness watchdog. /api/snapshot reuses the broadcaster's cached payload while an SSE group is live, so the backstop costs only a JSON serialize. Hover the live-status dot for a "last update Ns ago" indicator.
Persistent history (opt-in)
By default, tokenol serve parses your ~/.claude*/projects/**/*.jsonl files into an in-memory model on each restart — fast, but the dashboard loses any session whose JSONL has been deleted or rotated.
Pass --persist to enable a DuckDB-backed history store at ~/.tokenol/history.duckdb (override with TOKENOL_HISTORY_PATH). The store contains no message content — only token counts, costs, models, timestamps, tool counts, and session metadata, comparable to a billing receipt. With persistence on:
- Deleting a JSONL no longer drops it from the dashboard. Quantitative panels render as before; only the per-turn modal's verbatim content snippets become unavailable, indicated by an "Archived — text snippets unavailable" badge. Metrics survive; words don't (matching the privacy intent of the deletion).
- Restart picks up where you left off. A background flusher batches writes (every 30 s or 100 turns, whichever first) and force-drains on graceful shutdown. The JSONLs remain the durable substrate — a process crash mid-flush loses nothing because the next start re-derives the missing window from the JSONLs (idempotent on
message.id:requestId). - Cold start stays bounded. The hot tier loads only the last
hot_window_daysof turns (default 90, tunable via/api/prefs); older history is read on demand from the warm tier. A turn already in the store is never re-derived from its transcript, whatever its age. - A restart re-reads only what changed. Per-file parse marks are kept in
~/.tokenol/parse-marks.json(one entry per transcript), so an unchanged file costs astat()rather than a full parse. A mark is written only once the flusher confirms that file's turns are in the store, so a crash can never leave a mark that outruns the data — the file is simply re-read next time. Delete the file to force a full re-read; an empty store makes the server discard it automatically. Marks are used only under--persist, since a plainservehas no writer and skipping a file would drop its turns.
Measured on the author's full ~/.claude* corpus — 5,120 transcript files, ~6.5 GB of JSONL, 385k persisted turns, 218 MB store (2026-09-07):
--persist, first start |
--persist, later starts |
|
|---|---|---|
| Time to first request served | ~2 min | ~17 s |
| Resident, peak | ~1.4 GB | ~1.3 GB |
| Resident, steady | ~1.2 GB | ~1.2 GB |
| Durable disk | ~220 MB after backfill | grows incrementally |
Default mode (no --persist) stays lighter than either column — it holds only what the transcripts on disk contain — but it reports "all the history that happens to survive" rather than all the history. The figures above are a full corpus; a smaller one scales down roughly linearly.
Requires the persist extras (pip install 'tokenol[serve,persist]').
See docs/superpowers/specs/2026-05-03-opt-in-persistence-design.md for design rationale and docs/superpowers/specs/2026-05-02-persistent-history-design.md for the underlying store design.
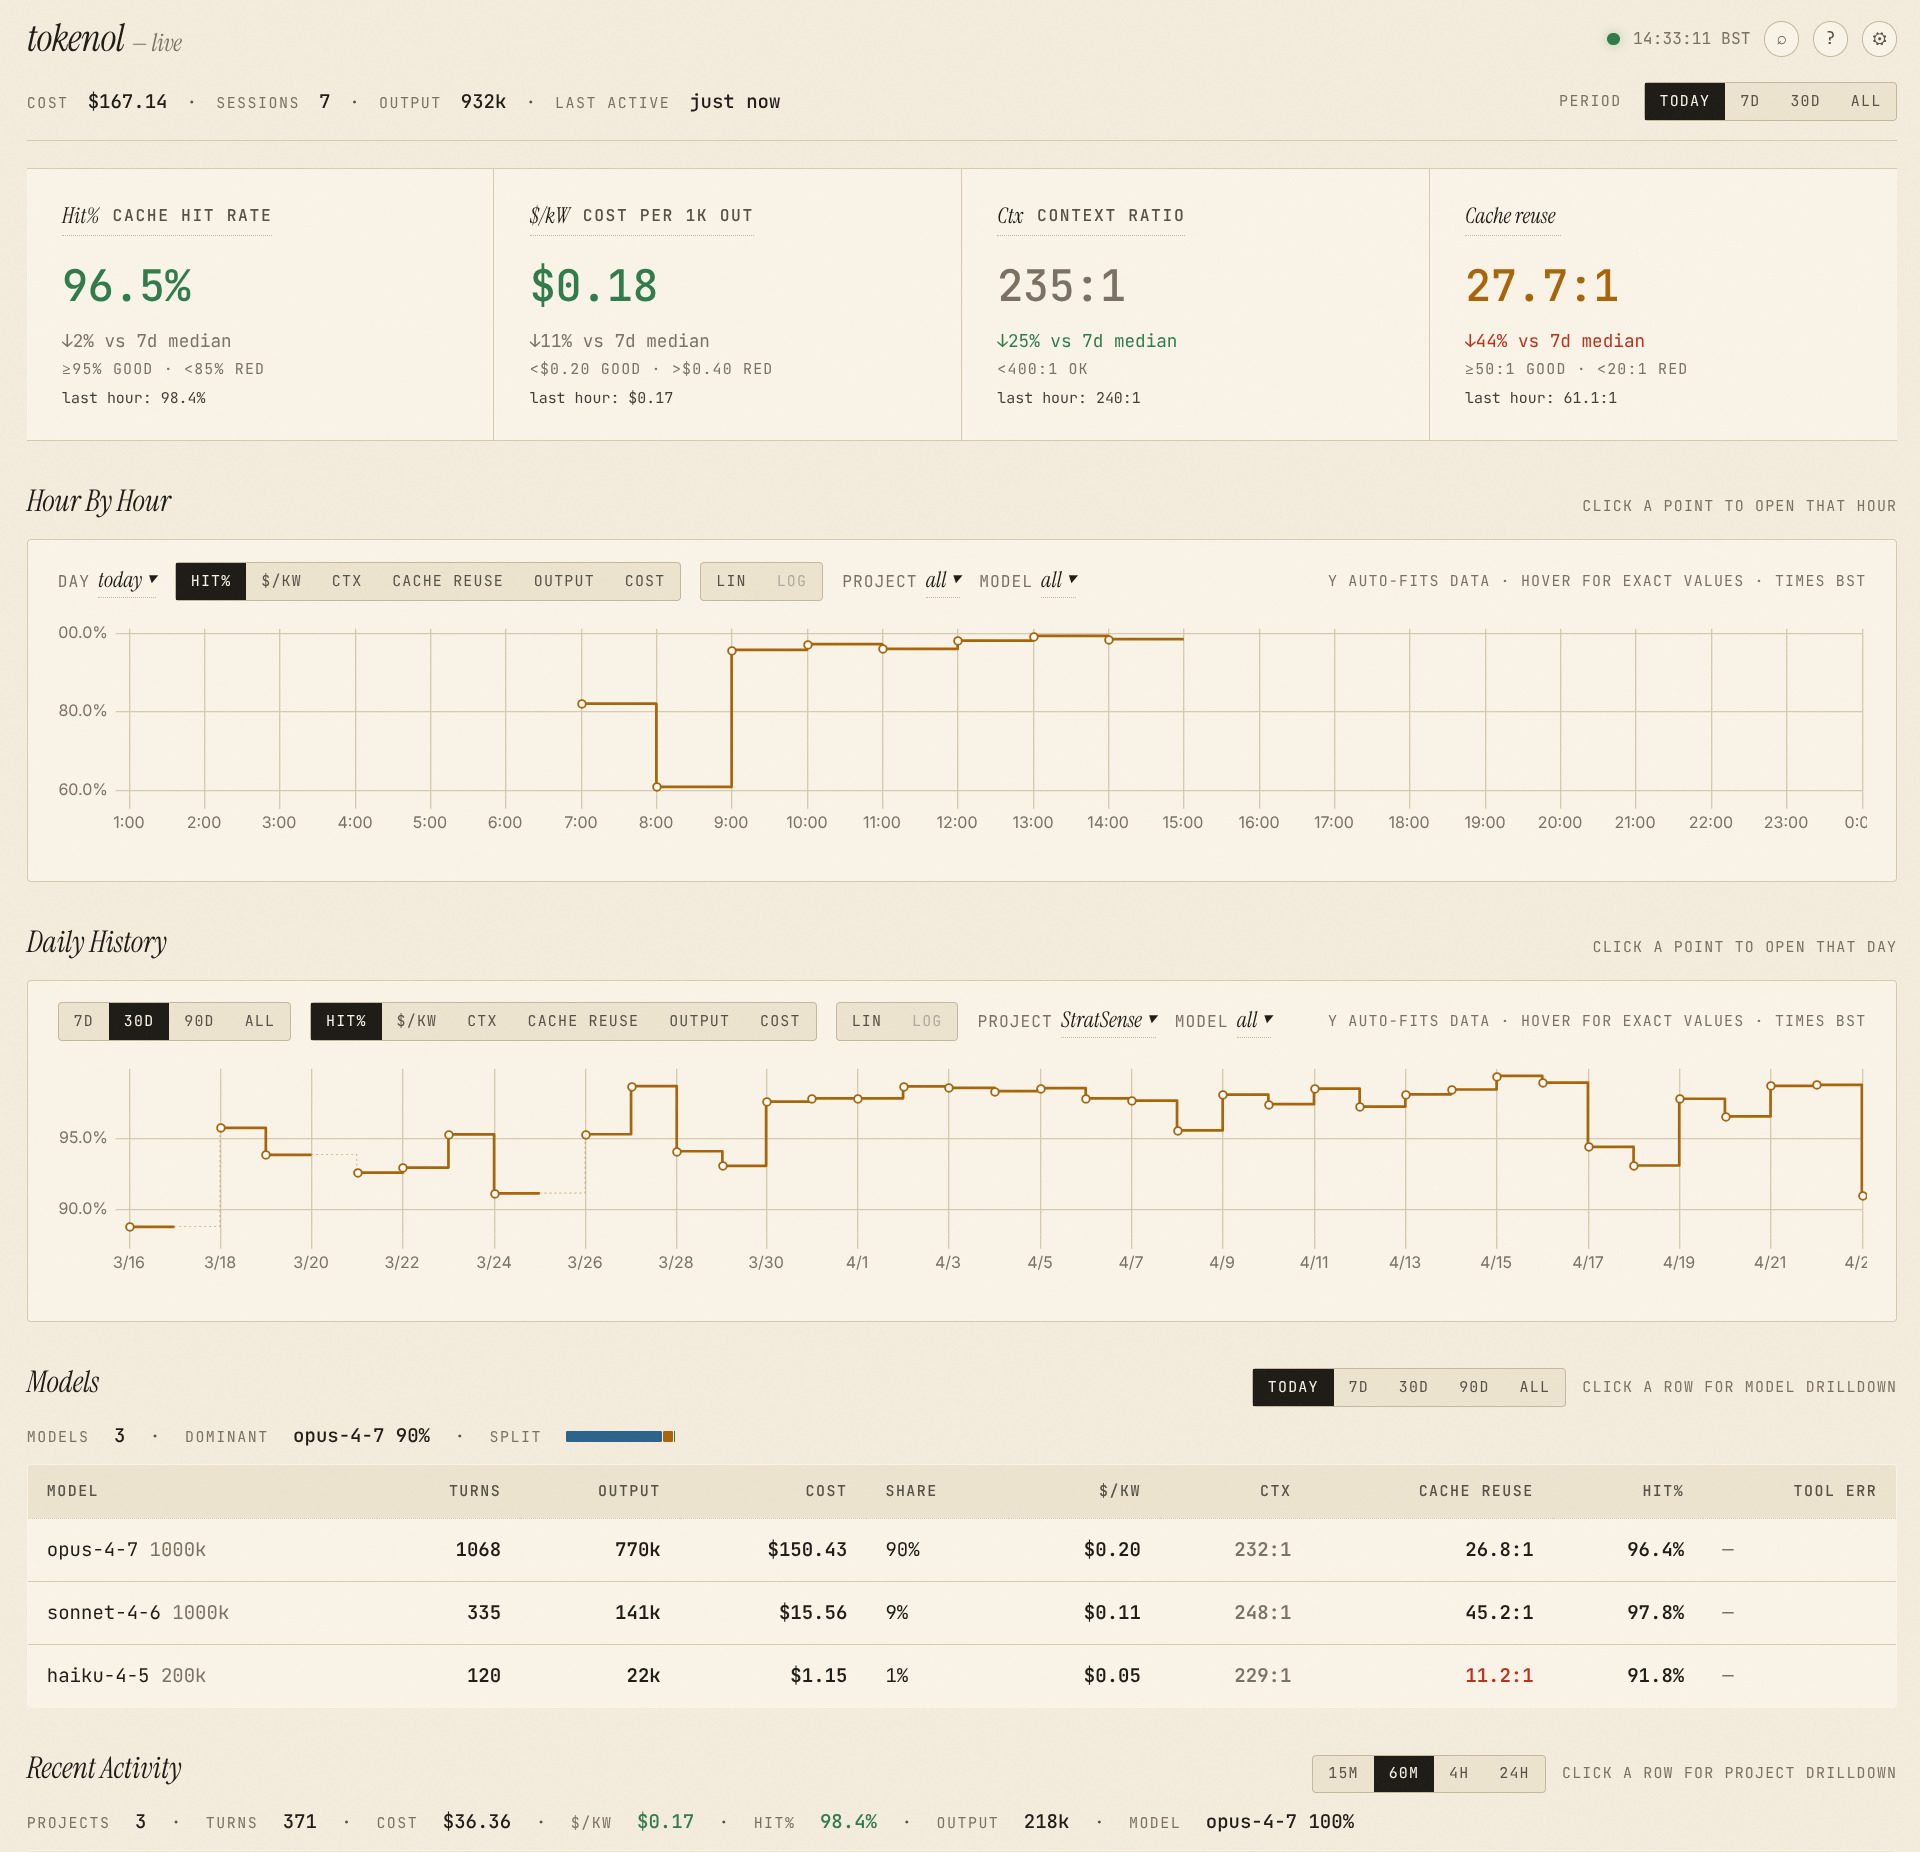
Main dashboard
Main page layout (top to bottom):
| Panel | What it shows |
|---|---|
| Topbar | Today's cost · sessions · output · last-active time; global period selector (Today / 7D / 30D / All) |
| Efficiency tiles | Hit% · $/kW · Ctx · Cache reuse — each with a delta chip vs 7-day median and colour-coded threshold |
| Hour By Hour | Hourly metric timeline with day-picker, metric pills, project/model filters, click-to-drilldown, and an optional compare overlay to put a second metric on the right y-axis |
| Daily History | 30-day metric history with 7-day moving average overlay; range pills (7D / 30D / 90D / All); same dual-metric compare as above |
| Models | Per-model cost, turns, output, and efficiency metrics; local range override; click row → /model/<name> |
| Recent Activity | Active projects in the last 60 min with Ctx used, $/kW, hit%, verdict; sortable; click row → /project/<cwd> |
Keyboard shortcuts: ? Glossary · / Find · , Settings · Esc close/back · g t scroll to top · ↑↓ Enter table row navigation · ← → chart cursor.
Efficiency metric glossary
| Metric | Definition | Target |
|---|---|---|
| Hit% | cache_read / (cache_read + cache_creation + input) |
≥ 95% |
| $/kW | cost × 1000 / output_tokens — dollars per 1k output tokens |
< $0.20 |
| Ctx | cache_read / output as N:1 — context tokens read per output token |
< 400:1 |
| Cache reuse | cache_read / cache_creation as N:1 — low = cache thrashing |
> 50:1 |
| Ctx used | Latest turn's visible context ÷ model context window | < 85% |
Preferences
User preferences (gate-poll cadence and threshold overrides) are saved to:
$XDG_CONFIG_HOME/tokenol/prefs.json # default: ~/.config/tokenol/prefs.json
Shape:
{
  "tick_seconds": 300,
  "reference_usd": 50.0,
  "thresholds": {
    "hit_rate_good_pct": 95,
    "hit_rate_red_pct": 85,
    "cost_per_kw_good": 0.20,
    "cost_per_kw_red": 0.40,
    "ctx_ratio_red": 400.0,
    "cache_reuse_good": 50.0,
    "cache_reuse_red": 20.0
  }
}
tick_seconds is how often the server stat-checks the JSONL files for changes (cheap). The full snapshot only rebuilds on a detected change or once per ~60 s heartbeat — so a long tick_seconds mainly reduces stat-syscall noise, not rebuild cost.
Reset to defaults via the Settings modal (POST /api/prefs {"thresholds": "reset"}).
Session drill-down
Click any session to open the drill-down page (/session/<id>). It shows:
-
What likely went wrong — automated pattern cards at the top of the page, each with a headline, the measurable signal that triggered it, and a suggested fix. Five patterns are detected:
Pattern Signal Idle expiry Gap ≥ 1 h between turns + next turn was ≥ 80% cache_creation — the 5-minute prompt-cache TTL expired Compaction re-inflation Visible-token count dropped then climbed back to ≥ 80% of the previous peak — compacting but immediately refilling the context Context ceiling plateau ≥ 20 consecutive turns at ≥ 90% of the model's context window — paying near-full-context input rates throughout Sidechain explosion Sidechain/task-agent work accounts for > 40% of session cost Tool error storm > 20% error rate across any 10-turn window -
Cost per turn — stacked bar chart (input / output / cache_read / cache_creation). Toggle "All" or "Top 30" to focus on the most expensive turns. Click any bar to open the per-turn detail modal.
-
Per-turn modal — cost component breakdown, token counts, tool call results (✓/✗), first 500 chars of the user prompt and assistant preview. Navigate with ← / → or close with Esc.
Per-tool cost attribution
Every assistant turn's cost is split across the tools it invoked, surfacing across the dashboard:
- Tool Mix panel (Breakdowns) — top-10 tools ranked by spend (or invocation count, via the
TOKENS / $toggle), anothertail row, and a dim italic__unattributed__row that surfaces residual cost so panel totals reconcile to overall spend. In$mode the panel also exposes a PRO-RATA / EXCL CACHE-READ attribution toggle:- Pro-rata (default) — distributes
cache_read_usdacross visible tools by the bytes those tools currently hold in the conversation window, alongsideinput_usdandcache_creation_usd. - Exclude cache-read — routes
cache_read_usdentirely into the non-tool residual instead. Answers "what do these tools cost if cache-read is treated as pure context overhead?" Selection persists inlocalStorage; the toggle is hidden in tokens mode (it's a cost-only concept).
- Pro-rata (default) — distributes
- Tool detail page (
/tool/<name>) — 30-day daily cost line chart, scorecards (Est. Cost · Output tokens · Invocations · Top project), plus cost-by-project and cost-by-model ranked bars. - Project and model detail pages — each gains a "Cost by tool" ranked-bar list.
How the split works. Each turn's four cost components are attributed by JSON byte share:
- Output side (
output_usd) — split acrosstool_useblocks emitted on the same turn by their JSON byte size. - Input side (
input_usd + cache_read_usd + cache_creation_usd, combined into a single input cost pool) — split acrosstool_use/tool_use_resultblocks still lingering in the conversation window from previous turns, by accumulated byte size.
Tools whose byte shares sum below 1.0 (because non-tool content like user prompts and assistant text also lives in the window) leave the residual as __unattributed__. Compaction is detected heuristically when the assistant's input token pool drops below 20 % of the session's running peak (COMPACTION_DROP_RATIO = 0.2 in src/tokenol/ingest/parser.py); when it fires, the per-session byte tallies reset, the input side of the detection turn flows entirely into __unattributed__ (no tool bytes remain in the window), and subsequent turns rebuild their per-tool tallies from scratch.
The per-tool data is dashboard-only — there is no tokenol tools CLI command. See docs/METRICS.md for the full attribution formula and the API surface (/api/breakdown/tools, /api/tool/<name>, plus the by_tool blocks on project and model endpoints).
Per-skill cost attribution
Claude Code tags every turn that runs under a skill — inline work and sidechain sub-agents alike — with an attributionSkill field, so skill cost is turn-level: a turn belongs wholly to one skill or to none, with no byte-share split. Surfaced across the dashboard:
- Skill Mix panel (Breakdowns) — top-10 skills ranked by spend (or invocation count, via the
TOKENS / $toggle), anothertail, and a+N started with no separate costfootnote for skills that ran but had no cost billed to them. Unlike Tool Mix there is no__unattributed__row: turns with no skill are simply excluded — the vast majority of interactive work runs under none — so the panel intentionally does not reconcile to overall spend. Its subheading reports the fraction that does run under a skill (~% of total spend in$, ~% of billable tokens underTOKENS). - Skill detail page (
/skill/<name>) — 30-day daily cost chart, scorecards (Est. Cost · Output tokens · Invocations · Top project), cost-by-model and cost-by-project ranked bars, and the headline inline vs sub-agent cost split. - Project and model detail pages — each gains a "Cost by skill" ranked-bar list, symmetric with cost-by-tool.
A skill's cost includes its sub-agent fan-out; nested skills (one skill triggering another) roll into the skill you launched; and skills used before Claude Code began emitting attributionSkill don't appear. Like the per-tool data it is dashboard-only, exposed via /api/breakdown/skills, /api/skill/<name>, and the by_skill blocks on project and model endpoints.
What it detects
For every session, tokenol computes a blow-up verdict against spec-defined thresholds:
| Verdict (table label) | Trigger |
|---|---|
RUNAWAY_WINDOW (runaway) |
Any 5-hour window costs ≥ $50 |
CONTEXT_CREEP (ctx-creep) |
Max single-turn input ≥ 500k and growth ≥ 2k/turn |
TOOL_ERROR_STORM (tool-errs) |
≥ 10 tool uses with > 30% error rate |
SIDECHAIN_HEAVY (sidechain) |
Sidechain session costing > $5 |
OK (ok) |
Everything else |
Daily efficiency columns
The tokenol daily report shows these cost/cache efficiency ratios:
| Column | Meaning | Target |
|---|---|---|
$/kW |
USD per 1,000 output tokens | < $0.20 |
Ctx |
Context tokens read per output token (N:1) | lower is better |
Cache reuse |
Cache reads per cache-creation token (N:1) | > 50:1 |
Hit% |
% of context served from prompt cache | ≥ 95% |
Pricing
Flat per-model rates (no 1M-token tier surcharge — matches ccusage's default behaviour). The current registry lives in src/tokenol/metrics/cost.py. When a turn's model isn't in the registry, tokenol records an UNKNOWN_MODEL_FALLBACK assumption tag and uses a conservative default; run with --show-assumptions or --strict to surface these.
See docs/METRICS.md for metric definitions and docs/ASSUMPTIONS.md for the full list of assumption tags.
Development
git clone https://github.com/farhanferoz/tokenol
cd tokenol
uv sync --extra dev
uv run pytest
uv run ruff check
Licence
MIT
1 maintainer

Metadata
1 maintainer
Release files for tokenol 0.8.3
For a detailed explanation of source distributions (sdists) and built distributions (wheels), please see the package formats documentation.
Source distribution (sdist)
| File | Size | Uploaded | |
|---|---|---|---|
| tokenol-0.8.3.tar.gz | 2.0 MB | Details |
Built distribution (wheel)
| File | Interpreter | ABI | Platform | Reset |
|---|---|---|---|---|
| tokenol-0.8.3-py3-none-any.whl | Python 3 | none | any | Details |
Total release size: 2.2 MB
Release files / tokenol-0.8.3.tar.gz
| Download URL | tokenol-0.8.3.tar.gz |
|---|---|
| Size | 2.0 MB |
| Tags | Source |
|
SHA-256 checksum How to use checksums |
0e57a9bff2fda1a20098e398ff2e9d9a82e428a48a7b9c5d838dba73d027041a
|
|
BLAKE2b-256 checksum How to use checksums |
95ccd2f5ae008e7edfd1bca39775305de1e22af04bb2808e5aeae577da2e78cb
|
| Upload date | |
|
Uploaded using Trusted Publishing? What is trusted publishing? |
No |
| Uploaded via |
uv/0.12.19 {"installer":{"name":"uv","version":"0.12.19","subcommand":["publish"]},"python":null,"implementation":{"name":null,"version":null},"distro":{"name":"Fedora Linux","version":"44","id":"","libc":null},"system":{"name":null,"release":null},"cpu":null,"openssl_version":null,"setuptools_version":null,"rustc_version":null,"ci":null}
|
Release files / tokenol-0.8.3-py3-none-any.whl
| Download URL | tokenol-0.8.3-py3-none-any.whl |
|---|---|
| Size | 195.4 kB |
| Tags | Python 3 |
|
SHA-256 checksum How to use checksums |
7d1a074e963edd584266dbfe288d018b523cb4ece40ce1bd2b86f83e47caed7d
|
|
BLAKE2b-256 checksum How to use checksums |
d0f704abe0a5ba03201805227fe1f9f8cc318b0b10f774e87a2a0d0eba45ded3
|
| Upload date | |
|
Uploaded using Trusted Publishing? What is trusted publishing? |
No |
| Uploaded via |
uv/0.12.19 {"installer":{"name":"uv","version":"0.12.19","subcommand":["publish"]},"python":null,"implementation":{"name":null,"version":null},"distro":{"name":"Fedora Linux","version":"44","id":"","libc":null},"system":{"name":null,"release":null},"cpu":null,"openssl_version":null,"setuptools_version":null,"rustc_version":null,"ci":null}
|














