
Audit Claude Code JSONL session logs: track cost, cache health, context blow-ups, and 5h-window pressure.

Project description
tokenol


Audit Claude Code JSONL session logs for cost, cache health, context blow-ups, and 5-hour rate-limit pressure.
tokenol parses the session transcripts that Claude Code writes to ~/.claude*/projects/**/*.jsonl and produces per-day, per-session, per-project, and per-model rollups — plus a live burn-rate view for the active 5-hour window.
Why tokenol
Claude Code bills you for everything the model reads — input, output, and cache creation/reads. When the prompt cache is working, 95%+ of your context tokens cost a tenth of full input price. When it isn't — idle gaps past the 5-minute TTL, context compaction, two sessions in the same repo thrashing each other — the same conversation can cost 10× more without looking any different.
tokenol tells you which sessions, projects, and hours did that, and usually why. It also splits each turn's cost across the tools that drove it — so you can see which tools (Read, Bash, MCP servers, …) eat spend, in which projects, on which models. You run it locally over the JSONL logs Claude Code already writes; nothing is uploaded anywhere.
Dashboard
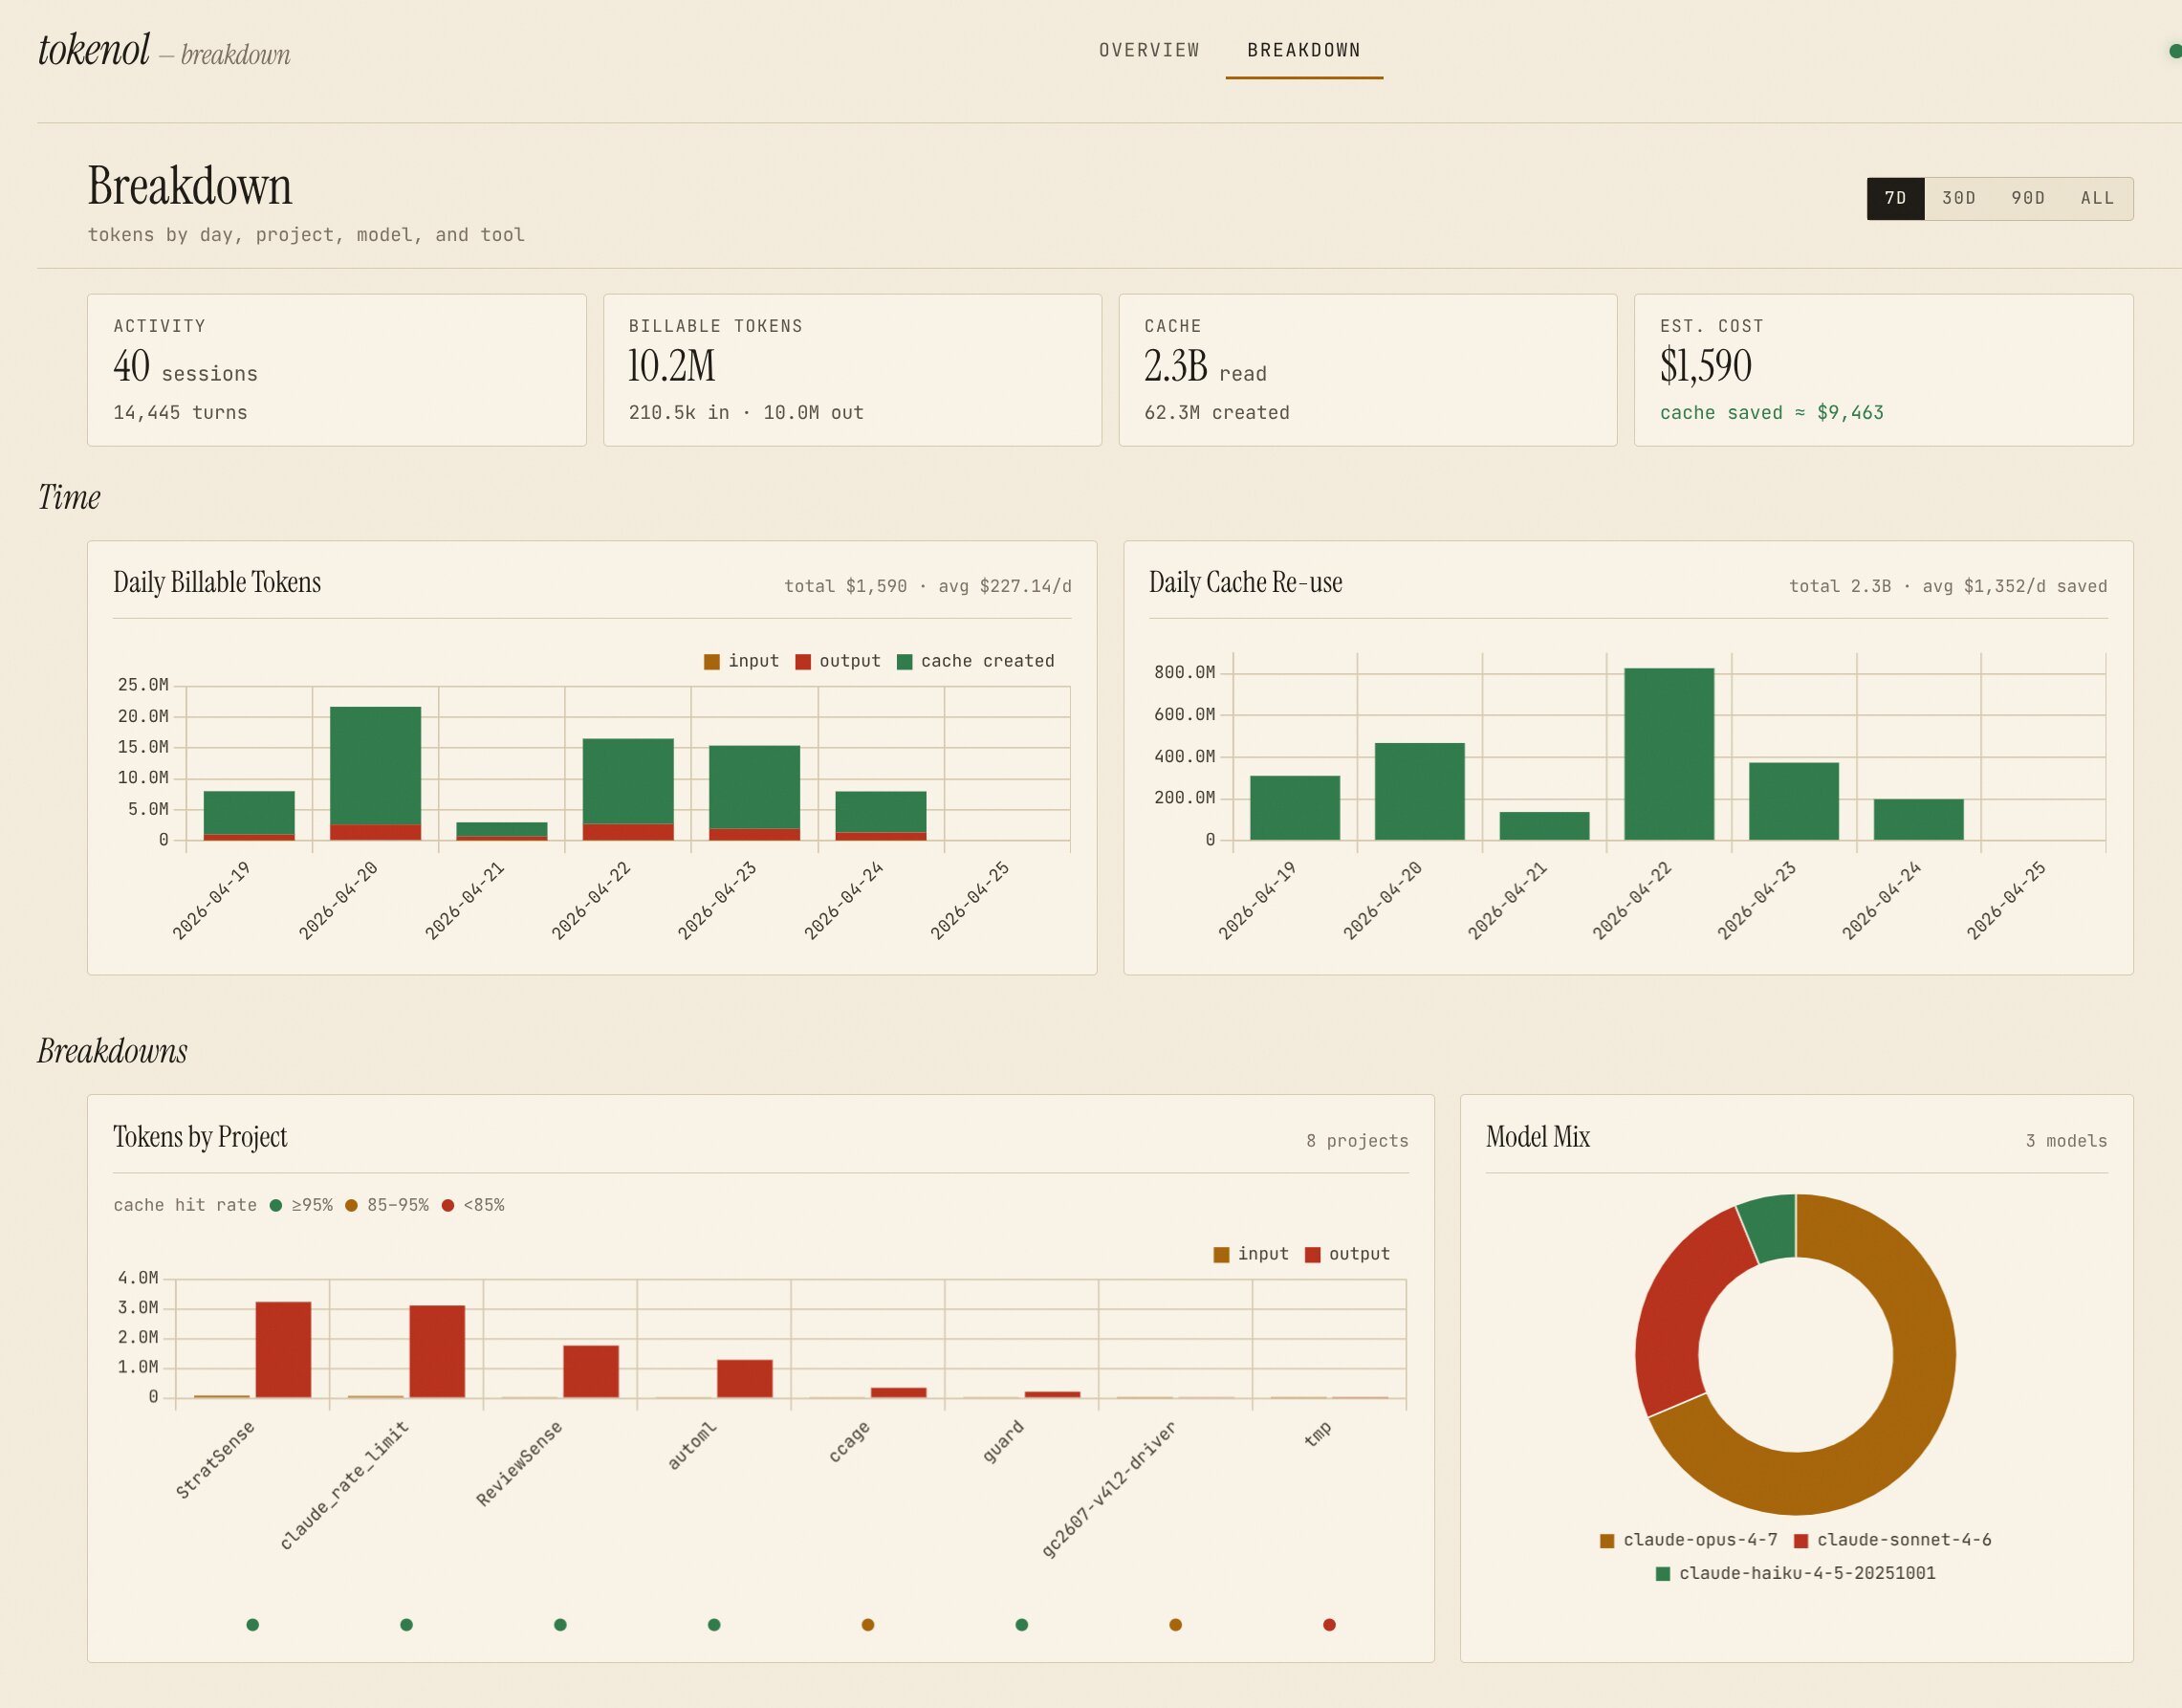
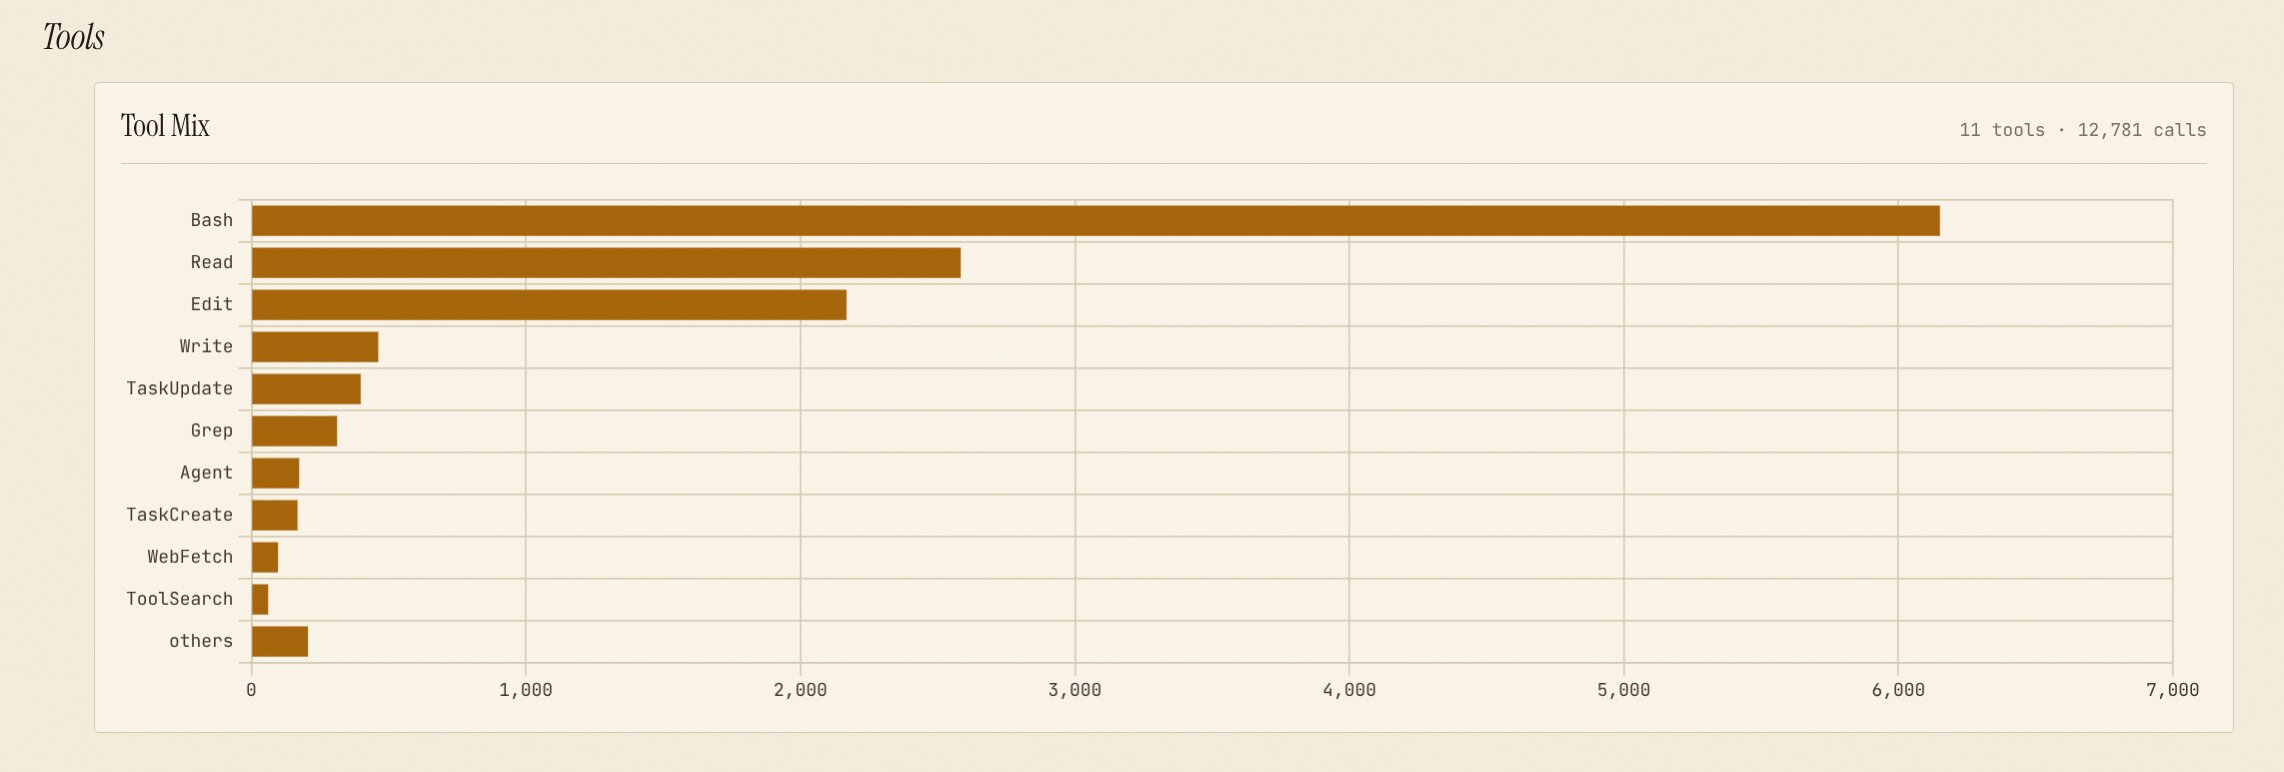
Breakdowns tab — daily work / cache trends, project · model · tool mix with click-through. Daily Billable Tokens, Tokens by Project, Model Mix, and Tool Mix each have a small TOKENS / $ toggle that swaps token counts for actual cost without a roundtrip. Tool Mix in $ mode also exposes a PRO-RATA / EXCL CACHE-READ attribution toggle that controls whether cache_read_usd is split across visible tools by byte share or routed entirely to a non-tool residual:
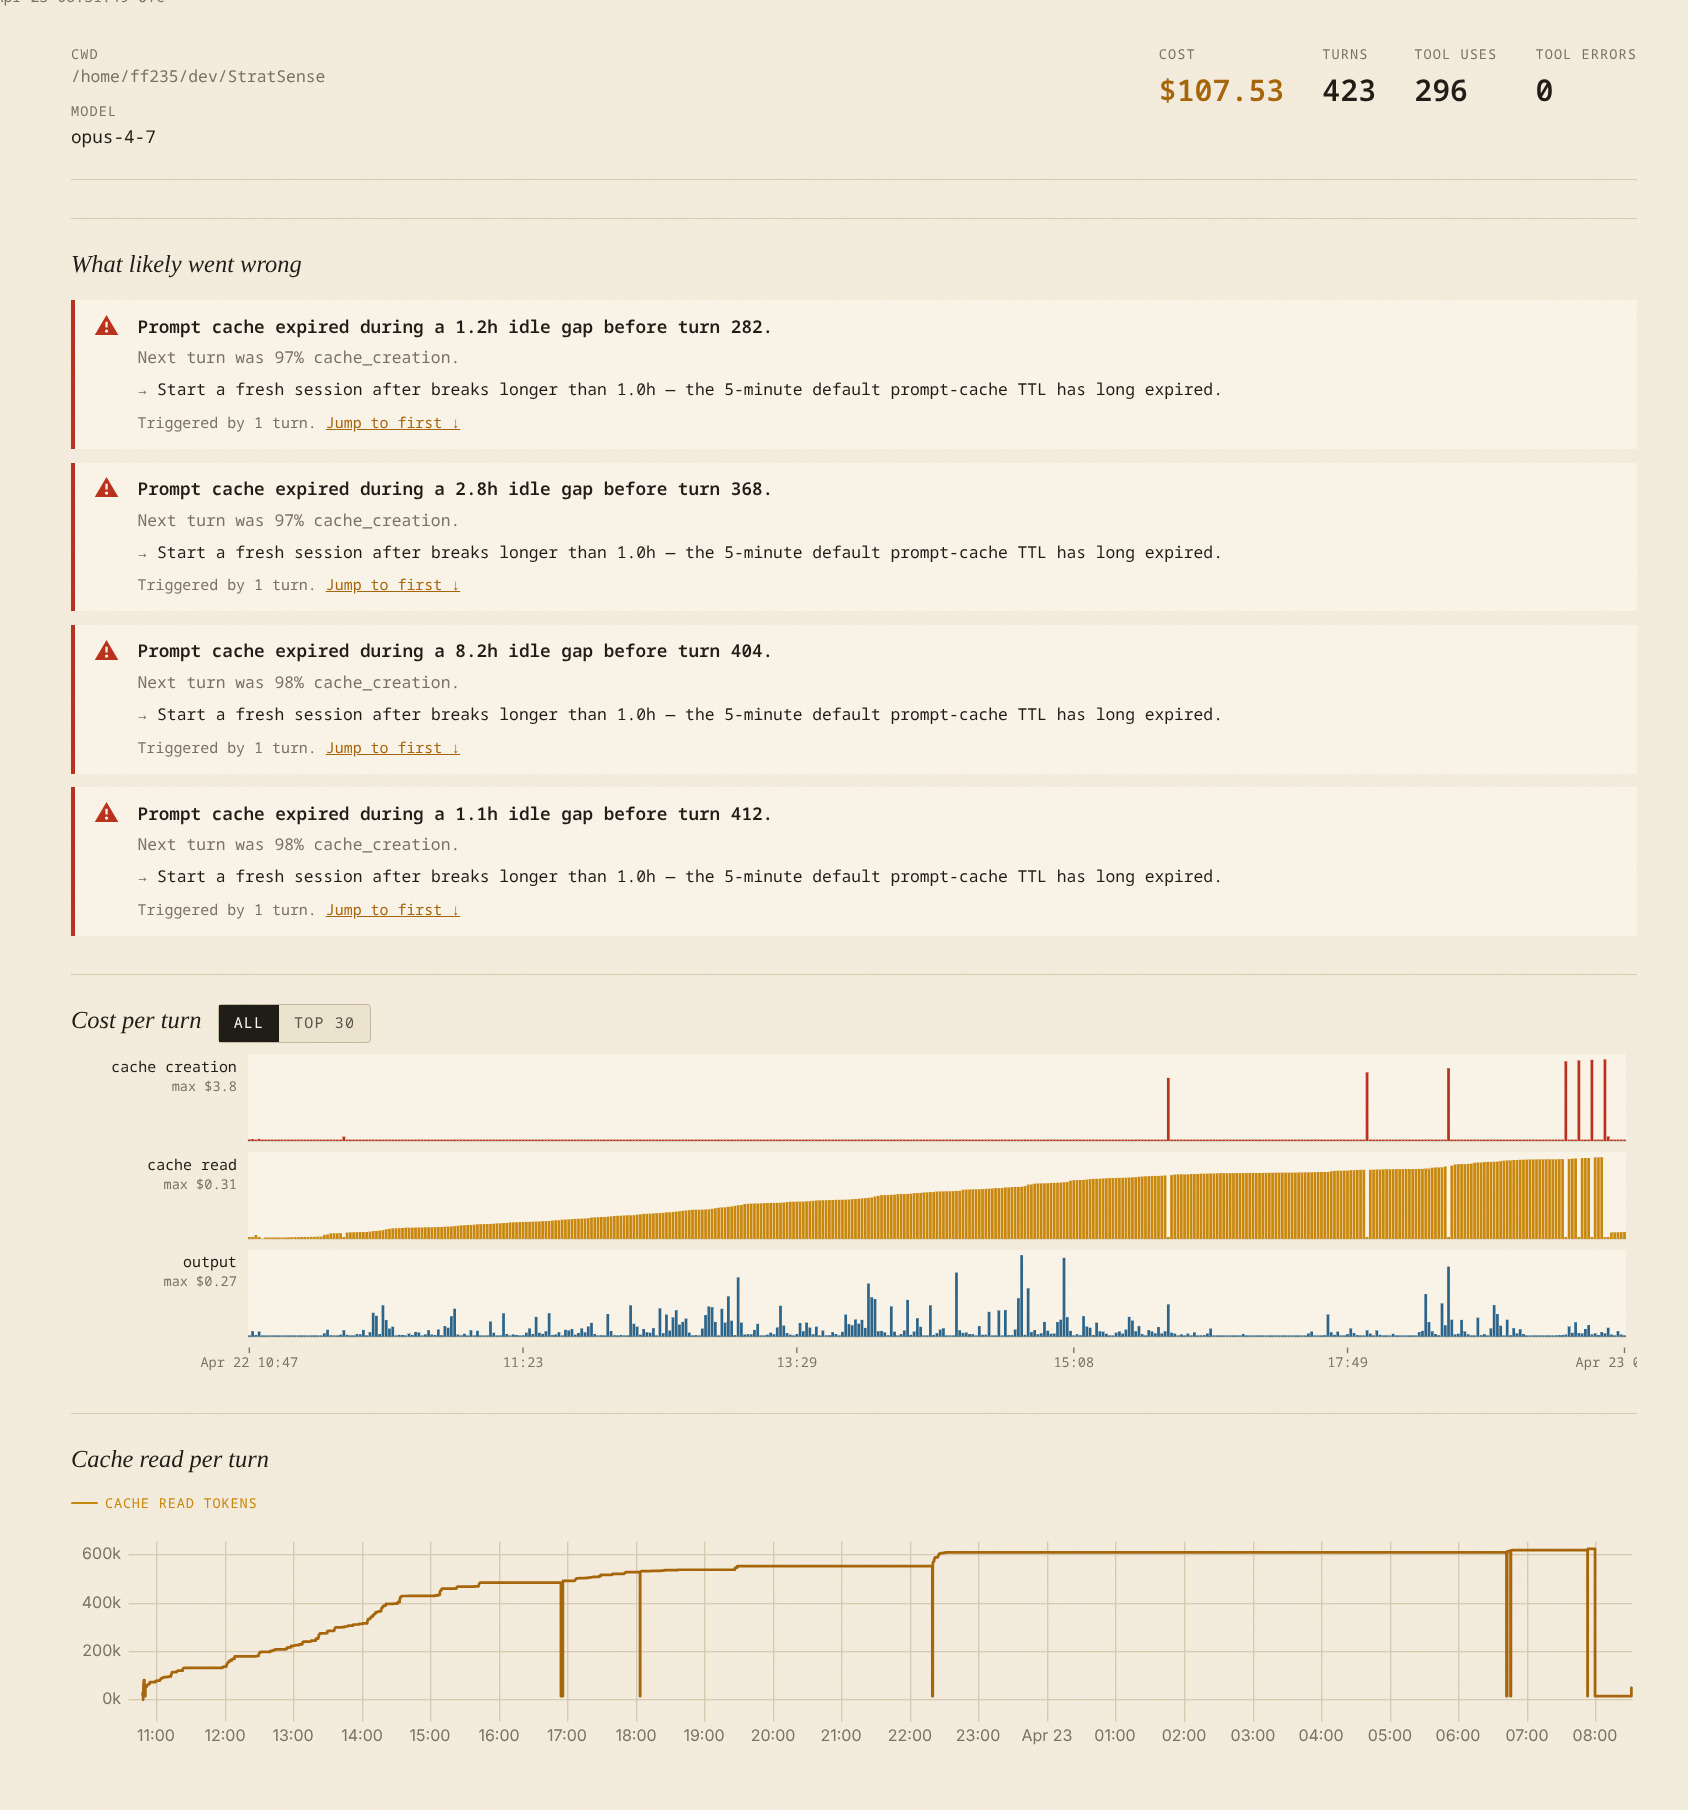
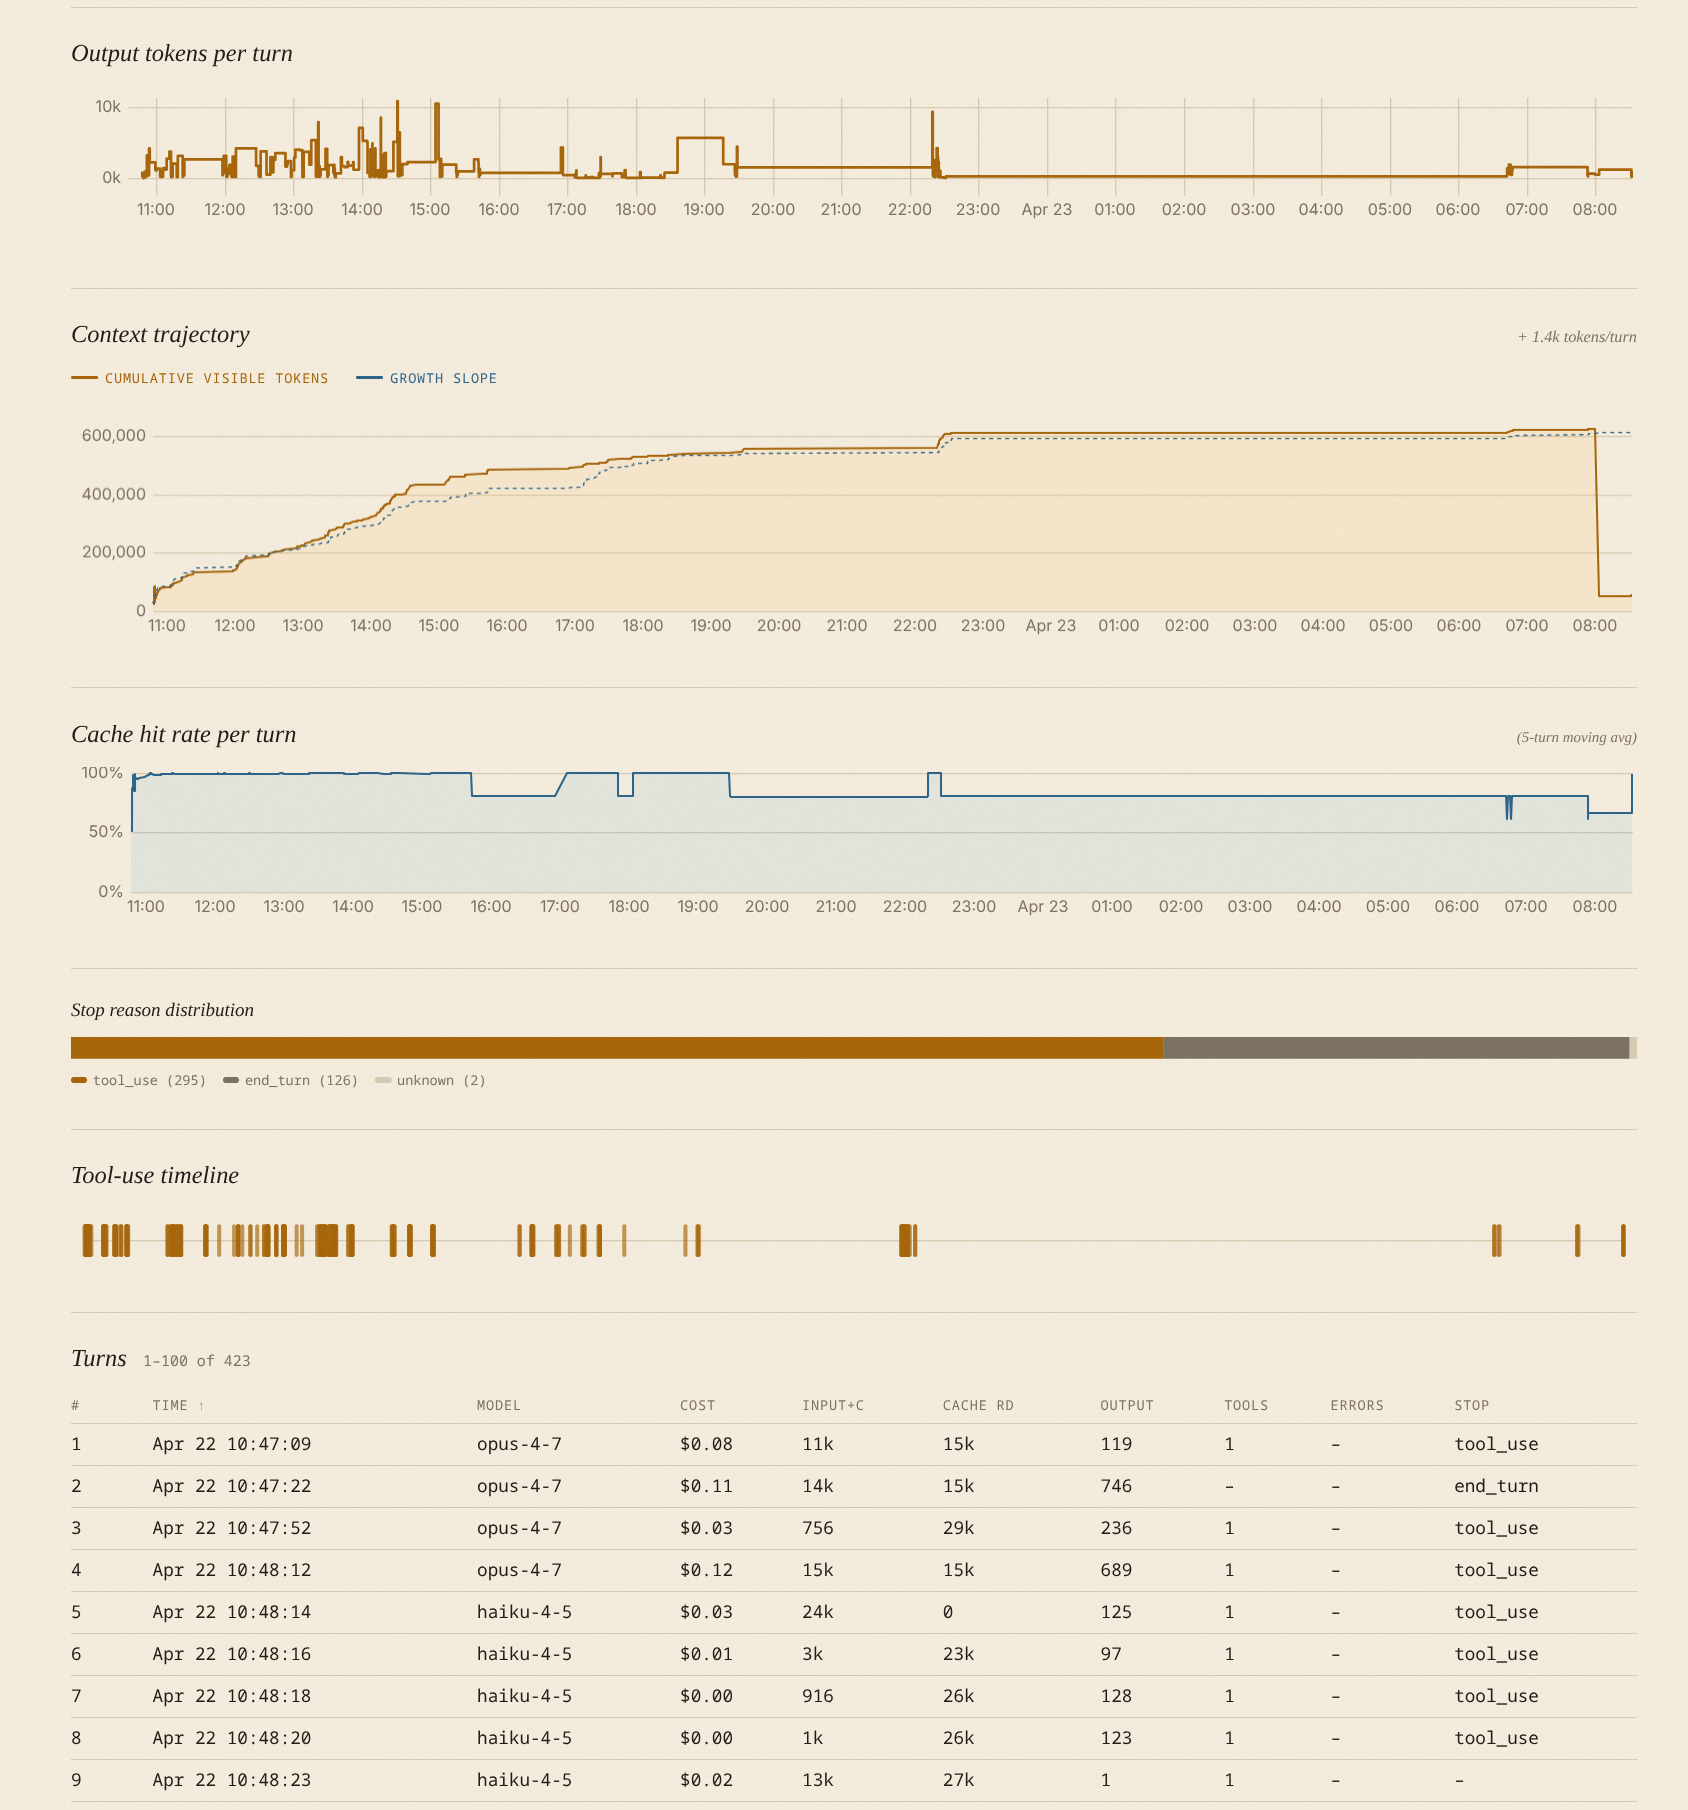
Session drill-down — pattern detection + cost-per-turn small multiples:
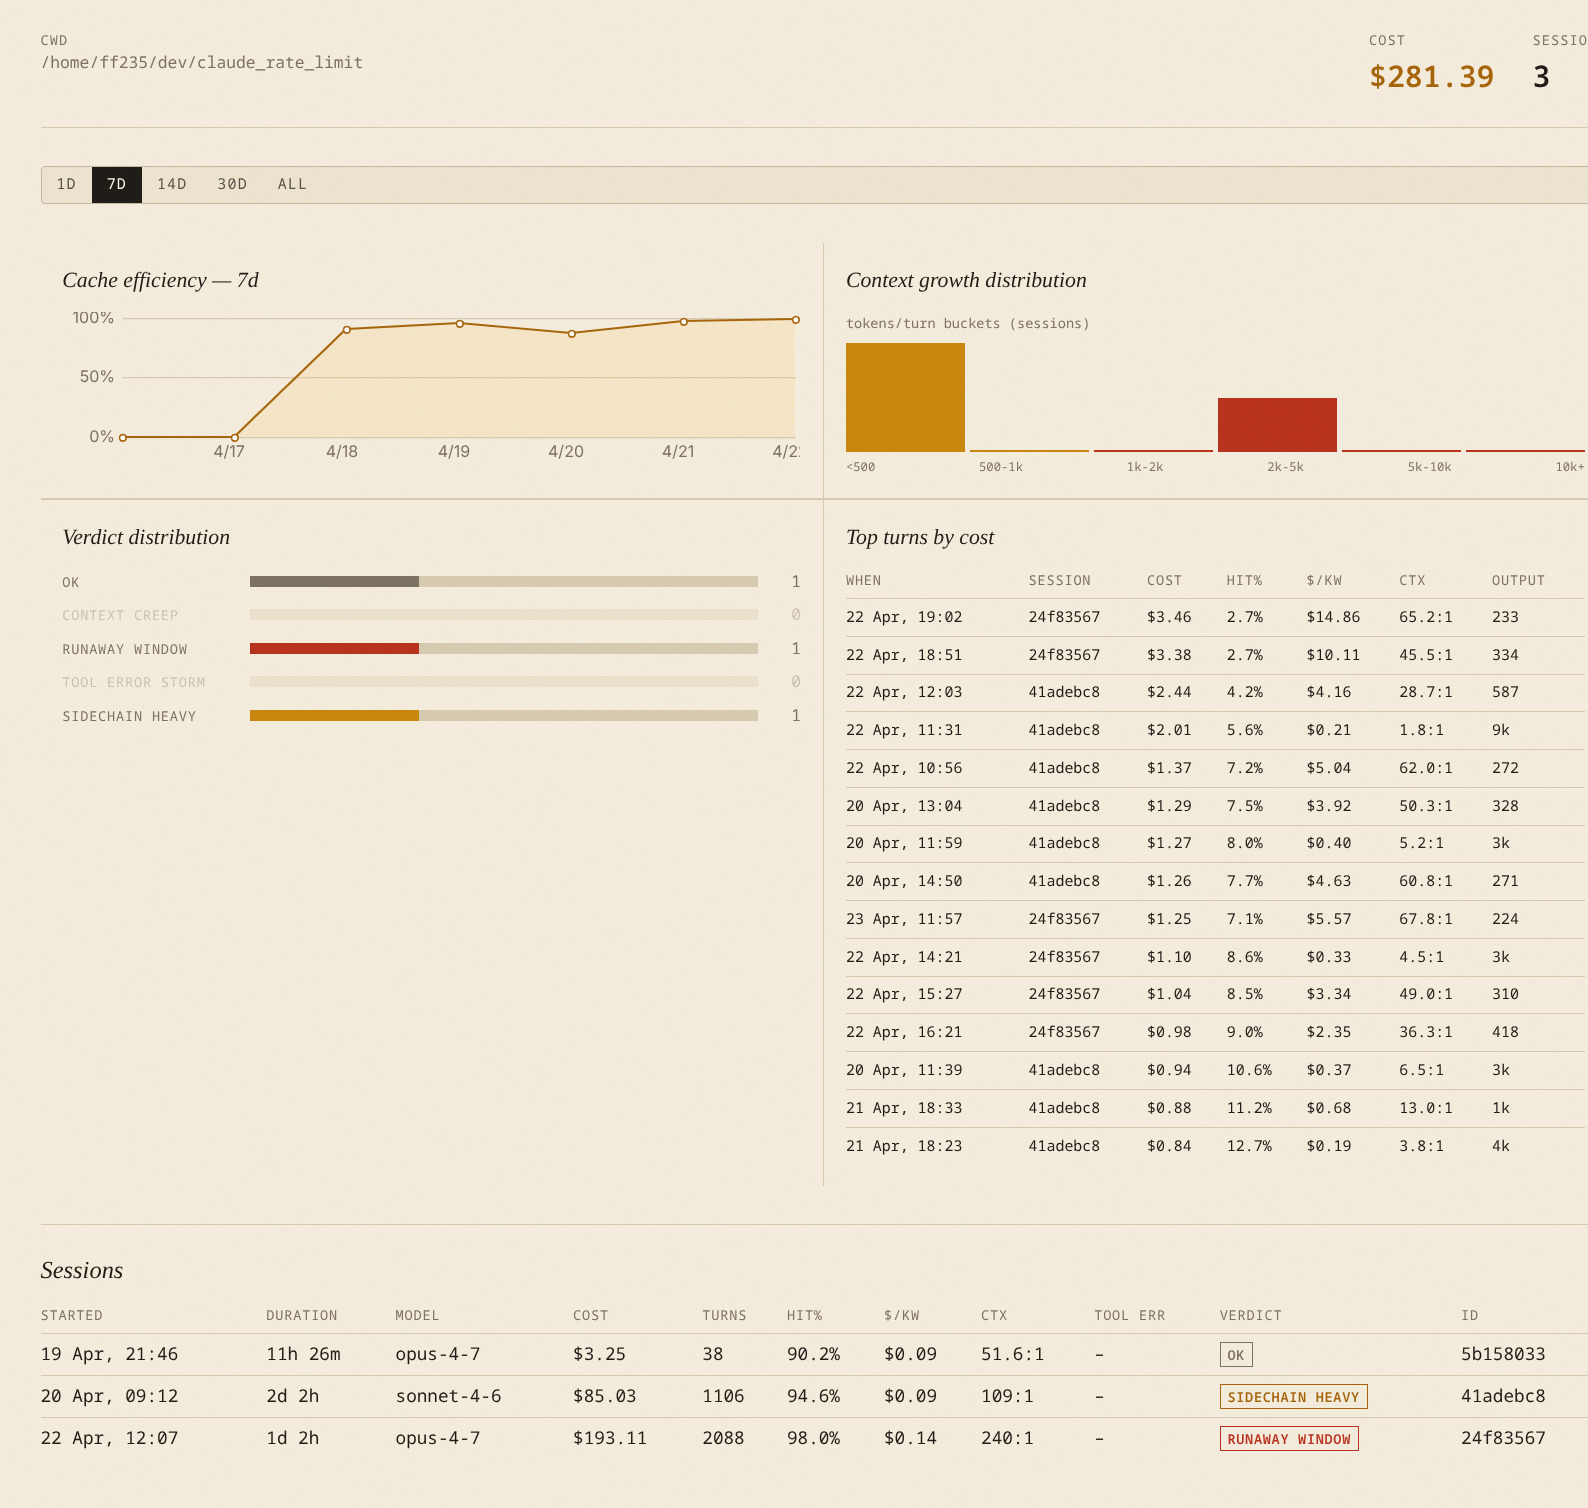
Project page — cache efficiency trend, verdict distribution, top turns, and cost-by-tool:
Install
pip install tokenol                        # CLI commands (daily, sessions, projects, ...)
pip install 'tokenol[serve]'               # adds the live dashboard (tokenol serve)
pip install 'tokenol[serve,persist]'       # adds DuckDB-backed history that survives JSONL deletion
Requires Python 3.10+. See tokenol on PyPI.
Quick start
# Daily token / cost aggregates over the last 14 days
tokenol daily

# Hourly breakdown for today
tokenol hourly

# Top 10 most expensive sessions in the last 30 days
tokenol sessions --since 30d --top 10 --sort cost

# Per-project rollup
tokenol projects

# Live view: burn rate + projected end-of-window cost
tokenol live --last 20m
All commands scan every JSONL file under $CLAUDE_CONFIG_DIR (falling back to the standard ~/.claude* locations) and deduplicate turns using the same message.id:requestId compound key that ccusage uses.
Scanning multiple projects
If you use workspace isolation (one ~/.claude-<project> directory per repo, pointed at via CLAUDE_CONFIG_DIR):
-
CLI commands (
daily,sessions,projects, …) default to the currently-active project. Pass--all-projects(or-A) for a cross-project view:# Total spend across every project in the last 14 days tokenol daily --since 14d --all-projects # Which sessions cost the most, globally tokenol sessions --since 30d --top 10 -A
-
The dashboard (
tokenol serve) defaults to all projects —CLAUDE_CONFIG_DIRis ignored so the dashboard is never silently scoped to a single workspace. Pass--scopedto opt into single-project view.
You can also set CLAUDE_CONFIG_DIR to a colon- or comma-separated list of paths to scan a specific subset (CLI commands only).
Commands
| Command | What it shows |
|---|---|
daily |
Per-day tokens (input, output, cache read/creation), cost, turn count |
hourly |
Per-hour breakdown for a single day (defaults to today) |
live |
Active 5-hour window burn rate, recent-activity rate, projected final cost |
sessions |
Per-session detail table with blow-up verdict (RUNAWAY, CONTEXT_CREEP, …) |
projects |
Per-project rollup grouped by cwd |
models |
Per-model rollup with tool-use counts and error rates |
verify |
Cross-check tokenol totals against ccusage --json (if installed) |
serve |
Launch a local browser dashboard with live burn-rate gauge and all panels |
Every command accepts:
--since 14d— lookback window (e.g.7d,30d, or an ISO date)--all-projects/-A— scan every~/.claude*directory (ignoresCLAUDE_CONFIG_DIR)--strict— exit non-zero if any cost-computation assumption fired--show-assumptions— always print the assumption footer--log-level debug|info|warning
tokenol sessions additionally takes --sort (cost, input, output, cache_read, turns, max_input, duration) and --top.
tokenol live takes --last 20m|2h|30s and exits non-zero if the projected window cost exceeds the configured reference.
Live dashboard
# Install with dashboard dependencies
pipx install 'tokenol[serve]'

# Start the dashboard (binds to http://127.0.0.1:8787)
tokenol serve

# Scope to the currently-active project (honor CLAUDE_CONFIG_DIR); faster tick, custom reference threshold
tokenol serve --scoped --tick 2s --reference 25

# Open browser automatically
tokenol serve --open
The dashboard updates via SSE as Claude Code writes events to disk. The server gates rebuilds on JSONL file changes — when no files have changed, it idles at near-zero CPU and forces a refresh at most once a minute (so time-windowed panels like Recent Activity don't drift more than ~60 s from wall clock). Multiple browser tabs share a single producer, so opening more tabs does not multiply server cost.
If SSE delivery silently stalls (browser tab throttling, extension hooks, long-lived EventSource quirks), the client self-heals: it polls /api/snapshot every 30 s as a backstop, force-reconnects on tab-visibility return, and runs a 90 s staleness watchdog. /api/snapshot reuses the broadcaster's cached payload while an SSE group is live, so the backstop costs only a JSON serialize. Hover the live-status dot for a "last update Ns ago" indicator.
Persistent history (opt-in)
By default, tokenol serve parses your ~/.claude*/projects/**/*.jsonl files into an in-memory model on each restart — fast, but the dashboard loses any session whose JSONL has been deleted or rotated.
Pass --persist to enable a DuckDB-backed history store at ~/.tokenol/history.duckdb (override with TOKENOL_HISTORY_PATH). The store contains no message content — only token counts, costs, models, timestamps, tool counts, and session metadata, comparable to a billing receipt. With persistence on:
- Deleting a JSONL no longer drops it from the dashboard. Quantitative panels render as before; only the per-turn modal's verbatim content snippets become unavailable, indicated by an "Archived — text snippets unavailable" badge. Metrics survive; words don't (matching the privacy intent of the deletion).
- Restart picks up where you left off. A background flusher batches writes (every 30 s or 100 turns, whichever first) and force-drains on graceful shutdown. The JSONLs remain the durable substrate — a process crash mid-flush loses nothing because the next start re-derives the missing window from the JSONLs (idempotent on
message.id:requestId). - Cold start stays bounded. The hot tier loads only the last
hot_window_daysof turns (default 90, tunable via/api/prefs); older history is read on demand from the warm tier.
Measured cost on the author's full ~/.claude* corpus (~1820 files, ~2 GB of JSONLs, page cache cold both runs):
| Default mode | --persist first start |
--persist subsequent starts |
|
|---|---|---|---|
| Time to first paint | ~5 s | ~12 s | ~12 s |
| Wall to settle | ~5 s | ~4 min (one-time backfill) | <30 s |
| Steady RSS | ~250 MiB | — | ~750 MiB |
| Durable disk | 0 | ~40 MB after backfill | grows incrementally |
Requires the persist extras (pip install 'tokenol[serve,persist]').
See docs/superpowers/specs/2026-05-03-opt-in-persistence-design.md for design rationale and docs/superpowers/specs/2026-05-02-persistent-history-design.md for the underlying store design.
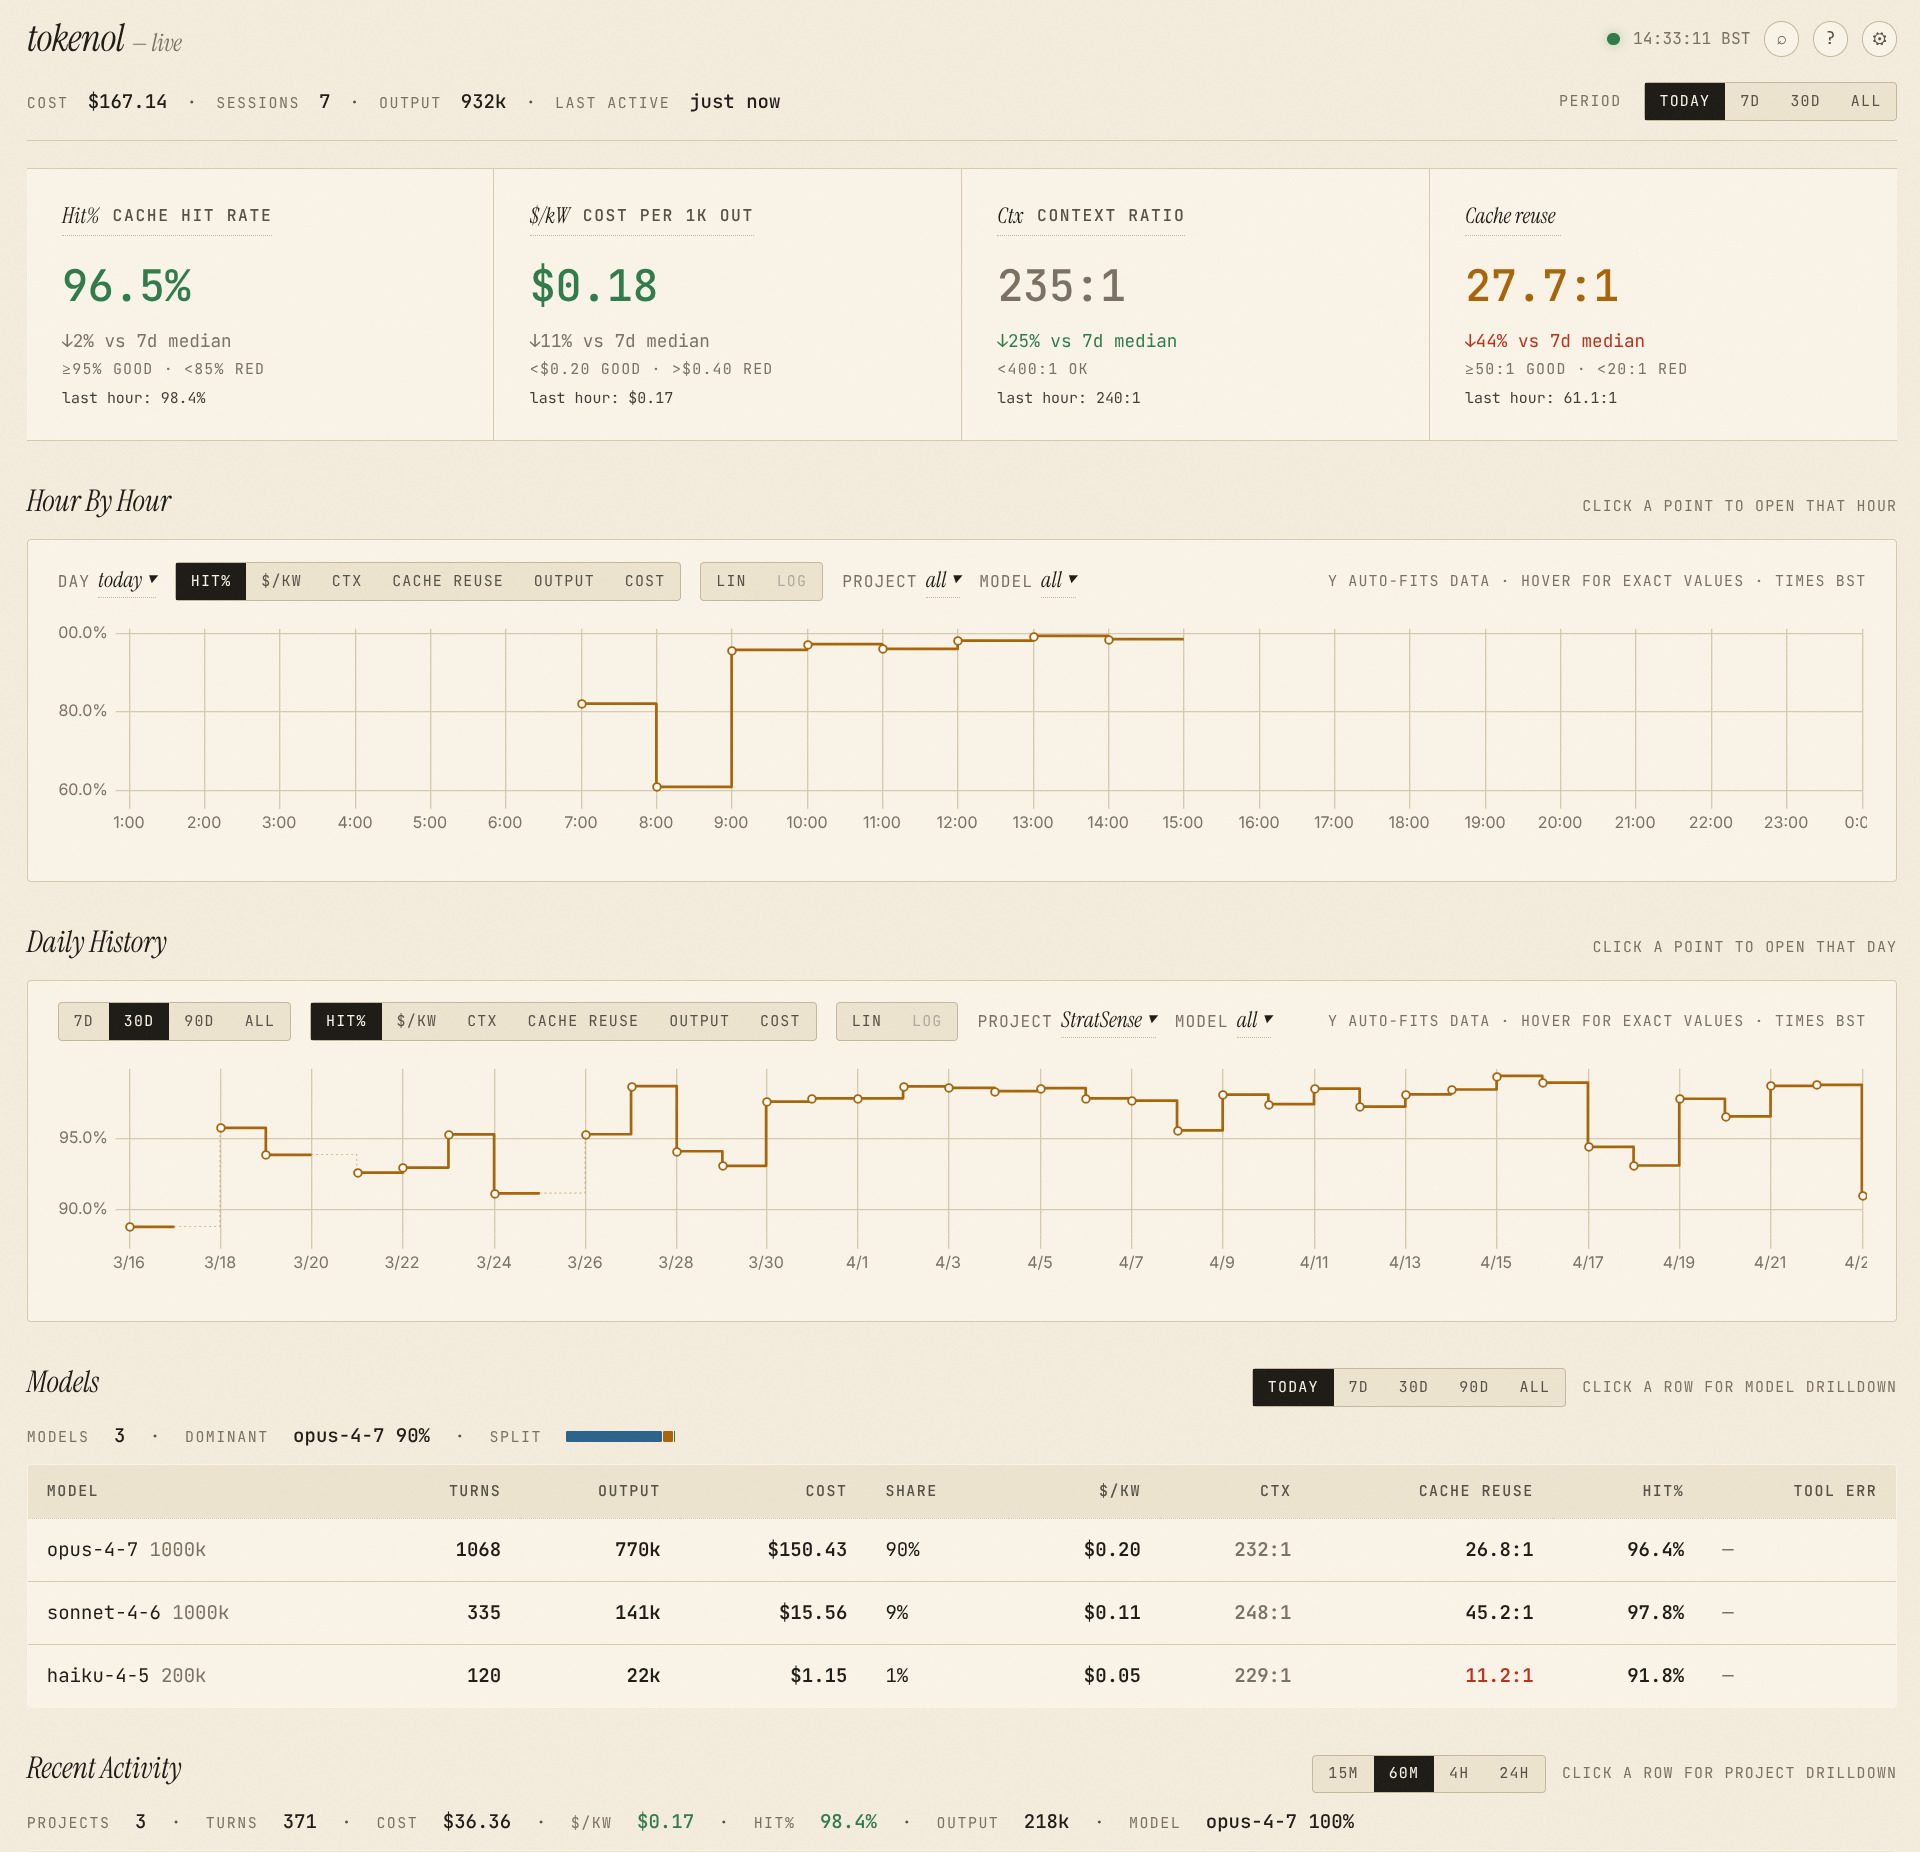
Main dashboard
Main page layout (top to bottom):
| Panel | What it shows |
|---|---|
| Topbar | Today's cost · sessions · output · last-active time; global period selector (Today / 7D / 30D / All) |
| Efficiency tiles | Hit% · $/kW · Ctx · Cache reuse — each with a delta chip vs 7-day median and colour-coded threshold |
| Hour By Hour | Hourly metric timeline with day-picker, metric pills, project/model filters, click-to-drilldown, and an optional compare overlay to put a second metric on the right y-axis |
| Daily History | 30-day metric history with 7-day moving average overlay; range pills (7D / 30D / 90D / All); same dual-metric compare as above |
| Models | Per-model cost, turns, output, and efficiency metrics; local range override; click row → /model/<name> |
| Recent Activity | Active projects in the last 60 min with Ctx used, $/kW, hit%, verdict; sortable; click row → /project/<cwd> |
Keyboard shortcuts: ? Glossary · / Find · , Settings · Esc close/back · g t scroll to top · ↑↓ Enter table row navigation · ← → chart cursor.
Efficiency metric glossary
| Metric | Definition | Target |
|---|---|---|
| Hit% | cache_read / (cache_read + cache_creation + input) |
≥ 95% |
| $/kW | cost × 1000 / output_tokens — dollars per 1k output tokens |
< $0.20 |
| Ctx | cache_read / output as N:1 — context tokens read per output token |
< 400:1 |
| Cache reuse | cache_read / cache_creation as N:1 — low = cache thrashing |
> 50:1 |
| Ctx used | Latest turn's visible context ÷ model context window | < 85% |
Preferences
User preferences (gate-poll cadence and threshold overrides) are saved to:
$XDG_CONFIG_HOME/tokenol/prefs.json # default: ~/.config/tokenol/prefs.json
Shape:
{
  "tick_seconds": 300,
  "reference_usd": 50.0,
  "thresholds": {
    "hit_rate_good_pct": 95,
    "hit_rate_red_pct": 85,
    "cost_per_kw_good": 0.20,
    "cost_per_kw_red": 0.40,
    "ctx_ratio_red": 400.0,
    "cache_reuse_good": 50.0,
    "cache_reuse_red": 20.0
  }
}
tick_seconds is how often the server stat-checks the JSONL files for changes (cheap). The full snapshot only rebuilds on a detected change or once per ~60 s heartbeat — so a long tick_seconds mainly reduces stat-syscall noise, not rebuild cost.
Reset to defaults via the Settings modal (POST /api/prefs {"thresholds": "reset"}).
Session drill-down
Click any session to open the drill-down page (/session/<id>). It shows:
-
What likely went wrong — automated pattern cards at the top of the page, each with a headline, the measurable signal that triggered it, and a suggested fix. Five patterns are detected:
Pattern Signal Idle expiry Gap ≥ 1 h between turns + next turn was ≥ 80% cache_creation — the 5-minute prompt-cache TTL expired Compaction re-inflation Visible-token count dropped then climbed back to ≥ 80% of the previous peak — compacting but immediately refilling the context Context ceiling plateau ≥ 20 consecutive turns at ≥ 90% of the model's context window — paying near-full-context input rates throughout Sidechain explosion Sidechain/task-agent work accounts for > 40% of session cost Tool error storm > 20% error rate across any 10-turn window -
Cost per turn — stacked bar chart (input / output / cache_read / cache_creation). Toggle "All" or "Top 30" to focus on the most expensive turns. Click any bar to open the per-turn detail modal.
-
Per-turn modal — cost component breakdown, token counts, tool call results (✓/✗), first 500 chars of the user prompt and assistant preview. Navigate with ← / → or close with Esc.
Per-tool cost attribution
Every assistant turn's cost is split across the tools it invoked, surfacing across the dashboard:
- Tool Mix panel (Breakdowns) — top-10 tools ranked by spend (or invocation count, via the
TOKENS / $toggle), anothertail row, and a dim italic__unattributed__row that surfaces residual cost so panel totals reconcile to overall spend. In$mode the panel also exposes a PRO-RATA / EXCL CACHE-READ attribution toggle:- Pro-rata (default) — distributes
cache_read_usdacross visible tools by the bytes those tools currently hold in the conversation window, alongsideinput_usdandcache_creation_usd. - Exclude cache-read — routes
cache_read_usdentirely into the non-tool residual instead. Answers "what do these tools cost if cache-read is treated as pure context overhead?" Selection persists inlocalStorage; the toggle is hidden in tokens mode (it's a cost-only concept).
- Pro-rata (default) — distributes
- Tool detail page (
/tool/<name>) — 30-day daily cost line chart, scorecards (Est. Cost · Output tokens · Invocations · Top project), plus cost-by-project and cost-by-model ranked bars. - Project and model detail pages — each gains a "Cost by tool" ranked-bar list.
How the split works. Each turn's four cost components are attributed by JSON byte share:
- Output side (
output_usd) — split acrosstool_useblocks emitted on the same turn by their JSON byte size. - Input side (
input_usd + cache_read_usd + cache_creation_usd, combined into a single input cost pool) — split acrosstool_use/tool_use_resultblocks still lingering in the conversation window from previous turns, by accumulated byte size.
Tools whose byte shares sum below 1.0 (because non-tool content like user prompts and assistant text also lives in the window) leave the residual as __unattributed__. Compaction is detected heuristically when the assistant's input token pool drops below 20 % of the session's running peak (COMPACTION_DROP_RATIO = 0.2 in src/tokenol/ingest/parser.py); when it fires, the per-session byte tallies reset, the input side of the detection turn flows entirely into __unattributed__ (no tool bytes remain in the window), and subsequent turns rebuild their per-tool tallies from scratch.
The per-tool data is dashboard-only — there is no tokenol tools CLI command. See docs/METRICS.md for the full attribution formula and the API surface (/api/breakdown/tools, /api/tool/<name>, plus the by_tool blocks on project and model endpoints).
What it detects
For every session, tokenol computes a blow-up verdict against spec-defined thresholds:
| Verdict (table label) | Trigger |
|---|---|
RUNAWAY_WINDOW (runaway) |
Any 5-hour window costs ≥ $50 |
CONTEXT_CREEP (ctx-creep) |
Max single-turn input ≥ 500k and growth ≥ 2k/turn |
TOOL_ERROR_STORM (tool-errs) |
≥ 10 tool uses with > 30% error rate |
SIDECHAIN_HEAVY (sidechain) |
Sidechain session costing > $5 |
OK (ok) |
Everything else |
Daily efficiency columns
The tokenol daily report shows these cost/cache efficiency ratios:
| Column | Meaning | Target |
|---|---|---|
$/kW |
USD per 1,000 output tokens | < $0.20 |
Ctx |
Context tokens read per output token (N:1) | lower is better |
Cache reuse |
Cache reads per cache-creation token (N:1) | > 50:1 |
Hit% |
% of context served from prompt cache | ≥ 95% |
Pricing
Flat per-model rates (no 1M-token tier surcharge — matches ccusage's default behaviour). The current registry lives in src/tokenol/metrics/cost.py. When a turn's model isn't in the registry, tokenol records an UNKNOWN_MODEL_FALLBACK assumption tag and uses a conservative default; run with --show-assumptions or --strict to surface these.
See docs/METRICS.md for metric definitions and docs/ASSUMPTIONS.md for the full list of assumption tags.
Development
git clone https://github.com/farhanferoz/tokenol
cd tokenol
uv sync --extra dev
uv run pytest
uv run ruff check
Licence
MIT
Release history Release notifications | RSS feed


Download files
Download the file for your platform. If you're not sure which to choose, learn more about installing packages.
Source Distribution
Built Distribution
Filter files by name, interpreter, ABI, and platform.
If you're not sure about the file name format, learn more about wheel file names.
Copy a direct link to the current filters
File details
Details for the file tokenol-0.6.1.tar.gz.
File metadata
- Download URL: tokenol-0.6.1.tar.gz
- Upload date:
- Size: 1.9 MB
- Tags: Source
- Uploaded using Trusted Publishing? No
- Uploaded via: uv/0.10.12 {"installer":{"name":"uv","version":"0.10.12","subcommand":["publish"]},"python":null,"implementation":{"name":null,"version":null},"distro":{"name":"Fedora Linux","version":"44","id":"","libc":null},"system":{"name":null,"release":null},"cpu":null,"openssl_version":null,"setuptools_version":null,"rustc_version":null,"ci":null}
File hashes
| Algorithm | Hash digest | |
|---|---|---|
| SHA256 |
bb3723dbe8345ffdd37bdca78e60474cd64e2edadd39e4bdaa687bfd9abcdc53
|
|
| MD5 |
63764da59dc7be52c1569eab936cc2cb
|
|
| BLAKE2b-256 |
be8006c31f38a56e73631aa89de6f4e5206b5c83dd80cbcc1e685985fe6a31ba
|
File details
Details for the file tokenol-0.6.1-py3-none-any.whl.
File metadata
- Download URL: tokenol-0.6.1-py3-none-any.whl
- Upload date:
- Size: 164.1 kB
- Tags: Python 3
- Uploaded using Trusted Publishing? No
- Uploaded via: uv/0.10.12 {"installer":{"name":"uv","version":"0.10.12","subcommand":["publish"]},"python":null,"implementation":{"name":null,"version":null},"distro":{"name":"Fedora Linux","version":"44","id":"","libc":null},"system":{"name":null,"release":null},"cpu":null,"openssl_version":null,"setuptools_version":null,"rustc_version":null,"ci":null}
File hashes
| Algorithm | Hash digest | |
|---|---|---|
| SHA256 |
b2e9974cbcf83a05e7eae2e0519d19825894583cbcbc3e87863a00686c573d32
|
|
| MD5 |
a9290dcb6c7532622440caa5ce562493
|
|
| BLAKE2b-256 |
1e2ed7a26fdf8bea3c1f8f31a795f7901cb64335b425d570ef4c0deffbc46285
|






