
A btop for your PyTorch GPU jobs: live terminal dashboard for training runs

Project description
torchwatch
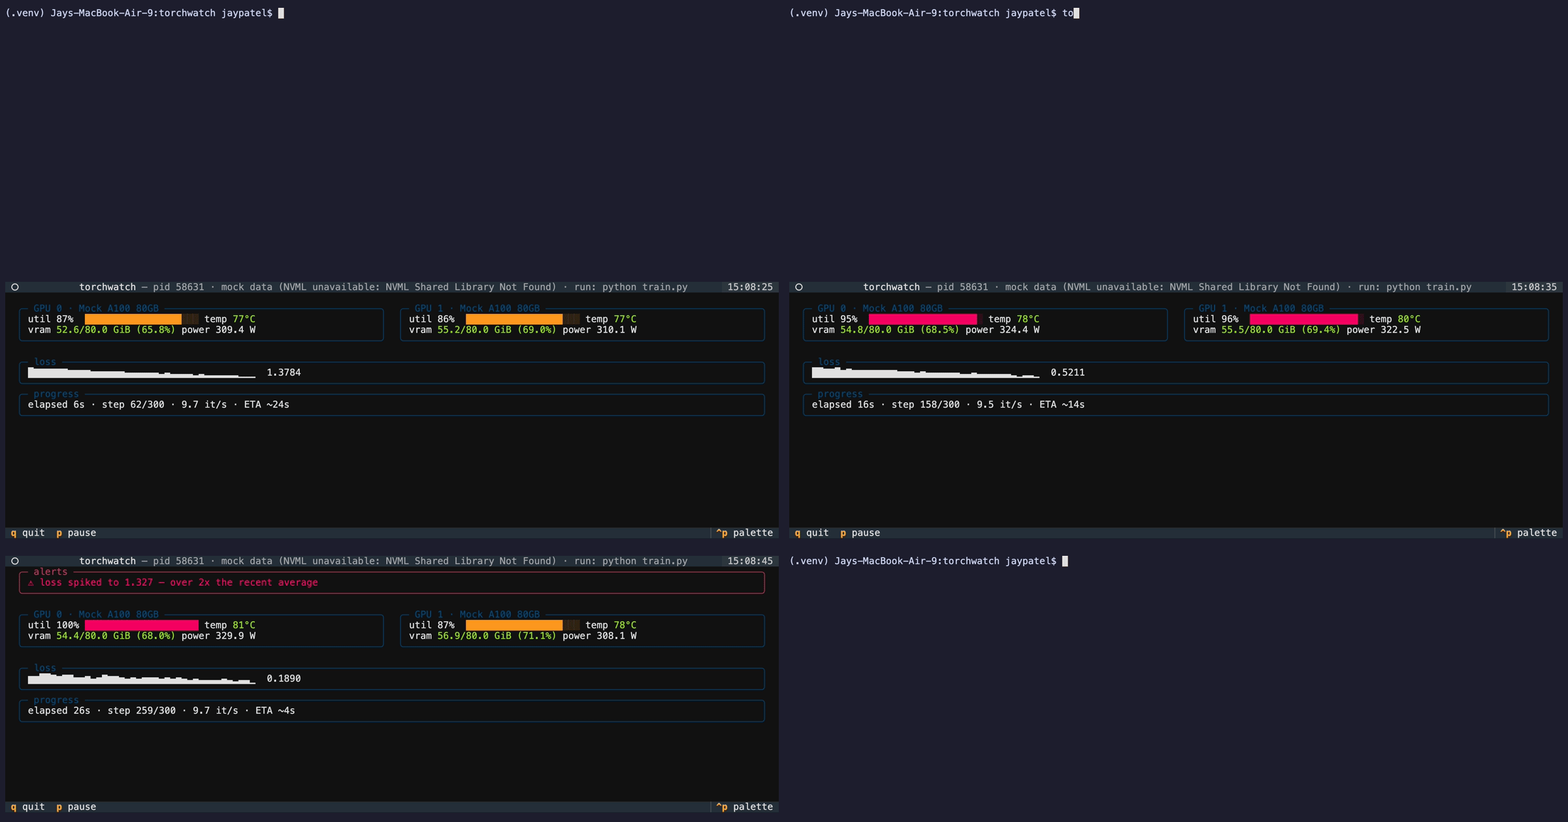
A btop for your PyTorch GPU jobs with live per-GPU utilization, VRAM pressure, training throughput, loss curve, and ETA, all in your terminal, with zero code changes.
Install
pip install torchwatch-tui
(The command and package are torchwatch; only the PyPI name carries the suffix.)
Run
The easiest way is to launch your training command under torchwatch:
torchwatch run -- python train.py --epochs 10
Your script runs as a child of torchwatch under a pseudo-terminal. Its output is
parsed live, and quitting the dashboard (q) terminates it.
Attach to a job that's already running:
torchwatch list           # list running PyTorch processes
torchwatch --pid 12345    # attach to one of them
Attaching reads the process's stdout via /proc (Linux only), and only works when
stdout is redirected to a file (python train.py > train.log). If it isn't,
torchwatch tells you why and suggests alternatives instead of guessing.
Smoke-test the dashboard on synthetic data
torchwatch --demo
Current Features
- Per-GPU panels — utilization, VRAM (used/total and a pressure-colored gauge), temperature, and power with one tile per device
- Loss sparkline — scrolling curve of recent loss values
- Throughput + ETA — steps/sec over a rolling window, elapsed time, and a time-to-completion estimate through epoch restarts
- Alerts area — appears only when something needs attention, and lingers long
enough to read:
- VRAM above 95% on a specific GPU, with concrete fixes (smaller batch size, mixed precision, gradient checkpointing)
- loss stalled (no meaningful change over the last 100 updates)
- loss spike (latest value far above the recent average)
Keys: q quit · p pause
Supported log formats
torchwatch parses training progress straight from stdout with no imports or callbacks. Detected automatically:
| format | example line |
|---|---|
| tqdm | 42/500 [00:12<02:15, 3.4it/s, loss=0.693] |
| PyTorch Lightning | Epoch 3/10: 42/500 [... loss=0.693 ...] |
| HF Trainer | {'loss': 0.693, 'learning_rate': 5e-05, 'epoch': 1.2} |
| plain | step 42/500 loss: 0.693 |
The header shows which format was detected. Lines that match nothing are ignored.
Notes
- GPU stats come from NVML (NVIDIA). Without a usable NVML (e.g. macOS, no driver), torchwatch falls back to clearly-labeled mock data so the dashboard still runs.
--pidattach and process detection use/procand process memory maps, so they are Linux-only.torchwatch runworks everywhere.
Development
pip install -e ".[dev]"
pytest
ruff check .
Planned
Roughly in order of likelihood:
- More alert rules — NaN/inf loss (the run is dead, say so immediately), GPU temperature, sustained throughput drops (often a dataloader bottleneck)
- Alert logging — opt-in
--alert-log alerts.log: a timestamped record of every alert, so a spike at 3am is still explainable at 9am - Configurable thresholds —
--vram-warn/--vram-alertinstead of the built-in 85/95 - Generic metric sparklines — track any
key=valuemetric your logs already print (accuracy, val_loss, grad_norm, …) and chart the ones you pick - Appearance — theme selection, optional extra GPU stats
- Config file — persistent defaults once the flag count justifies it
- Raw output pane — the wrapped process's actual stdout, scrolling under the dashboard
- Multi-job dashboard — one dashboard, several training processes
Note
This is basically just a vibe-coded for fun project, to try out Fable 5. Don't expect too much!
Release history Release notifications | RSS feed


Download files
Download the file for your platform. If you're not sure which to choose, learn more about installing packages.
Source Distribution
Built Distribution
Filter files by name, interpreter, ABI, and platform.
If you're not sure about the file name format, learn more about wheel file names.
Copy a direct link to the current filters
File details
Details for the file torchwatch_tui-0.1.1.tar.gz.
File metadata
- Download URL: torchwatch_tui-0.1.1.tar.gz
- Upload date:
- Size: 31.4 kB
- Tags: Source
- Uploaded using Trusted Publishing? No
- Uploaded via: twine/6.2.0 CPython/3.12.5
File hashes
| Algorithm | Hash digest | |
|---|---|---|
| SHA256 |
f9711cd84086e6a812b8fc53d96fa764c042ccc58ad08a3400e5f7f5992c64d9
|
|
| MD5 |
2108a7dfc471e4e605cd161c88549f18
|
|
| BLAKE2b-256 |
e994f9fb05675f8f212c3a8c8d8cd68c3848a5eefce1465fc35ac5a817587517
|
File details
Details for the file torchwatch_tui-0.1.1-py3-none-any.whl.
File metadata
- Download URL: torchwatch_tui-0.1.1-py3-none-any.whl
- Upload date:
- Size: 27.1 kB
- Tags: Python 3
- Uploaded using Trusted Publishing? No
- Uploaded via: twine/6.2.0 CPython/3.12.5
File hashes
| Algorithm | Hash digest | |
|---|---|---|
| SHA256 |
d0df2587aa77bd5c77c34180a18b998106029ace41c8bac18fef3fc86159a3c8
|
|
| MD5 |
354dd9cd471fe749c310cd029345342c
|
|
| BLAKE2b-256 |
7d9eea89324cf5b06e096f9a673e33408b557e295389a52f0b538ccbb25b7a1a
|






