
TPU-TOP
A simple terminal-based monitoring dashboard for Google Cloud TPUs, designed to give you real-time visibility into your machine's performance both on the host and the device.
[!NOTE] This tool was inspired by the nvitop project for GPUs. This is a community project and not an official Google product.

Project Overview
tpu-top provides a visual, TUI (Terminal User Interface) to monitor system and TPU resources. It is tailored to run it directly on a TPU instance either on a GCE VM or a GKE Pod.
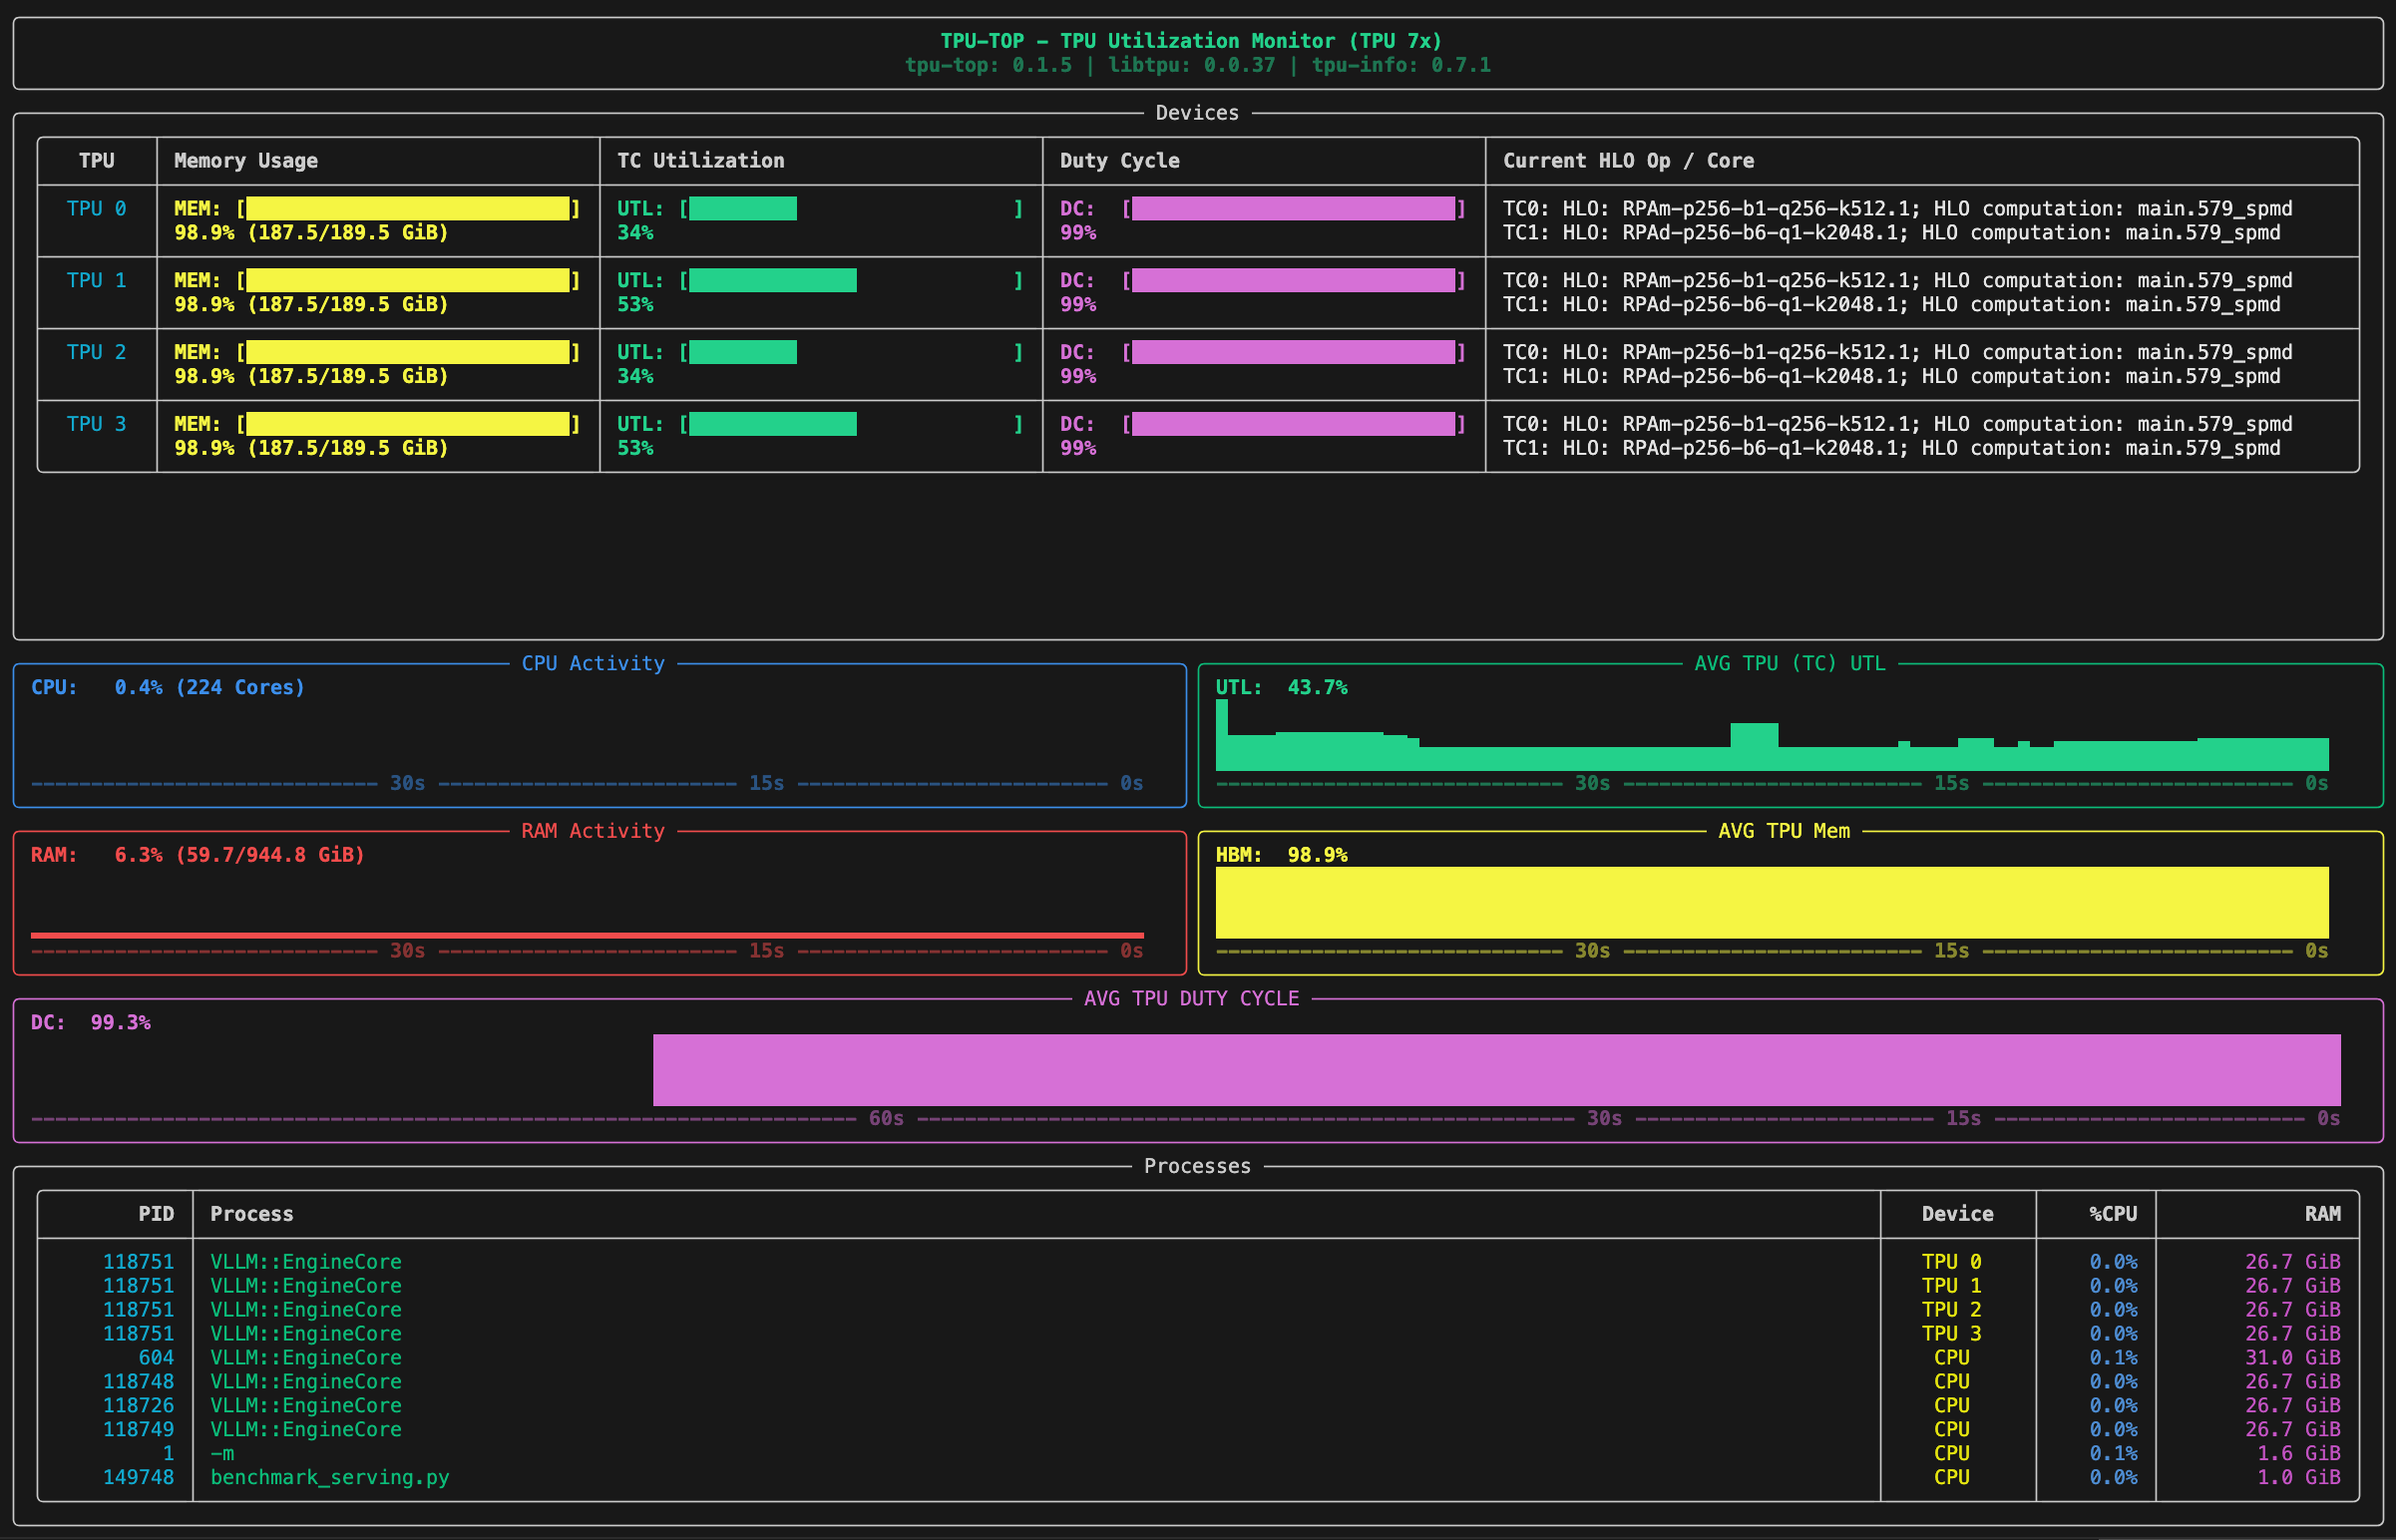
What You Can See
- TPU Memory & Utilization: Real-time memory usage, TensorCore utilization, and raw duty cycle for each TPU device.
- History Graphs: Visual graphs with timeline markers showing the history of CPU (with core count), RAM (with GiB usage), and TPU usage.
- Duty Cycle History: A dedicated panel showing the history of TPU duty cycle.
- PIDs per TPU: A dedicated process list showing which PIDs are utilizing specific TPU devices, including their host RAM and CPU impact.
- Active HLO Ops: Current HLO operations executing on each TPU core (Tensor Cores and Sparse Cores).
- TPU Hardware Info: Detailed hardware specifications (like VMEM, HBM, memory bandwidth, peak Ops, sparse core details) accessible by pressing
i.
Calculations Explained
Duty Cycle
Duty Cycle represents the percentage of time the TPU is "busy" (not idle) during a given sampling window.
Performance Insights:
- High Duty Cycle (e.g., >90%): The TPU is constantly running kernels and is not waiting on the host.
- Low Duty Cycle (e.g., <30%): This is often a sign of "data starvation." The TPU is idle because it is waiting for the CPU to provide input data.
TensorCore Utilization
TensorCore Utilization measures the computational intensity of the workload. It tracks what percentage of the TPU's peak theoretical matrix-multiplication capacity is actually being used while the chip is active.
Performance Insights:
- Low TensorCore Utilization: If your Duty Cycle is high but your TensorCore Utilization is low, your TPU is "busy," but it isn't doing much math. This often occurs when:
- Batch sizes are too small to saturate the hardware.
- The model is limited by memory bandwidth rather than compute.
- The code spends a lot of time on non-matrix operations (e.g., scalar transposes).
How to use them together
- Low Duty Cycle + Low TensorCore Util: Your TPU is mostly idle, likely waiting for data from the CPU.
- High Duty Cycle + Low TensorCore Util: Your TPU is constantly working, but the specific operations (kernels) you are running are not computationally dense (likely memory-bound or using small batch sizes).
- High Duty Cycle + High TensorCore Util: Ideal performance; you are keeping the TPU busy and fully utilizing its matrix-multiplication hardware.
Installation
From PyPI (Recommended)
pip install tpu-top
From Source
You can also install tpu-top directly from the source directory.
Prerequisites
Ensure you have Python 3.10+ and access to a Cloud TPU environment. The tool relies on tpu-info to communicate with the TPU driver.
Standard Source Install
Navigate to the project root directory and run:
pip install .
Developer Install
If you are making modifications and want them to reflect immediately:
pip install -e .
How to Use
Once installed, you can launch the dashboard from anywhere in your terminal:
tpu-top
Keyboard Shortcuts
i: Toggle TPU hardware information table.escape: Return to the default processes view.qorCtrl+C: Quit the application.
Running Tests
To validate changes, run the unit tests:
python -m unittest test_main.py
(Note: If testing inside a GKE container, ensure dependencies are installed in your target environment).
1 maintainer

Metadata
1 maintainer
Release files for tpu-top 0.1.9
For a detailed explanation of source distributions (sdists) and built distributions (wheels), please see the package formats documentation.
Source distribution (sdist)
| File | Size | Uploaded | |
|---|---|---|---|
| tpu_top-0.1.9.tar.gz | 18.8 kB | Details |
Built distribution (wheel)
| File | Interpreter | ABI | Platform | Reset |
|---|---|---|---|---|
| tpu_top-0.1.9-py3-none-any.whl | Python 3 | none | any | Details |
Total release size: 36.3 kB
Release files / tpu_top-0.1.9.tar.gz
| Download URL | tpu_top-0.1.9.tar.gz |
|---|---|
| Size | 18.8 kB |
| Tags | Source |
|
SHA-256 checksum How to use checksums |
75eb9091c880829495df92f03353df969c21c625f9dfdf8fc3528268b0c3f8b3
|
|
BLAKE2b-256 checksum How to use checksums |
66211a379f73413b154cf2de69f415c77f5578ca4d0392a68838d9b2698effc4
|
| Upload date | |
|
Uploaded using Trusted Publishing? What is trusted publishing? |
No |
| Uploaded via |
twine/6.2.0 CPython/3.13.11
|
Release files / tpu_top-0.1.9-py3-none-any.whl
| Download URL | tpu_top-0.1.9-py3-none-any.whl |
|---|---|
| Size | 17.5 kB |
| Tags | Python 3 |
|
SHA-256 checksum How to use checksums |
1d2382ee37f26261b1598654a300c196e1a406dfbf514568f618161952da2f84
|
|
BLAKE2b-256 checksum How to use checksums |
e187dc1d7108db29d785ff06481191ba9a44d438e6f44aa8a7a8d6d27fa8855c
|
| Upload date | |
|
Uploaded using Trusted Publishing? What is trusted publishing? |
No |
| Uploaded via |
twine/6.2.0 CPython/3.13.11
|














