tpubar

Project description
TPUBar
Google Cloud TPU Utilization Bar for Training Models
# from pypi
pip install --upgrade tpubar

# from src
pip install --upgrade git+https://github.com/trisongz/tpubar.git

Quickstart
!pip install --upgrade tpubar
!pip install --upgrade git+https://github.com/trisongz/tpubar.git

# Option #1 on Colab

!tpubar test # you will be prompted to authenticate with GCE on Colab

# Option #2 on Colab

from tpubar import TPUMonitor
import os

monitor = TPUMonitor(tpu_name=os.environ.get('TPU_NAME', None), profiler='v2')

# your training code below

monitor.start()

for x in dataset:
    ops(x)
    print(monitor.current_stats)

# Option #3 in Terminal/CLI - (Non Colab/Remote VM/Your Desktop)
tpubar test tpu-name
API Quickstart
from tpubar import TPUMonitor
'''
default args
- tpu_name = None, (str) name of a TPU you want to query, in case of multiple active TPUs
- project = None, (str) gcp project name
- profiler = 'v1', (str) options are ['v1', 'v2']
- v1: for Non-Colab, Pytorch, Tensorflow Estimator (TF1), and Non-Tensorflow TPU Queries
- v2: Colab, Tensorflow 2+
- refresh_secs = 10, (int) how many seconds between each query
- fileout = None, (str) path where tqdm goes to, defaults to sys.stdout
- verbose = False, (bool) prints current_stats every query if True
- disable = False, (bool) disables TPU Bars if True, useful if only stats want to be captured
# Colors can be defined using standard cli colors or hex (e.g. 'green' or ' #00 ff00')
- tpu_util = 'green', (str) color for TPU MXU Bar
- tpu_secondary = 'yellow', (str) color for second TPU Bar [Memory for v1, Active Time for v2]
- cpu_util = 'blue', (str) color for CPU Utilization Bar
- ram_util = 'blue' (str) color for RAM Utilization Bar
'''
monitor = TPUMonitor(tpu_name=None, project=None, profiler='v1', refresh_secs=10, fileout=None, verbose=False, disable=False, tpu_util='green', tpu_secondary='yellow', cpu_util='blue', ram_util='blue')
monitor.start()
# Can be called to retrieve stats, use stats.get(var, '') to avoid errors since Idle Time and Idle String don't return anything until after full TPU initialization.
'''
# Stats available
- v1 returns {'tpu_mxu': float, 'tpu_mem_per': float 'tpu_mem_used': float, 'tpu_mem_str': str, 'cpu_util': float, 'ram_util': float, 'ram_util_str': str}
- v2 returns {'tpu_mxu': float, tpu_mxu_str': str, 'tpu_idle_time': float, 'tpu_idle_str': str, 'cpu_util': float, 'ram_util': float, 'ram_util_str': str}
# Example
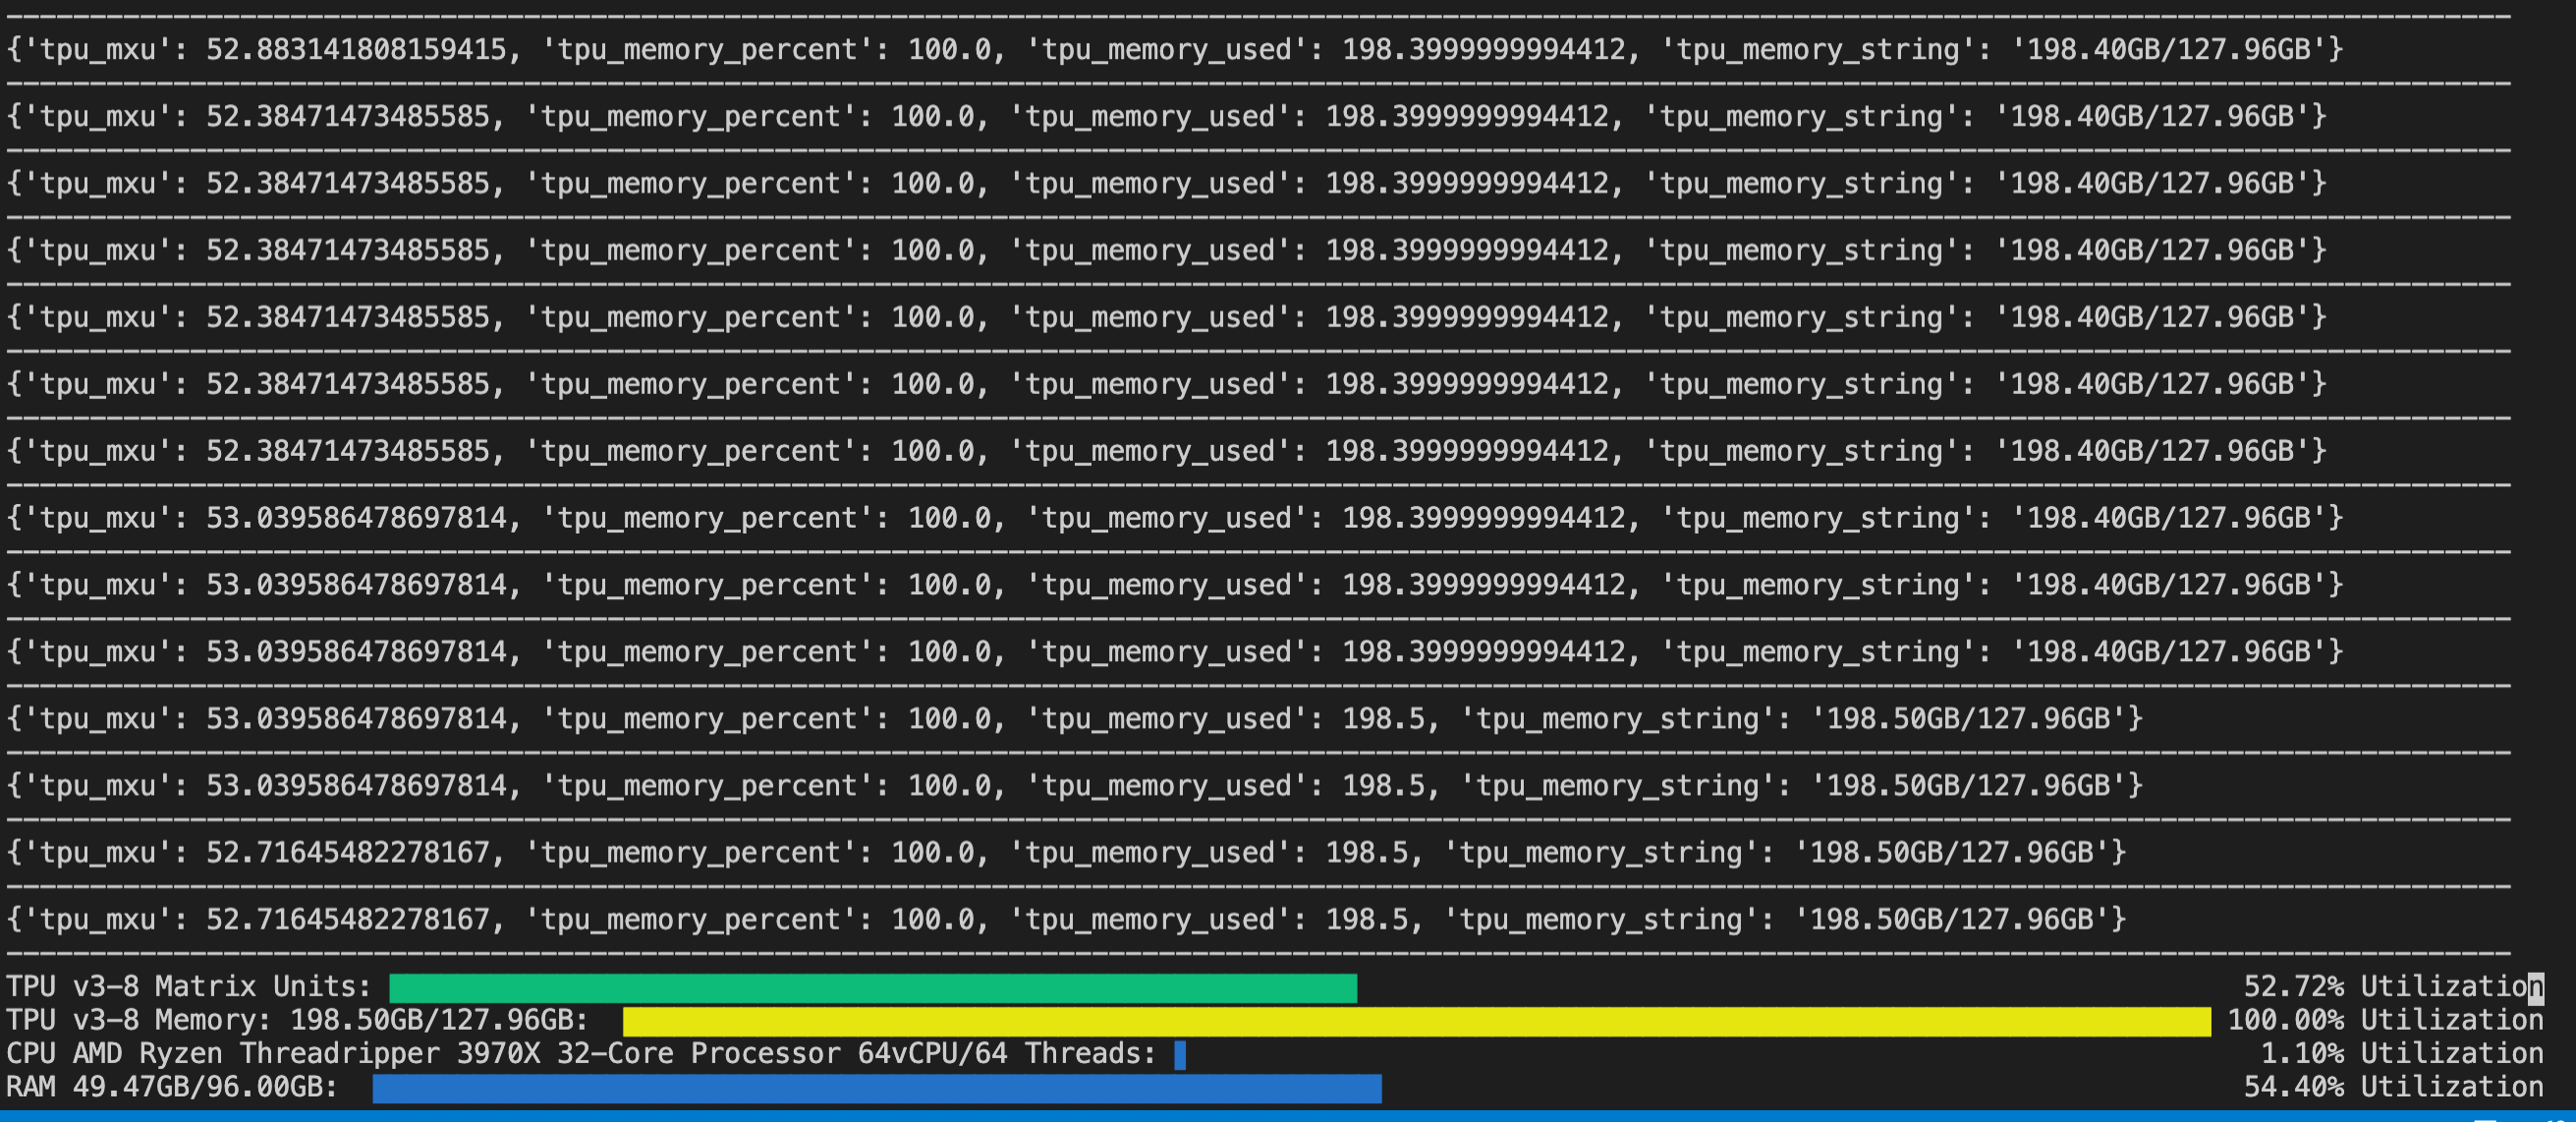
'v1': {'tpu_mxu': 52.88895420451343, 'tpu_mem_per': 100.0, 'tpu_mem_used': 198.5, 'tpu_mem_str': '198.50GB/127.96GB', 'cpu_util': 0.9, 'ram_util': 54.5, 'ram_util_str': '49.43GB/96.00GB'}
'''
stats = monitor.current_stats
tpu_mxu = stats.get('tpu_mxu', '')
# Adding Hooks
# hook = {'name': 'Slack', 'func': notificationclient.message, 'freq': 10}
# This will call notificiationclient.message(monitor.current_stats) every 10 monitoring iterations
# If refresh_secs = 10, then function will fire every 100 seconds.
# The hook will receive all the stats returned above as a dict.
monitor.add_hook(name='slack', hook=notificationclient.message, freq=10)
# Remove a Hook
monitor.rm_hook(name='slack')
# Manually Firing a Hook
# To force all hooks to fire, say at the end of a training loop
stats = monitor.current_stats
message = do_format(stats) # format your message into a string
monitor.fire_hooks(message, force=True)
# Getting the current time (from when tpubar started monitoring)
train_time = monitor.get_time(fmt='hrs') # ['secs', 'mins', 'hrs', 'days', 'wks']
# Create a Timeout Monitor that sends a notification when TPU MXU falls below x% after y number of pings
# timeout_hook = {'idx': 0, 'num_timeouts': num_timeouts, 'hook': hook, 'min_mxu': min_mxu, 'pulse': 0.00, 'warnings': 0}
# Pulse = last recorded MXU when warning notification fires.
monitor.create_timeout_hook(hook=notificationclient.message, min_mxu=10.00, num_timeouts=20)
# Upon firing, will send to the notificationclient
# Warnings reset after detecting TPU > min MXU.
msg = "TPUBar has detected [number of warnings] periods of under [min_mxu]. Last TPU MXU Pulse: [last recorded MXU]. Time Alive: [time_active in hrs]"
notificationclient.message(msg)
# Rerouting Print Functions (Unstable)
# to avoid line breaks and overlapping bars in std.out, you can optionally reroute any print function to use tpubar's logger, which uses tqdm.write. This will return the print function
_logger = logger # back up the obj in case things go wrong
logger.info = monitor.reroute_print(logger.info)
# Restore the original
logger.info = _logger.info
CLI Quickstart
The commands can be run remotely or on the same VM
# Monitor the TPU until Exit (cmd+c)
tpubar monitor [tpuname] --project [gcp_project] (optional)

# Test Run for 60 secs
tpubar test [tpuname] --project [gcp_project] (optional)

# Create or use an application key found in tpubar/auth.json
tpubar auth [adc_name] -l (list auths)

# Create new tmux session
tpubar sess [session_name]

# Attach your current window to the tmux session
tpubar attach [session_name]

# kill a tmux session
tpubar killsess [session_name]
Notes
The reason for the 2 versions of TPUBar, 'v1' and 'v2' is due to how they use different API calls to get TPU metrics. Within Colab, only 'v2' works if you do not have TPUs in your Google Cloud project. Otherwise, to avoid compatability issues.
-
'v1': is meant for TPU Projects running on GCE and/or Using Tensorflow < 2. Additionally, v1 can be called on a remote system (like your PC) to query your TPU running on GCE without being directly connected. Not yet tested, but should also be used in Pytorch training as well.
-
'v2' is meant for Colab and/or Tensorflow 2+, and uses tensorflow APIs, which require the system to be directly connected to the TPUs.
Bonus
You can call 'tpubar sess new_session' in CLI to create a new tmux session and 'tpubar killsess new_session' to kill it.
Contributors
Acknowledgements
Tensorflow Research Cloud for providing TPU Resources


Download files
Download the file for your platform. If you're not sure which to choose, learn more about installing packages.
Source Distribution
Built Distribution
Filter files by name, interpreter, ABI, and platform.
If you're not sure about the file name format, learn more about wheel file names.
Copy a direct link to the current filters
File details
Details for the file tpubar-0.0.9.tar.gz.
File metadata
- Download URL: tpubar-0.0.9.tar.gz
- Upload date:
- Size: 16.3 kB
- Tags: Source
- Uploaded using Trusted Publishing? No
- Uploaded via: twine/3.2.0 pkginfo/1.6.1 requests/2.25.0 setuptools/50.3.1.post20201107 requests-toolbelt/0.9.1 tqdm/4.52.0 CPython/3.6.12
File hashes
| Algorithm | Hash digest | |
|---|---|---|
| SHA256 |
31551b677c38845ea6031c3627878b027a6c2ec6fcb35ae0a499a58efc3ba228
|
|
| MD5 |
a1323e18b2e8143fb70c883b8f9eba35
|
|
| BLAKE2b-256 |
d7f580739a85c4fbecd6b30a7b2f79744d8a049a5aca7b22fd2faa8af15b4258
|
File details
Details for the file tpubar-0.0.9-py3-none-any.whl.
File metadata
- Download URL: tpubar-0.0.9-py3-none-any.whl
- Upload date:
- Size: 16.0 kB
- Tags: Python 3
- Uploaded using Trusted Publishing? No
- Uploaded via: twine/3.2.0 pkginfo/1.6.1 requests/2.25.0 setuptools/50.3.1.post20201107 requests-toolbelt/0.9.1 tqdm/4.52.0 CPython/3.6.12
File hashes
| Algorithm | Hash digest | |
|---|---|---|
| SHA256 |
ca4bca037ec13f364599897653e75432f12ad2d04538fb4ad706701c6c85a6b9
|
|
| MD5 |
6cc57746141fb2f3f864d32ebca3bdc2
|
|
| BLAKE2b-256 |
32c4f017ee97f55570bd889d4a772e3b8240204a27d60fe47d692160c6dcd006
|


