
tracefork


A time-travel debugger for AI agents. Record a run to a content-addressed tape, replay it bit-for-bit for $0 — proven by hash, not asserted — fork any step to explore a counterfactual, and measure which step is causally responsible for a failure, with confidence intervals.
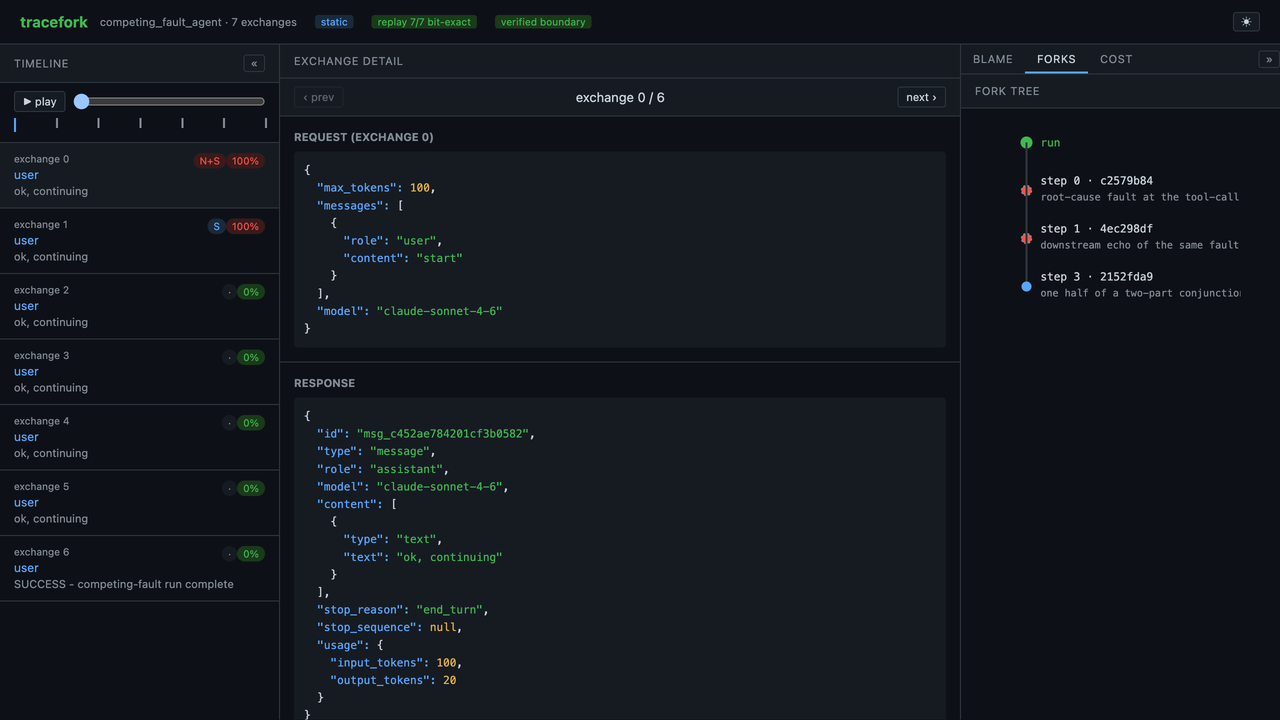
The report: a collapsible Timeline rail with blame badges (left), the request/response for
the selected exchange (center), and a collapsible Analysis rail (right) tabbed across
Blame (causal ranking with 95% CIs), Forks (the fork tree), and Cost (per-model/
per-tool spend). Generated offline, for $0, by
examples/demo_report.py.
Why it's different
Most agent-observability tools show you a trace and ask you to eyeball it. tracefork treats a run like a recording you can rewind, branch, and reason about causally:
- Record — every model call is teed into a content-addressed tape at the Anthropic SDK's HTTP seam, along with the clock/id/random draws the agent reads.
- Replay — the tape replays bit-exact for $0: every request body is sha256-checked against the tape, so replay is proven identical, not asserted. No network, no API key.
- Fork — swap a different response into any step and run the same agent forward. The unchanged prefix replays for free; only the new tail costs anything.
- Blame — resample those forks across every step and rank each by flip-rate (how often perturbing it changes the outcome), with Wilson-score confidence intervals so a small sample can't masquerade as certainty.
And, crucially, the instrument is held to ground truth: tracefork validate injects
faults with known root causes and confirms blame fingers the right step (1.00
top-1 across five injection mechanisms, with an enforced negative
control); tracefork bench plants several competing causes on one tape and checks the engine
tells them apart (10/11, the single exception named — not hidden). Both run offline, for
$0, in seconds. See Validation scope for exactly what each number does and
doesn't claim, and Related work and scope for how that number relates
to the field's public benchmark.
Quickstart (offline, $0, no API key)
Python 3.12 via uv. Everything below is offline.
uv sync --extra dev

uv run pytest -q                       # full offline suite (1641 tests, $0)
uv run tracefork validate              # blame vs injected, known-root-cause faults
uv run tracefork bench                 # discrimination among competing causes
uv run python examples/demo_report.py  # write examples/demo_report.html (the screenshot)
uv run python -m tracefork_spike       # the original bit-exact replay receipt (source checkout only)
tracefork_spike is retired prototype code kept for the receipt above; it's deliberately excluded
from the built wheel (pyproject.toml's [tool.hatch.build.targets.wheel]), so the last command
only works from a source checkout (git clone + uv sync), not after pip install tracefork.
The offline/$0 claim above isn't just prose: tests/conftest.py runs an autouse, session-wide guard
that patches socket.socket.connect to raise on any non-loopback destination and blocks the real
ANTHROPIC_API_KEY/ANTHROPIC_AUTH_TOKEN env vars for the whole test process, so a test that tried
to reach the network or a real key would fail loudly rather than silently spend money.
Or run the whole gate — lint, format, type-check, tests+coverage, the self-validation and replay-corpus regression gates, the benchmark, and a package build — as one script with a single PASS/FAIL verdict:
bash scripts/e2e.sh
tracefork validate prints:
  [PASS] corrupted_tool_output   top-1: 1.00
  [PASS] misleading_retrieval    top-1: 1.00
  [PASS] wrong_system_prompt     top-1: 1.00
  [PASS] dropped_message         top-1: 1.00
  [PASS] poisoned_argument       top-1: 1.00

  overall top-1 precision: 1.00
  negative control max flip: 0.00 (threshold 0.30)
CLI
uv run tracefork --help
| Command | What it does |
|---|---|
replay <tape> --agent pkg:fn |
Replay a tape and print the bit-exact verification receipt. |
verify <tape> --agent pkg:fn |
Verify replay; exit non-zero on drift (CI gate). Also --corpus (fixture-corpus gate) and --store (structural fsck). |
fork <run_id> --step N --response f --agent pkg:fn |
Fork a run at step N with a mutated response; record the counterfactual branch. |
blame <run_id> --agent pkg:fn [--k 10] [--budget 5.0] |
Rank every step by causal flip-rate with 95% CIs (re-runs the agent; budget-capped). |
validate / bench |
Self-validation against injected faults / competing-cause benchmark. |
report <run_id> -o out.html / serve |
Render the self-contained HTML report, or serve the live UI (127.0.0.1). |
Also available: coalition-fork, tournament, diff, receipt, coverage, prune,
bundle-export/import, export/ingest (OTel / OpenInference), proxy, and session.
Run --help on any command for details.
Replay, verify, fork, and the offline demos need no key.
blameon a real run re-runs the agent's counterfactual tails against the live API, so it's budget-capped — the offline, $0 proof that blame works istracefork validate.
Install
pip install tracefork          # core: offline/$0, no provider or framework SDKs
pip install 'tracefork[all]'   # + providers, Bedrock, MCP, observability
Framework adapters are separate extras so one library's version churn can't block the rest:
frameworks (LangChain/LangGraph), openai-agents, crewai, autogen, adk, pydantic-ai. Providers
(openai, google-genai) come via providers; AWS via bedrock. Every framework import is
guarded — import tracefork and the full test suite run with none of them installed.
Single-quote bracketed installs — unquoted
[...]is glob-expanded by zsh intono matches found.
Record your own agent
Every example elsewhere in this README runs tracefork's own bundled demos. Here's the shape
for pointing it at yours — every name below (Recorder, Tape, ReplayVerifier) imports
straight from the top-level tracefork package, no deep module paths. This one runs with no
key and no network too (the httpx.MockTransport stands in for the real anthropic client's
transport so the snippet is copy-paste runnable); point Recorder at your real
anthropic.Anthropic() client to record a real run. The runnable twin is
examples/record_your_agent.py.
import anthropic, httpx
from tracefork import Recorder, ReplayVerifier, Tape

def run_agent(client: anthropic.Anthropic) -> str:
    reply = client.messages.create(
        model="claude-sonnet-4-6", max_tokens=32, messages=[{"role": "user", "content": "hi"}]
    )
    return reply.content[0].text

# Swap this for a real `anthropic.Anthropic()` client to record a real run.
fake_client = anthropic.Anthropic(api_key="sk-demo", http_client=httpx.Client(
    transport=httpx.MockTransport(lambda r: httpx.Response(200, json={
        "id": "msg_demo", "type": "message", "role": "assistant", "model": "claude-sonnet-4-6",
        "content": [{"type": "text", "text": "Hi! How can I help?"}], "stop_reason": "end_turn",
        "stop_sequence": None, "usage": {"input_tokens": 10, "output_tokens": 6},
    }))))

with Recorder(fake_client, agent_name="quickstart") as rec:
    run_agent(rec.client)
rec.tape.save("quickstart_tape.db")                 # content-addressed, sha256-fingerprinted

tape = Tape.load("quickstart_tape.db")               # ... later, or on a different machine
result = ReplayVerifier(tape, run_agent).verify()    # replays for $0 — no network, no key
print(f"bit-exact: {result.bit_exact}  ({result.matched}/{result.total} requests matched)")
How it works
The spine is a record/replay seam at the Anthropic SDK's httpx boundary plus a nondeterminism-virtualization seam the agent reads time/ids through. Bit-exactness is the contract between them.
transport.py— record mode tees request+response bytes into the tape (streaming SSE and JSON alike); replay mode serves recorded bytes and sha256-asserts every request body matches. A replay transport has no inner transport, so an unrecorded request is a hard error, never a silent network call.tape.py— content-addressed (sha256) blobs + an ordered event log, persistable to SQLite, with a hash-chaindigest()fingerprint.nondet.py—NondetSourceis the only way the agent gets time/ids/random;RecordingNondetlogs draws,ReplayNondetserves them back,DriftingNondetis the negative control that must keep failing.fork.py— three phases: prefix-replay ($0, asserted to match), mutation-injection (swapped response), tail-record (the counterfactual, recorded fresh).blame.py— forks each stepktimes, grades the outcome via anOracle, counts flips vs. the parent;wilson_ci()for intervals,BudgetGovernorto cap spend.
Deeper design notes — every module, the load-bearing invariants, the async concurrency-graph
determinism, and the honest boundaries of each seam — live in
CLAUDE.md and each module's docstring.
Determinism boundary (honest scope)
Bit-exact replay holds within a declared boundary: single-process (sync or asyncio), with
clock/id/random nondeterminism captured through NondetSource — including the completion
order of concurrent asyncio fan-out, which is recorded and re-imposed on replay. An agent
that reads datetime.now()/uuid/random directly, or spans threads/subprocesses, steps
outside it — and the verifier detects the resulting drift rather than papering over it. An
opt-in BoundaryGuard turns the catchable violations into a loud error at record time. See
SPIKE0.md for how the boundary was de-risked.
Headers are out of scope by default. The bit-exactness claim is asserted on the request
body only: the default matcher fingerprints sha256(request.content) and never looks at a
header, so anthropic-version, anthropic-beta, and SDK/platform headers (user-agent,
x-stainless-*, populated by the SDK's platform_headers()) can all change between record and
replay without tripping a divergence. That's deliberate — most header variance (SDK version, OS/
arch, retry counters) is incidental noise you don't want failing an otherwise-identical replay —
but it also means a body-identical request sent under a different beta feature flag or API
version replays as the same exchange even though the provider could legitimately have behaved
differently. Callers who need that distinguished can opt into
matcher.anthropic_header_matcher(), which folds anthropic-version/anthropic-beta into the
fingerprint while still collapsing rotating authorization/x-api-key auth — see matcher.py's
module docstring for the general RequestMatcher seam and its other opt-in presets
(gemini_matcher()/bedrock_matcher()/redacting_matcher()).
Validation scope
Read this before trusting any accuracy number here. The load-bearing, proven claim is the
bit-exact, hash-verified replay substrate (replay --check, verify, the spike receipt). The
causal/blame claims are validated on controlled, labeled fixtures — not real-world traces.
tracefork validate— is the engine genuinely causal? Yes, on a short control: injecting an outcome-flipping fault at any step makes the engine rank that step #1 (verified by also injecting at a non-root step), so 1.00 top-1 is not a fixed-slot artifact. The negative control is enforced with a hard threshold. It does not claim discrimination among competing causes.tracefork bench— does it discriminate competing causes? Mostly: a longer tape plants a root cause, a downstream echo that must not be blamed as root, and a necessary-not-sufficient conjunction. 10/11 resolve as planted. The one exception — single-ordering temporal Shapley under-crediting the earlier half of a symmetric conjunction on a strictly sequential tape — is reported bybenchitself ([LIMITATION]), pinned by a test, and closed when the same conjunction is recorded through a realasyncio.gather.
tracefork has not been run against any external benchmark — no dataset is ever downloaded (offline/$0 is non-negotiable). Read the numbers as: "the instrument reliably finds a single planted cause, and — with one named exception — discriminates among several on one longer run," not as a score on real multi-agent traces.
Scale envelope (measured)
The single-file HTML report inlines the entire tape as JSON — that's what makes tracefork report/tracefork serve a $0, dependency-free, share-as-one-file workflow, and it's also a real
ceiling: nobody hits it in the quickstart above (a handful of exchanges), but a long recorded run
eventually produces a large HTML file. Reports at or above DEFAULT_COMPRESSION_STEP_THRESHOLD
(50 exchanges) are automatically gzip+base64-compressed instead of embedded as indented,
HTML-escaped JSON; web/report.html decodes it client-side with the standard
DecompressionStream('gzip') Web API — no new dependency, same "single self-contained file"
guarantee, byte-for-byte identical rendered UI either way (generate_report's
compression_step_threshold parameter can move the line in either direction).
Measured on this repo's own scripted test fixtures (tracefork.tests.fakes, a deterministic
fake Anthropic transport — not a live model), a realistic-length multi-turn conversation:
| Exchanges | Tape size (SQLite) | Report, uncompressed | Report, compressed (default) | Ratio |
|---|---|---|---|---|
| 10 (below the 50-exchange default threshold — shown for comparison only) | 44 KiB | 115 KiB | not applied by default | — |
| 50 | 240 KiB | 980 KiB | 89 KiB | 11.0x |
| 100 | 696 KiB | 3.5 MiB | 482 KiB | 7.5x |
| 250 | 3.4 MiB | 21.3 MiB | 3.2 MiB | 6.7x |
| 400 | 8.1 MiB | 54.4 MiB | 8.2 MiB | 6.6x |
The compression ratio itself is content-dependent (repetitive tool output compresses better than
high-entropy content like already-compressed binaries or random identifiers) — read these as "a
400-exchange run went from ~54 MB to ~8 MB, a real difference for a file meant to be opened by
double-clicking it," not as a universal constant. Regenerate the table yourself: uv run pytest tests/test_report.py -k gzip -v exercises the same code path the numbers above came from.
Related work and scope
tracefork's 1.00 top-1 is measured on self-injected, known-root-cause faults — not a score on a public benchmark, and shouldn't be read as one. The field has an actual public benchmark for this exact task: Who&When (Zhang et al., ICML 2025 Spotlight) — 184 annotated real multi-agent failure logs with the ground-truth failing agent and step hand-labeled, MIT-licensed. On it, the best reported step-level failure-attribution accuracy is ~14.2%, against real (unlabeled-until-annotation, opaque-cause) multi-agent transcripts a method never gets to intervene on. tracefork's 1.00 top-1 is a different, easier question, asked a different way: given a tape it can re-execute and a fault it planted itself with a known ground-truth root cause, does perturb-and-rerun correctly rank that root cause #1? Both numbers are honest; they are not comparable, because the underlying task isn't the same — Who&When's methods judge a frozen log post hoc, tracefork's blame engine forks and re-runs a live agent.
That gap between post-hoc log judging and interventional (fork-and-rerun) attribution is exactly
where the field has been moving independently of this project: two mid-2026 papers reach the same
core thesis tracefork is built on — that causal responsibility for an agent failure is better
answered by intervention than by reading a transcript.
CausalFlow computes step-level Causal Responsibility
Scores via counterfactual intervention on execution traces;
Causal Agent Replay models an agent run as a structural
causal model and measures the outcome-distribution shift from a do-operation on one step,
explicitly benchmarking against Who&When's ~14% step-level SOTA. Neither is affiliated with this
project — they're independent confirmation that fork-and-rerun is the right shape for this
problem, arrived at from the research side while tracefork was built from the tooling side.
tracefork's contribution isn't the thesis; it's a hash-verified, bit-exact, $0 replay substrate
that makes the intervention provably faithful rather than merely plausible — see
How it works.
For interop rather than comparison: tracefork's OTel export (interop.py, tracefork export --format otel) targets the
OpenTelemetry GenAI semantic conventions
(gen_ai.* spans/attributes) as the vendor-neutral wire format for handing a recorded run to
other observability tooling — not a research citation, but the interop target these gen_ai.*
span names are chosen to match.
Integrations & advanced features
Each is opt-in and documented in its module docstring (and, where noted, a dedicated doc):
- Framework adapters — LangChain/LangGraph (incl. tape-backed LangGraph time-travel), OpenAI Agents SDK, CrewAI, AutoGen, Google ADK. Each keeps the byte seam at the httpx transport and uses the framework layer only for step structure.
- Providers — OpenAI, Gemini, and AWS Bedrock (a second, parallel botocore seam with SigV4 canonicalization and a standalone event-stream codec).
- Localhost proxy (
proxy.py) — a base-URL record/replay proxy for non-Python clients (curl, Node, Go). - Redaction (
redact.py) — opt-in secret/PII scrubbing; metadata redaction stays bit-exact-replayable, content redaction is marked forensic-only. - OTel / OpenInference interop (
interop.py) — export a run as agen_ai.*trace or OpenInference dataset; ingest an external trace's step structure (blame-by-re-execution, not bit-exact replay). - Trust receipt (
tracefork receipt) — an in-toto-shaped, JSON-safe evidence document + Shields.io badge, with absent evidence marked explicitly rather than defaulted to "verified." - Prune / retention (
tracefork prune) — soft-archive-only tape retention (never a hard delete). - Plugin API — a
Registry+ entry-point loader for custom matchers/oracles/providers/ serializers/adapters; nothing loads without explicit opt-in. Seedocs/plugin-api.md.
Layout
src/tracefork/        transport, tape, nondet, recorder, matcher, redact, fork, store,
                      blame, faults, validate, competing_faults, bench, report, server,
                      certificate, coverage, checkpoint, bundle, fsck, diff, receipt,
                      tournament, interop, observability, proxy, bedrock_transport,
                      eventstream, cli, adapters/, providers/
src/tracefork_spike/  the original bit-exact record/replay spike
web/report.html       the single-file UI: Timeline rail, Exchange Detail panel, and a
                      tabbed Blame/Forks/Cost analysis rail (both rails collapsible)
examples/             runnable demo that produces the report above
tests/                1641 offline tests ($0, no key)
experiments/          committed reference reports for the regression gates
Testing
uv run pytest -q                       # all 1641 offline tests
uv run tracefork validate --check      # regression-gate vs committed report
uv run tracefork replay --check experiments/replay_fixtures  # replay-corpus gate
uv run tracefork bench                 # competing-cause discrimination
Stability
tracefork follows Semantic Versioning; docs/stability.md
defines exactly what that covers — the tracefork.__all__ Python API, the CLI contract, the
tape on-disk format's backward-compatibility promise, the supported Python versions, and the
deprecation procedure — and what it explicitly doesn't (direct tracefork.<submodule> imports,
human-readable stdout formatting, the test-scaffolding modules).
Release receipt. The 1.0.0 release proves itself the same way the tool proves everything
else: docs/release_receipts/1.0.0.json
is tracefork release-receipt 1.0.0's own content-addressed evidence document, optionally
HMAC-signed (the receipt.py trust-receipt idiom applied at the repo/release level — see
Integrations below),
generated by re-running the real gates, not by hand: the full offline suite (1641 tests, 0
failures), a fresh $0 replay-fixture-corpus check (2/2 fixtures bit-exact and digest-matched),
validate (1.00 top-1 precision, 0.00 negative-control flip rate), bench (10/11 planted
causes resolved, the one documented [LIMITATION] from Validation scope above), and a 144-cell
Monte Carlo CI-coverage calibration sweep (ci_calibration.py) against blame.py's real
Wilson/Jeffreys/Clopper-Pearson/Agresti-Coull backends. Published honestly rather than
green-washed: 126/144 calibration cells clear their tolerance band, and the 18 that don't are
every one of them in the small-trial-count (n=5/10/20), near-0-or-1-true_p regime where
Wilson/Jeffreys/Agresti-Coull are documented to run slightly under nominal coverage — a known
property of those unmodified statistical backends, not a regression — so the receipt's own
calibration.all_within_tolerance is false and release-receipt's exit code is 1. Unsigned
(no TRACEFORK_RELEASE_SIGNING_KEY was set for this run) — an honest absent marker rather than
a fabricated signature.
Contributing
Contributions welcome — see CONTRIBUTING.md for dev setup, the invariants
a PR must respect, and commit/PR conventions. The whole dev loop is offline and $0. Please also
read the Code of Conduct.
Security
See SECURITY.md. In short: tapes are a versioned zstd +
content-addressed binary envelope with a JSON header (never pickle, so loading one can't
execute code), and tracefork serve binds to 127.0.0.1 only.
License
MIT — see LICENSE.
1 maintainer

Metadata
1 maintainer
Release files for tracefork 1.0.0
For a detailed explanation of source distributions (sdists) and built distributions (wheels), please see the package formats documentation.
Source distribution (sdist)
| File | Size | Uploaded | |
|---|---|---|---|
| tracefork-1.0.0.tar.gz | 1.2 MB | Details |
Built distribution (wheel)
| File | Interpreter | ABI | Platform | Reset |
|---|---|---|---|---|
| tracefork-1.0.0-py3-none-any.whl | Python 3 | none | any | Details |
Total release size: 1.7 MB
Release files / tracefork-1.0.0.tar.gz
| Download URL | tracefork-1.0.0.tar.gz |
|---|---|
| Size | 1.2 MB |
| Tags | Source |
|
SHA-256 checksum How to use checksums |
e38d12bd34ef3a7cf3b5b00d6a7d3812f39528d163b03332e868ac64bf49c7bf
|
|
BLAKE2b-256 checksum How to use checksums |
1319e4348105eb31bb66629cd13e350c3bc95b2a0120ae9a6c86b542f1903929
|
| Upload date | |
|
Uploaded using Trusted Publishing? What is trusted publishing? |
Yes |
| Uploaded via |
twine/7.0.0 CPython/3.13.14
|
Provenance
Provenance describes where a file came from. On PyPI, provenance is shared via attestations, which provide a verifiable record of the build or publishing details. View details, limitations and caveats.


PyPI Publish Attestation
PyPI verified that this artifact, at this checksum, originated from the publisher listed below.
Signed by GitHub Actions, verified by PyPI on Sep 3, 2026.
Transparency logRelease files / tracefork-1.0.0-py3-none-any.whl
| Download URL | tracefork-1.0.0-py3-none-any.whl |
|---|---|
| Size | 434.1 kB |
| Tags | Python 3 |
|
SHA-256 checksum How to use checksums |
d7593dc431b70bff7d918174b8316db56ff2ffc9ff664036ba6b8cabf7d96431
|
|
BLAKE2b-256 checksum How to use checksums |
39d83ef1a491911ce59f91ac8929e3566c4702a03b6267a2a423f11f842e853b
|
| Upload date | |
|
Uploaded using Trusted Publishing? What is trusted publishing? |
Yes |
| Uploaded via |
twine/7.0.0 CPython/3.13.14
|
Provenance
Provenance describes where a file came from. On PyPI, provenance is shared via attestations, which provide a verifiable record of the build or publishing details. View details, limitations and caveats.
PyPI Publish Attestation
PyPI verified that this artifact, at this checksum, originated from the publisher listed below.
Signed by GitHub Actions, verified by PyPI on Sep 3, 2026.
Transparency log













