
traceroutine
Process mining for LLM agent traces — where the tokens and the time actually go.
Observability platforms attribute spend by who: per user, per team, per API key.
traceroutine attributes it by how — per execution path.
An agent's cost is a property of its trajectory, not of its request.
One command, zero instrumentation
If you use Claude Code, the data is already on your disk. No exporter, no collector, no account, no arguments:
$ uvx traceroutine
reading ~/.claude/projects as claude-code — nothing leaves this machine
485 cases · 334 paths · $867.34 at list prices · rework 81.7% -> report.html
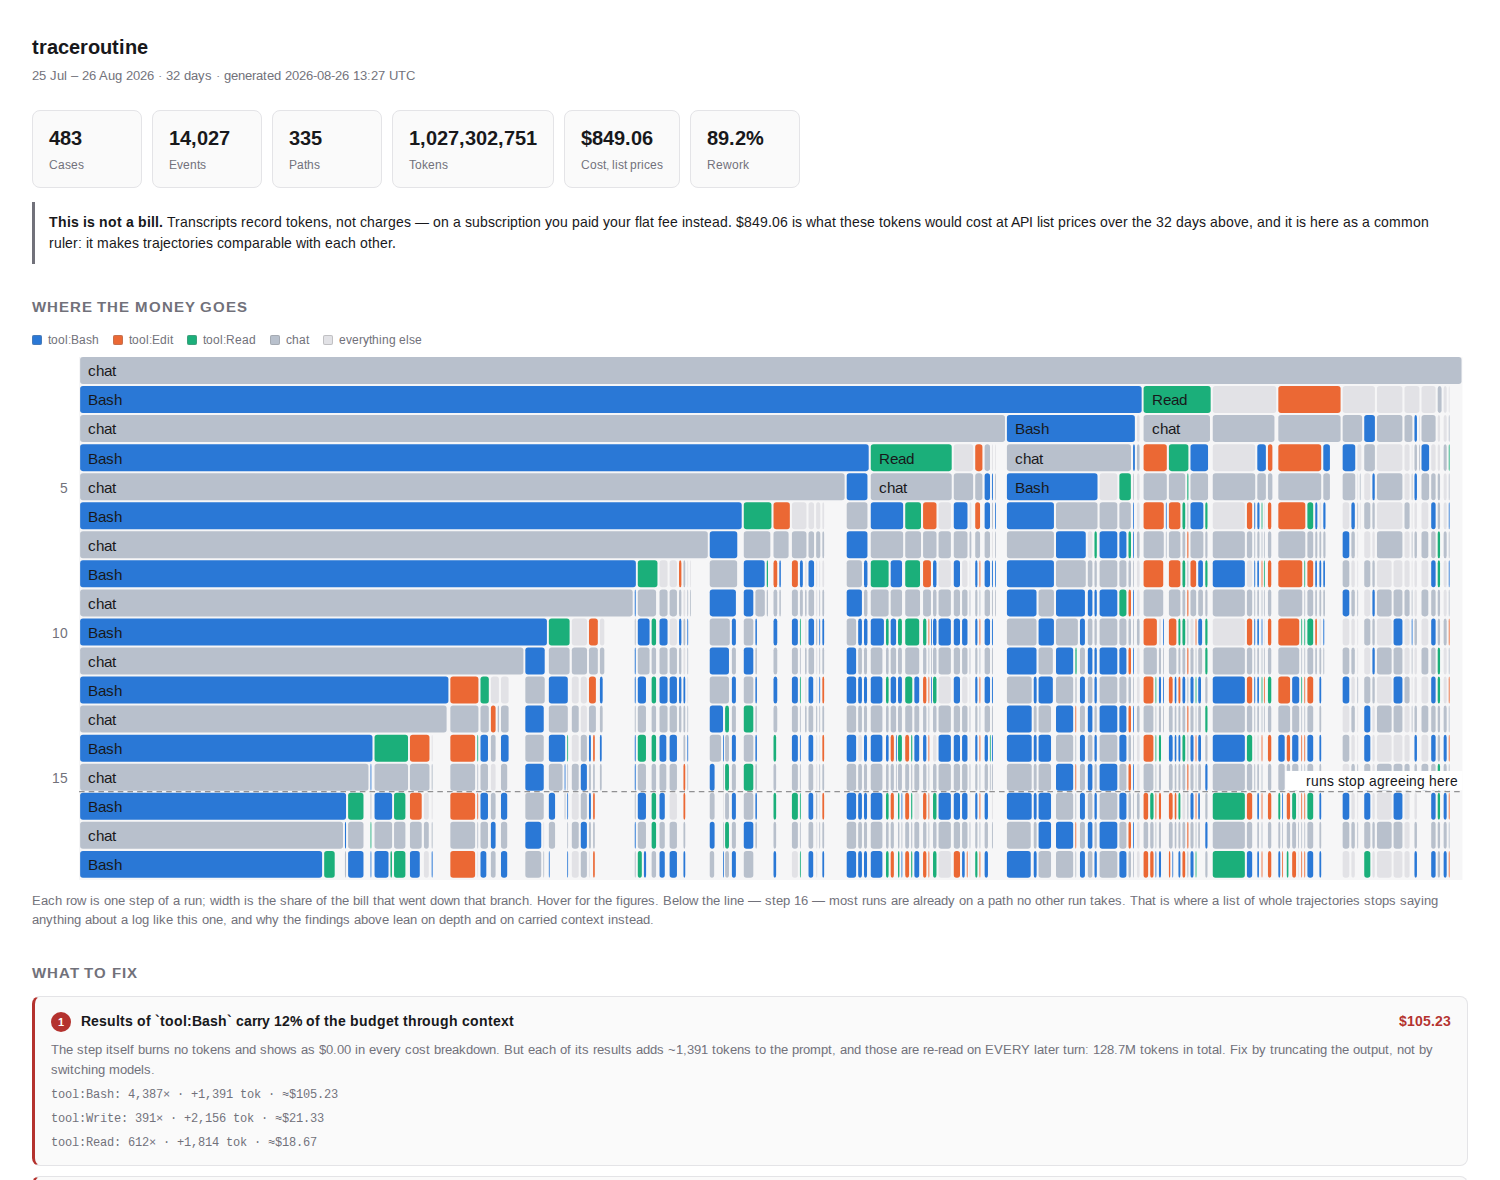
  1. Results of `tool:Bash` carry 12% of the budget through context (up to $107.54)
  2. Loop `chat → tool:Edit` runs an extra time (up to $51.33)
  3. Working rhythm `chat → tool:Bash` — 43% of the budget
Three seconds, and that is my own history. The first finding is the whole thesis:
Results of
tool:Bashcarry 12% of the budget through context. The step itself burns no tokens and shows as $0.00 in every cost breakdown. But each of its results adds ~1,388 tokens to the prompt, and those are re-read on every subsequent turn: 132M tokens carried in total. Fix by truncating output, not by switching models.
A tool call costs nothing when it happens and keeps costing for the rest of the run. That is why the unit of cost is the path, not the request.
Context re-reading is a known phenomenon — vendors document it. What is missing everywhere else is the attribution: not "context grows", but which step's results carried how many dollars across the rest of the trajectory.
The dollars are API list prices, not an invoice. I pay a $20 subscription, so this is what those tokens would have cost — which is its own small finding: a flat fee hides a month that prices out at $867. Cross-checked against ccusage on the same instant: the two agree to 0.05% on the total and to within 0.25% on every token category.
The shape of the work
A usage dashboard gives you a number. This gives you the shape it came from — the same
run as above, rendered by GitHub straight out of report -f md, no image involved:
flowchart TD
    S(["▶ start"])
    n0["chat<br/>7,158× · $867.34"]
    n1["tool:Bash<br/>4,573×"]
    n2["tool:Edit<br/>997×"]
    n3["tool:Read<br/>610×"]
    n4["tool:Write<br/>384×"]
    E(["■ end"])
    n0 -->|4408| n1
    n1 -->|4387| n0
    n0 -->|986| n2
    n2 -->|986| n0
    n0 -->|596| n3
    n3 -->|589| n0
    S -->|485| n0
    n0 -->|441| E
    n0 -->|382| n4
    n4 -->|380| n0
    n1 -->|143| n1
    classDef hot fill:#b4322e,stroke:#7d1f1c,color:#fff
    classDef err stroke:#d97706,stroke-width:3px
    class n0 hot
    class n1,n2,n3,n4 err
Everything returns to chat, because that is what a coding agent is: 4,408 calls out to
tool:Bash and 4,387 back. That traffic is the 43% of the budget in finding 3 — not an
anomaly but the working rhythm, and it only reads as a rhythm once it is drawn.
tool:Bash also follows itself 143 times — and those are not a loop. The gap between
them has a median of 0.000s, against 7.3s for chat → tool: one turn issued several
commands at once. Tools never call each other, so 97.5% of all transitions here are that
single alternation; the 2.3% that is not is parallelism, and it is the opposite of waste —
calls in one turn share a single reading of the prompt. Amber outlines mark activities
that produced errors.
Steps shown without a dollar figure spend no tokens at the moment of the call. That is not the same as free — their results stay in the prompt and are re-read on every later turn, which is finding 1 above.
That graph is the transitions. The picture at the top of this page is the trajectories: runs merged by their common start, each block as wide as the share of the bill that went down that branch. It is a flame graph with the stack replaced by the run, and it is there because a list of paths stops working on long runs — past step 16 in that log, most runs are already on a path no other run takes. Prefixes still agree long after whole paths have stopped.
Does it read my code?
A fair question: you are pointing a tool at your entire working history.
Nothing leaves your machine. The command above makes no network calls at all. There is no telemetry, no config in your home directory, no account.
What the event log holds: activity names (tool:Bash, chat), timestamps, token
counters, cost, opaque IDs, and the basename of the project directory. No message
text, no tool arguments, no file paths, no commands. That is enforced in the adapter
rather than in the report — because reports get shared — and it is tested:
test_no_message_content_leaks_into_spans, test_project_name_is_basename_only.
One command can talk to a cloud, and only if you ask it to. traceroutine abstract --backend anthropic sends the list of distinct activity names — a few dozen short
strings — to group them semantically. Nothing else: no events, no counters, no content.
The default path above never runs it. To see that list before trusting anyone with it,
look at the mapping: keys in activity_map.yaml; they are exactly what would be sent.
--backend ollama keeps the step on your own machine.
Install
uvx traceroutine                 # no install
pip install traceroutine         # or into your environment
When there is more to ask
The one-shot is ingest → abstract → report with sensible defaults. Each is also a
command, for when the defaults are not what you want:
ingest <src> |
traces → a canonical event log (parquet) |
abstract <log> |
raw span labels → activity_map.yaml, a semantic vocabulary |
report <log> |
findings + process graph: -f html or -f md |
check <log> |
conformance against a declared process.yaml; exit codes for CI |
diff <a> <b> |
compare two logs: a prompt release, a model swap, two cohorts |
- The guide — sources, the case notion that decides everything, the abstraction layer, what gets computed, architecture.
- Conformance — declaring how the agent is supposed to work, and failing CI when it stops doing that. This is the part no dashboard does.
Reading a log other than Claude Code's: traceroutine --from <file-or-directory>.
OpenTelemetry JSON and OpenAI-style chat transcripts are detected automatically.
When this will not help you
Stated up front, because a tool that always returns five findings eventually returns five invented ones.
Variant analysis has a measured limit. Path uniqueness climbs from 17% at 1–3 steps
to 100% at 26+. Above roughly 13 steps trajectories stop repeating, and "rare paths eat
the budget" becomes the tautology "expensive runs are expensive". So the variant lens
fits short structured agents — RAG, support, routing — and not long ones. When repeated
paths drop below 50%, traceroutine says so and suppresses those findings instead of
dressing up a tautology.
What still works on long runs: context inflation, cohort diff, and conformance — all
three get stronger with trace length rather than degenerating.
Status
Alpha, and honest about it: it runs end to end on three sources, its cost accounting agrees with an independently written tool to within 0.1%, and it has 153 tests. The interactive graph renderer is not built yet.
License
Apache-2.0
1 maintainer

Metadata
1 maintainer
Release files for traceroutine 0.5.0
For a detailed explanation of source distributions (sdists) and built distributions (wheels), please see the package formats documentation.
Source distribution (sdist)
| File | Size | Uploaded | |
|---|---|---|---|
| traceroutine-0.5.0.tar.gz | 299.2 kB | Details |
Built distribution (wheel)
| File | Interpreter | ABI | Platform | Reset |
|---|---|---|---|---|
| traceroutine-0.5.0-py3-none-any.whl | Python 3 | none | any | Details |
Total release size: 397.2 kB
Release files / traceroutine-0.5.0.tar.gz
| Download URL | traceroutine-0.5.0.tar.gz |
|---|---|
| Size | 299.2 kB |
| Tags | Source |
|
SHA-256 checksum How to use checksums |
de585eec0d015fafcebccadae1ca9a01220ebb5abfada2487a6d7ef3a84b7f15
|
|
BLAKE2b-256 checksum How to use checksums |
68ed2aa8ac19741190810564b4c905faae710a8056807e28063a7ce959ff436a
|
| Upload date | |
|
Uploaded using Trusted Publishing? What is trusted publishing? |
No |
| Uploaded via |
uv/0.10.7 {"installer":{"name":"uv","version":"0.10.7","subcommand":["publish"]},"python":null,"implementation":{"name":null,"version":null},"distro":{"name":"Ubuntu","version":"24.04","id":"noble","libc":null},"system":{"name":null,"release":null},"cpu":null,"openssl_version":null,"setuptools_version":null,"rustc_version":null,"ci":null}
|
Release files / traceroutine-0.5.0-py3-none-any.whl
| Download URL | traceroutine-0.5.0-py3-none-any.whl |
|---|---|
| Size | 98.0 kB |
| Tags | Python 3 |
|
SHA-256 checksum How to use checksums |
deadf8b74ba583e56e8e79cad92c611a54cec06a25bbe226a863b278e7ec00d4
|
|
BLAKE2b-256 checksum How to use checksums |
57daa1d5959dbfb7e41be4aa82a3d60c7688486184be5ea98c59eb637c681ed4
|
| Upload date | |
|
Uploaded using Trusted Publishing? What is trusted publishing? |
No |
| Uploaded via |
uv/0.10.7 {"installer":{"name":"uv","version":"0.10.7","subcommand":["publish"]},"python":null,"implementation":{"name":null,"version":null},"distro":{"name":"Ubuntu","version":"24.04","id":"noble","libc":null},"system":{"name":null,"release":null},"cpu":null,"openssl_version":null,"setuptools_version":null,"rustc_version":null,"ci":null}
|














