
🐙 TraceWeave
English · 简体中文

Workflow-oriented MCP server for evidence-driven RTL simulation debugging





Connect compile evidence, logs, waveforms, source, and elaborated connectivity in one verifiable debug workflow.
TraceWeave turns local VCS/Xcelium simulation artifacts into a guided investigation. It discovers the active compile, simulation, and VCD/FSDB waveform inputs; builds the compiled hierarchy and an independent structural-risk view; normalizes failures; runs a whole-design runtime handshake sweep; and recommends the next evidence-gathering call.
For driver, load, structural-path, and X/Z-source questions, TraceWeave uses a provenance-preserving backend ladder: trusted Verdi NPI when a usable KDB is available, a bounded on-demand Slang Source Graph when NPI is unavailable or inconclusive, and Legacy Static as the final fallback. Results expose backend provenance, coverage, truncation, and fallback status rather than turning partial evidence into certainty.
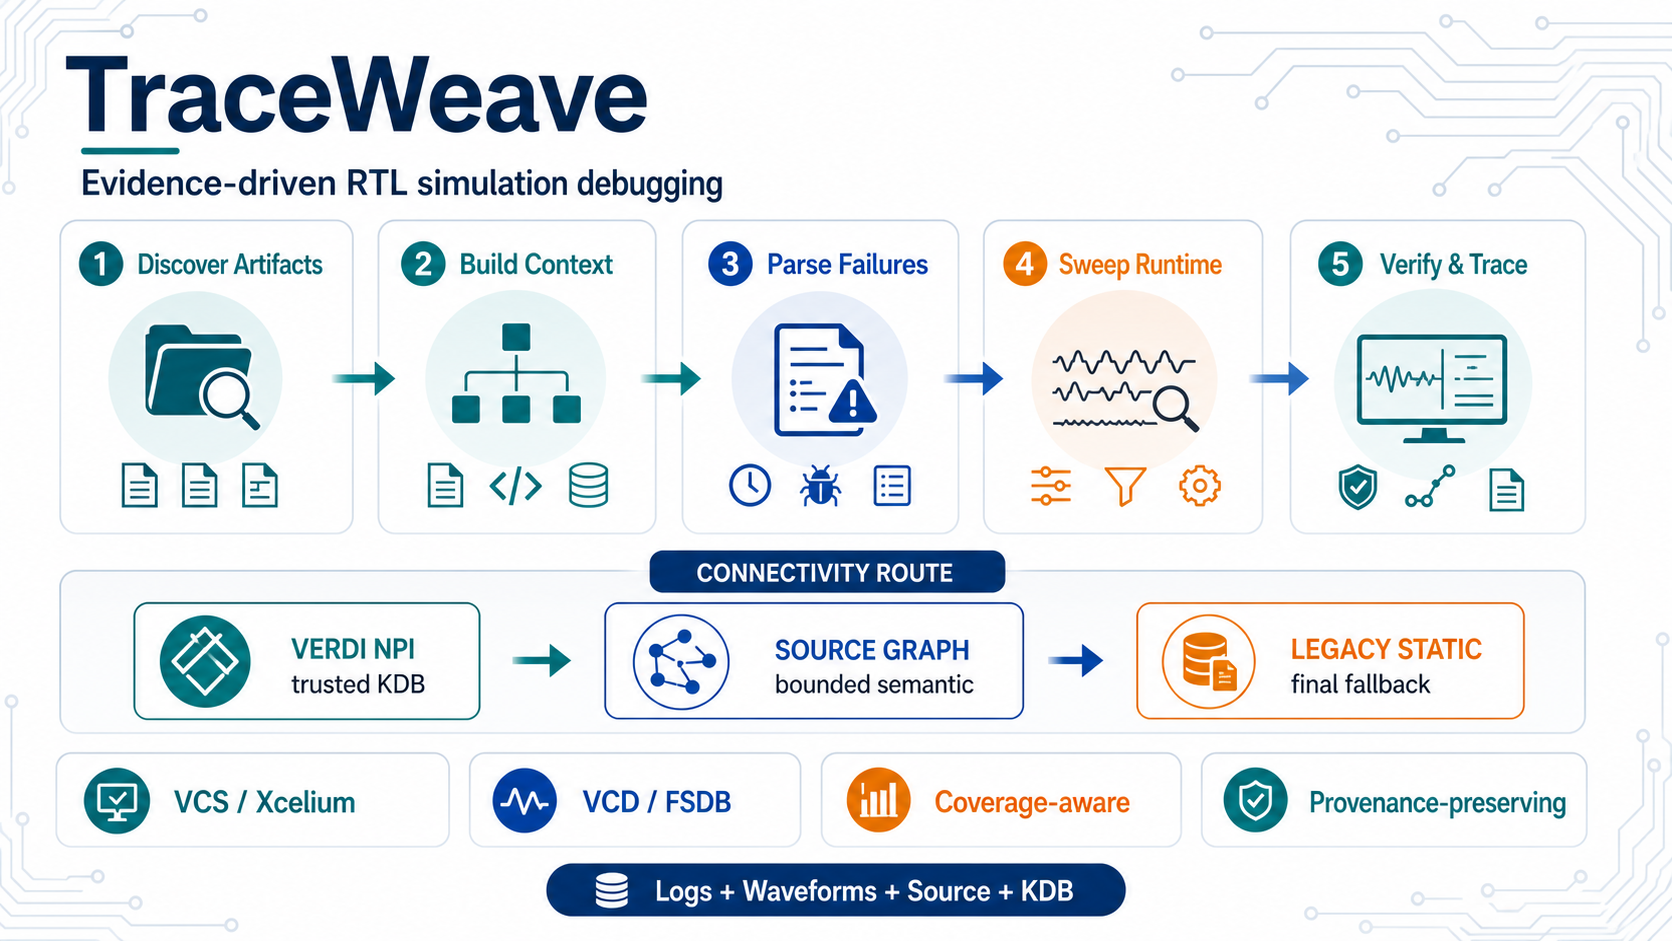
Default workflow and connectivity-routing overview; every conclusion remains bounded by reported coverage.
TraceWeave is a workflow-oriented debug server rather than a loose collection of parsers. It combines:
- A guided MCP workflow from artifact discovery through parallel hierarchy/structural analysis, failure parsing, runtime protocol scanning, and focused verification
- Compile-evidence hierarchy construction, handle-based browsing, and source-aware structural analysis
- VCD/FSDB point, transition, window, cycle, divergence, and period queries
- Whole-design handshake scanning, targeted protocol checks, temporal predicates, and transaction reconstruction
- Driver/load/path/X tracing through
trusted NPI -> bounded Source Graph -> Legacy Static - Structured next actions plus coverage, provenance, truncation, and resource receipts designed for MCP clients
Architecture · Installation · Client Setup · Standard MCP Workflow · Tool Quick Reference · Testing · WeChat
When TraceWeave helps most
TraceWeave adds the most value when debugging requires correlating evidence across artifacts rather than reading one obvious RTL line. It is especially useful for:
- Opaque runtime symptoms such as timeouts, hangs, scoreboard mismatches, X/Z propagation, first divergence, or a broken cadence. Waveform queries and protocol/transaction analysis locate the first bad time, interface, or beat.
- Cross-hierarchy cause-and-effect questions where a suspicious signal must be followed through ports, interfaces, assignments, drivers, and consumers.
- Large or interface-rich designs where whole-design handshake sweeps and bounded hierarchy/Source Graph scopes reduce an otherwise open-ended search.
- Falsifiable hypothesis checks that need a concrete witness or
counterexample from
verify_window, divergence, period, handshake, or reconstructed-transaction evidence. - License-constrained environments where Source Graph provides semantic connectivity without NPI, while a usable KDB can still enable deeper local or LSF-hosted Verdi NPI analysis.
For a small readable block with an obvious source-local logic error, direct source and log inspection may be faster. TraceWeave also cannot reveal behavior absent from every available source, log, waveform, and KDB artifact; with protected IP it can follow only the evidence exposed at visible boundaries, in the waveform, or in the elaborated database.
Architecture
- Architecture map:
docs/architecture.md - New-session bootstrap: read
AGENTS.mdfirst, then follow its first-read file list - Fast path for code understanding:
server.pyconfig.pysrc/analyzer.pysrc/log_parser.pysrc/fsdb_parser.py
Repository Layout
TraceWeave/
├── config.py                 # Environment-sensitive constants and discovery rules
├── server.py                 # MCP entry point, session state, and workflow gating
├── custom_patterns.yaml      # User-extensible log patterns
├── fsdb_wrapper.cpp          # Native FSDB wrapper source
├── build_wrapper.sh          # Builds libfsdb_wrapper.so
├── scripts/                  # setup_fsdb.sh / verify_fsdb.sh
├── tests/                    # Unit and integration tests
└── src/
    ├── path_discovery.py
    ├── compile_log_parser.py
    ├── tb_hierarchy_builder.py
    ├── vcd_parser.py
    ├── fsdb_parser.py
    ├── fsdb_signal_index.py
    ├── waveform_batch.py         # FSDB+VCD time-window batch reader
    ├── log_parser.py
    ├── analyzer.py
    ├── signal_driver.py
    ├── signal_load.py            # Load/fanout finder, Static + NPI
    ├── connectivity_backend.py   # ConnectivityBackend protocol + select_backend
    ├── verdi_backend.py          # KDB / license probe + kdb_hint generator
    ├── verdi_npi_backend.py      # NPI-backed driver/load/path resolution
    ├── npi_lsf.py                # Optional LSF transport + Verdi/NPI worker protocol
    ├── npi_worker.py             # Compute-node Verdi/NPI worker entry point
    ├── kdb_builder.py            # Auto-build Verdi KDB (vericom + elabcom) for Xcelium flows
    ├── structural_scanner.py
    ├── x_trace.py
    ├── cycle_query.py
    ├── schemas.py
    ├── problem_hints.py
    ├── hierarchy_provider.py     # Bounded lexical/semantic instance-binding views
    ├── hierarchy_handles.py      # HandleStore + content-addressed handle for build_tb_hierarchy
    ├── handle_tools.py           # get_tb_subtree / lookup_tb_files / find_tb_instance / ...
    ├── cursor_store.py           # Named, process-scoped time anchors (cursor_set/list/delete)
    ├── timespec.py               # Resolve @cursor / unit literals (12.34ns) to ps on time inputs
    ├── verify_condition.py       # diff_first_divergence, period, inspect_handshake
    ├── window_verify.py          # verify_window: temporal predicate over a clock window
    ├── handshake_suggest.py      # suggest_handshakes / suggest_protocol_bundles
    ├── handshake_sweep.py        # sweep_handshakes: whole-design handshake anomaly sweep
    ├── txn_reconstruct.py        # reconstruct_transactions: id-correlated transaction layer
    ├── cancellation.py           # Cooperative cancellation for worker-thread waveform scans
    └── usage_telemetry.py        # Local-only per-call usage telemetry (default off; opt-in)
Installation
TraceWeave requires Python 3.11+.
Standard PyPI installation
Install the base MCP runtime and launch the stdio server from any directory:
python -m pip install traceweave-mcp
traceweave-mcp
The base package includes log/VCD analysis and the unlicensed Python fallback stack. To add the pinned open-source Source Graph frontend:
python -m pip install "traceweave-mcp[source-graph]"
pyslang is intentionally an optional dependency: the server starts without
it and reports a structured Source Graph dependency blocker before falling
back to Legacy Static. PyPI distributions do not contain Synopsys or Cadence
binaries, FSDB runtime libraries, license data, VCS/Xcelium, or Verdi NPI.
Those capabilities continue to depend on the user's locally licensed EDA
installation and environment.
The Official MCP Registry distribution uses the name
io.github.gokeshenzhen/traceweave
After publication, use that exact name or traceweave in the registry search
box.
Repository-local EDA installation
For the full local EDA workflow, especially the repo-built FSDB wrapper and repo-local Verdi runtime links, clone this repository and use the existing setup below. This remains the recommended setup on simulation hosts.
The recommended installation includes the pinned pyslang frontend used by
Source Graph and keeps all Python packages in a repository-local .venv:
bash scripts/setup_source_graph.sh
The script installs requirements-source-graph.txt (the MCP runtime, PyYAML,
and pyslang==11.0.0) into .venv. Run it after the initial clone and rerun it
after a pull that changes that requirements file. It is idempotent, never edits
shell or MCP client configuration, and prints the absolute interpreter path and
optional Codex / Claude registration commands when it succeeds. Its read-only
check mode performs no installation:
bash scripts/setup_source_graph.sh --check
For a minimal installation without the optional Source Graph frontend:
python3.11 -m pip install "mcp==1.27.0" pyyaml --user
For FSDB support, one of these runtime sources must be available:
- Repo-local runtime:
third_party/verdi_runtime/linux64/libnsys.soandlibnffr.so - External Verdi installation exposed via
VERDI_HOME/share/FsdbReader/linux64
If neither is available, TraceWeave still works, but FSDB parsing is disabled and the workflow should prefer .vcd waveforms.
Enable FSDB support (links the Verdi runtime into the repo and builds
libfsdb_wrapper.so in one step):
# Example only — replace with your site's Verdi install path
export VERDI_HOME=/path/to/verdi
bash scripts/setup_fsdb.sh
After
git pull:libfsdb_wrapper.sois built locally, not tracked in git. If a pulled update changedfsdb_wrapper.cpp, the first FSDB query fails with a "libfsdb_wrapper.so is outdated" error — rebuild withbash build_wrapper.shand reconnect the MCP server. This is deliberately fail-loud: an outdated wrapper could silently return misaligned timestamps. Rebuilding is also required to activate the optional FSDB transition-group optimization used bysweep_handshakes.
Verify the runtime and wrapper load correctly. This script does not
require $VERDI_HOME and is safe to run on any host that already has the
repo-local artefacts:
bash scripts/verify_fsdb.sh
Client Setup
Generic MCP Client
Any MCP client that supports stdio transport can connect to this server. The minimum configuration is:
- PyPI installation: command
traceweave-mcp, args[] - Repo-local installation: command
<TRACEWEAVE_HOME>/.venv/bin/pythonafter runningscripts/setup_source_graph.sh(python3.11remains valid for a separately managed minimal environment), args["<TRACEWEAVE_HOME>/server.py"] - env: provide either repo-local
third_party/verdi_runtime/linux64orVERDI_HOMEif FSDB support is required
If the client supports server instructions, it can follow the built-in workflow directly. Otherwise, use the workflow below.
Claude Code
Environment inheritance depends on how the MCP client itself is launched and on
that client's environment policy. In one tested terminal-launched tcsh/LSF
setup, Claude Code passed the shell-configured LSF, Verdi, and license variables
to TraceWeave, and remote NPI driver/load/path queries worked without a separate
MCP environment list. An IDE/GUI launch or another client setup may not inherit
the same environment. For a deterministic Claude Code setup, list every variable
the server needs — tool roots plus the dlopen chain (LD_LIBRARY_PATH is the
one most often missed; without it NPI silently falls back to Static and
trace_signal_path returns found: false).
Add this to ~/.claude.json:
{
  "mcpServers": {
    "TraceWeave": {
      "command": "<TRACEWEAVE_HOME>/.venv/bin/python",
      "args": ["<TRACEWEAVE_HOME>/server.py"],
      "env": {
        "VERDI_HOME": "<verdi-install>",
        "NOVAS_HOME": "<verdi-install>",
        "VCS_HOME": "<vcs-install>",
        "XLM_ROOT": "<xcelium-install>",
        "CDS_INST_DIR": "<xcelium-install>",
        "SNPSLMD_LICENSE_FILE": "xxxx@s-license.example.com",
        "LM_LICENSE_FILE": "xxxx@s-license-server.example.com",
        "CDS_LICENSE_FILE": "xxxx@c-license.example.com",
        "LD_LIBRARY_PATH": "<library-path>",
        "PATH": "<path>"
      }
    }
  }
}
Verify the connection:
claude mcp list
# Should show TraceWeave (connected)
Codex
Codex supports two ways to provide environment variables to the TraceWeave MCP server:
- Put fixed values in
[mcp_servers.TraceWeave.env]. This suits stable tool and license locations, or a Codex process that is not launched from a configured terminal. - Use
env_varsto allow and forward variables already inherited by the Codex process. This suits EDA environments managed by.bashrc,.tcshrc, or a site setup script.
Choose one source for each variable; do not configure the same name in both
env and env_vars. This matches the official
Codex MCP configuration. The example
below uses fixed values in ~/.codex/config.toml:
[mcp_servers.TraceWeave]
command = "<TRACEWEAVE_HOME>/.venv/bin/python"
args = ["<TRACEWEAVE_HOME>/server.py"]
cwd = "<TRACEWEAVE_HOME>"

[mcp_servers.TraceWeave.env]
VERDI_HOME = "<verdi-install>"
NOVAS_HOME = "<verdi-install>"
VCS_HOME = "<vcs-install>"
XLM_ROOT = "<xcelium-install>"
CDS_INST_DIR = "<xcelium-install>"
SNPSLMD_LICENSE_FILE = "xxxx@s-license.example.com"
LM_LICENSE_FILE = "xxxx@s-license-server.example.com"
CDS_LICENSE_FILE = "xxxx@c-license.example.com"
LD_LIBRARY_PATH = "<library-path>"
PATH = "<path>"
If a site setup script manages these values, do not copy its expanded values
into env. Launch Codex from the configured terminal and use the inherited
environment pattern in the LSF-only section below instead.
Verify the connection:
codex mcp list
# Should show TraceWeave with Status: enabled
LSF-only NPI licenses
Some EDA sites grant Verdi/NPI licenses only to scheduled compute nodes. NPI execution remains local by default; opt in to LSF at the TraceWeave MCP server process with:
export TRACEWEAVE_NPI_EXECUTION=lsf
export TRACEWEAVE_NPI_LSF_QUEUE="digital"
Here digital is only an example; replace it with the user's licensed team
queue. TraceWeave reads only the namespaced TRACEWEAVE_NPI_LSF_QUEUE; it does
not create, overwrite, or interpret a site's generic LSF_QUEUE. If the site
already exports LSF_QUEUE, the user may map that existing value instead:
export TRACEWEAVE_NPI_LSF_QUEUE="$LSF_QUEUE"
For tcsh:
setenv TRACEWEAVE_NPI_EXECUTION lsf
setenv TRACEWEAVE_NPI_LSF_QUEUE "digital"
Or, only when LSF_QUEUE already exists:
setenv TRACEWEAVE_NPI_LSF_QUEUE "$LSF_QUEUE"
Putting these values in .bashrc / .tcshrc works only when the MCP client
passes that shell environment to the TraceWeave server. In the tested
terminal-launched setup, Claude Code did so and completed LSF-hosted NPI
driver/load/path queries. Codex required the needed site variables to be named
in env_vars; without them, the NPI attempt failed.
The following Codex configuration is for an EDA environment already established
by the parent shell. It is an alternative to the fixed-value EDA block in the
Codex section above. The list reflects one tested LSF/EGO site; add or remove
names to match the site's setup, and do not repeat any name under env:
[mcp_servers.TraceWeave]
command = "<TRACEWEAVE_HOME>/.venv/bin/python"
args = ["<TRACEWEAVE_HOME>/server.py"]
cwd = "<TRACEWEAVE_HOME>"
env_vars = [
  "TRACEWEAVE_NPI_LSF_QUEUE",

  "LSF_ENVDIR",
  "LSF_BINDIR",
  "LSF_SERVERDIR",
  "LSF_LIBDIR",
  "PATH",

  "EGO_TOP",
  "EGO_BINDIR",
  "EGO_CONFDIR",
  "EGO_ESRVDIR",
  "EGO_LIBDIR",
  "EGO_LOCAL_CONFDIR",
  "EGO_SERVERDIR",

  "VERDI_HOME",
  "LD_LIBRARY_PATH",

  "LM_LICENSE_FILE",
  "SNPSLMD_LICENSE_FILE",
]

[mcp_servers.TraceWeave.env]
TRACEWEAVE_NPI_EXECUTION = "lsf"
Values under [mcp_servers.TraceWeave.env] are copied literally by Codex, so do not write
TRACEWEAVE_NPI_LSF_QUEUE = "$LSF_QUEUE" there. env_vars is the supported
way to forward the value that the user's shell already expanded. If the Codex
parent does not inherit the shell environment, omit the queue from env_vars
and put a fixed TRACEWEAVE_NPI_LSF_QUEUE = "digital" directly under
[mcp_servers.TraceWeave.env] instead. If some EDA values are intentionally
fixed under env, omit those same names from env_vars.
In the tested terminal-launched Claude Code setup, no extra MCP environment map
was needed when the shell already exported both namespaced values and the full
site environment. For a deterministic setup, or when the client does not inherit
that shell, merge the following fixed values into the existing TraceWeave
server's "env" object (replace digital with the user's queue):
{
  "TRACEWEAVE_NPI_EXECUTION": "lsf",
  "TRACEWEAVE_NPI_LSF_QUEUE": "digital"
}
JSON values are literal too; do not put "$LSF_QUEUE" in this static map.
With this mode enabled, explicit connectivity operations
(explain_signal_driver, find_signal_loads, trace_signal_path,
trace_x_source) and every build_kdb cache miss or forced rebuild submit a
short bsub -K worker. Exact KDB cache hits, log parsing, waveform reads,
structural scans, KDB detection, and Static analysis remain local because they
do not invoke a licensed Verdi executable. Connectivity-worker failure or
timeout falls through to the local Source Graph and then to Legacy Static if
that bounded graph is unavailable or inconclusive. A KDB-build worker failure
does not fall back to local vericom/elabcom; build_kdb returns a fixed
failure receipt instead. Static still has no
path API, so a final path fallback is explicitly unsupported. Routing is visible through fixed
backend_status.execution_mode / scheduler_status / worker_status /
fallback_reason labels; queue, host, command, and license details are not
returned.
After restarting or reconnecting the MCP server, ask the AI agent to run one
explicit connectivity operation and report backend_status. A successful LSF
NPI call has execution_mode="lsf", scheduler_status="completed",
worker_status="completed", and actual_backend="verdi_npi". Otherwise inspect
fallback_reason; a Static fallback is not an exact NPI result.
For an Xcelium KDB cache miss, build_kdb exposes the same top-level
execution_mode / scheduler_status / worker_status / fallback_reason
labels. A successful remote build reports execution_mode="lsf" and both
statuses as "completed"; a cache hit reports both statuses as
"not_started" because no license-bearing process ran.
An error-marked KDB may still complete the worker successfully. In that case
actual_backend="verdi_npi" is paired with kdb_degraded=true; read the NPI
attempt's coverage_status="partial" and the kdb_error_count /
kdb_error_log diagnostics rather than treating scheduler completion alone as
proof of complete elaboration.
Optional settings:
export TRACEWEAVE_NPI_LSF_TIMEOUT=120
export TRACEWEAVE_NPI_LSF_KDB_TIMEOUT=1260
export TRACEWEAVE_NPI_LSF_BSUB=/path/to/bsub
export TRACEWEAVE_NPI_LSF_BKILL=/path/to/bkill
export TRACEWEAVE_NPI_LSF_PYTHON=/path/to/python3.11
export TRACEWEAVE_NPI_LSF_STAGING_DIR=/shared/private/traceweave-npi
export TRACEWEAVE_NPI_LSF_EXTRA_ARGS_JSON='["-R", "select[...]"]'
The compile log, every source/include input, TraceWeave checkout/installation,
staging directory, and TRACEWEAVE_CACHE_DIR (including the generated KDB)
must be visible at the same absolute paths on the submission and compute nodes.
After a remote success the parent verifies that the returned KDB path is
visible; otherwise it reports npi_lsf_artifact_unavailable. The staging
directory defaults under TraceWeave's cache root; set it explicitly when that
cache is not on a shared filesystem. TRACEWEAVE_NPI_LSF_TIMEOUT controls
short connectivity jobs; TRACEWEAVE_NPI_LSF_KDB_TIMEOUT separately bounds
queue wait plus both KDB phases (default 1260 seconds). Scheduler options are
JSON argv, not shell text, and are limited to scheduler option/value pairs.
On-Demand Source Graph
explain_signal_driver, find_signal_loads, trace_signal_path, and
trace_x_source use the production route
Verdi NPI -> Source Graph -> Legacy Static. Source Graph is lazy and
process-local: the first eligible request starts one isolated, short-lived
frontend worker, successful scoped IR enters the server's bounded memory cache,
and same-key cold requests share one build. Artifact identity is independent of
the query target; QueryIdentity remains target-specific. By default it neither
builds nor scans a cache at startup, does not use disk persistence, does not hold
an FSDB/VCD lock, and does not import pyslang into the MCP server.
For trace_x_source, a trusted NPI result remains authoritative. An internal
NPI fallback discards the partial propagation chain and restarts from the root
with one bounded Source Graph artifact. Multiple driver targets inside its
proved scope reuse that artifact. If a new X-bearing target requires a larger
scope, only the exact hierarchy ancestor union is added and the Source Graph
trace restarts; facts from the smaller artifact are discarded. Build/query
failure, an unsafe scope explanation, or a coverage-incomplete negative causes
a whole-trace Static restart. Cancellation never advances the fallback chain.
For a path request, the adapter proves both hierarchy ancestor chains share one
top and projects only their ancestor union through the lowest common ancestor;
it does not enumerate unrelated siblings or the full design. The query returns a
deterministic shortest-hop structural path over supported IR bindings and
combinational dependencies. The BFS queue stores one selection plus one
predecessor hop per first-discovered state, then reconstructs the selected path
once; it never duplicates every complete path prefix across the frontier. A
partial positive remains partial. Only a coverage-complete negative is
not_connected; inconclusive or truncated negatives continue to Static's
structured unsupported result. expand_assigns only exposes real IR/source
assignment evidence and does not change whether the endpoints are connected.
While build_tb_hierarchy reads sources and resolved includes, it captures a
private immutable compile-session snapshot containing only content digests,
stat identities, byte counts, and fixed-label semantic markers--never source
text. When the default parallel build_tb_hierarchy and
scan_structural_risks calls overlap on the same compile identity, a transient
single-flight index lets both consume text and exact digest/stat/marker facts
from one physical read. It is bounded, process-memory only, and clears all
source bodies as soon as the final active call releases it; hierarchy handles
and results retain only compact facts. The first Source Graph request reuses
every still-current record instead of reopening that file, reported as
fingerprint_cache_disposition=miss_reused_compile_session; support inputs not
seen by hierarchy are still read and hashed normally. This includes
simulator/frontend replay-only tool-library inputs (for example uvm_pkg.sv
expanded from VCS -ntb_opts uvm), which are not project hierarchy evidence.
Every original project input must still have a current snapshot record. Later
requests reuse the bounded in-memory manifest as hit_session_snapshot. Every
reused record is stat-validated, and a changed source blocks the stale
hierarchy/manifest pair with compile_session_snapshot_changed; rebuild and
refresh the hierarchy before querying. A changed compile log or refreshed
hierarchy handle likewise invalidates the snapshot.
For a large, complete Verilog/SystemVerilog manifest, the adapter can derive a
compile-input closure from the hierarchy scan facts already held by that
handle: the proved ancestor definitions, explicit compile tops/bind tops,
package imports and qualified package references, and compile-order macro
definitions/undefinitions. Slang remains the parser and elaborator; this
planner is not a replacement compiler. The full ordered manifest and content
fingerprint remain the artifact's invalidation identity, while only the
ordered closure is sent to the isolated worker and only the requested design
top is elaborated. Missing or ambiguous proof, incomplete/mixed-language
inputs, duplicate inputs, or a closure that is too large safely retains the
full replay. Adapter receipts expose only fixed-label/count telemetry under
manifest.compile_projection. Every applied closure adds
compile_projection_pruned_inputs, so its graph is explicitly
inconclusive: IR-proved positive driver/load/path facts remain usable, but an
empty result can never establish no_driver, no_load, or not_connected.
For a deep recursive driver query, or a load query with an explicit depth above
one, the first large-manifest projection may include the target leaf's adjacent
siblings instead of waiting for a failed narrow query and rebuilding. This is a
bounded admission policy, not a general subtree expansion: the parent and every
direct child must be proved by the hierarchy; at most 32 new instances and 24
additional closure inputs are admitted; and a base closure of at least 32 inputs
may grow by no more than 25%. The existing
TRACEWEAVE_SOURCE_GRAPH_FRONTIER_MAX_INSTANCES cap also applies. Shallow
queries, full-manifest replay, bounded bootstrap, unresolved hierarchy, or any
costlier shape keeps the exact ancestor artifact. If runtime evidence still
requires another frontier, the proactively admitted parent is retained in the
next exact ancestor union, so no scope or fact from two artifacts is mixed.
This changes only preparation scheduling: coverage exclusions, fingerprints,
single-artifact provenance, public inputs, and result schemas are unchanged.
Repeated deep queries below one proved parent can optionally reuse a bounded Slang semantic session while still publishing a separate narrow IR for each scope. This accelerator is guarded and disabled by default:
export TRACEWEAVE_SOURCE_GRAPH_SEMANTIC_SESSION=1
export TRACEWEAVE_SOURCE_GRAPH_SEMANTIC_SESSION_IDLE_TTL=60
export TRACEWEAVE_SOURCE_GRAPH_SEMANTIC_SESSION_MAX_RSS_BYTES=805306368
export TRACEWEAVE_SOURCE_GRAPH_SEMANTIC_SESSION_MAX_INSTANCES=64
export TRACEWEAVE_SOURCE_GRAPH_SEMANTIC_SESSION_MAX_INPUTS=256
The adapter keeps the artifact narrow and binds it to a separately proved parent context within the instance/input caps. One isolated child retains at most one exact source/options/top/snapshot context; a second eligible scope projects from that root without reparsing. A context change restarts the child, 60 seconds of inactivity evicts it, and cancellation, timeout, crash, protocol failure, or either live/reported RSS limit breach destroys the whole session without publishing a partial artifact. A frontier outside the retained context uses the historical one-shot worker and leaves the parent session available. Only compact scoped IR enters memory or the optional disk cache; Slang state never enters the MCP process or disk. Additive numeric receipts report session hits, misses, restarts, evictions, and frontend launches. Requests that lack a complete bounded context retain the default one-shot behavior.
Use scripts/soak_source_graph_semantic_session.py before changing that
default. It accepts an external list of 20--100 unique exact deep driver/load
queries and compares the current one-shot lifecycle with the production
persistent runner in two fresh processes. The aggregate-only report checks
fact/status/coverage equivalence, launch and reuse counts, sequence and first-
query latency, break-even ordinal, tail latency, RSS cap/growth, failures, and
evictions. A passing single-design run still sets default_on_authorized=false;
representative eligible designs and real query-frequency evidence are required
to justify retaining the frontend process. If bounded adjacent expansion
already produces one reusable compact artifact, the workload is reported as
not_needed_existing_artifact_scope instead of counting memory-cache hits as
semantic-session hits. Run the script with --help for its full invocation.
VCS flows that split source compilation and elaboration across logs can build one context explicitly. Keep the source-compile log as the primary path (and use it for the structural scan), then supply the other source/elaboration logs in their build order:
build_tb_hierarchy(
  compile_log=".../comp.log",
  supplementary_compile_logs=[".../vhdl_comp.log", ".../elab.log"],
  simulator="vcs",
)
The resulting handle, hierarchy snapshot, and Source Graph compile fingerprint
cover every log and every ordered source/support input. Connectivity tools keep
their existing signatures and continue to receive the same primary
compile_log. Conflicting simulators/tops, duplicate logs, incomplete source
order, or material parse warnings keep the manifest conservative instead of
inventing a combined command.
Large compile sets and bounded bootstrap
Full hierarchy construction remains the default because it is the testbench
panorama used by hierarchy browsing and whole-design analysis. Compile logs are
now parsed as streams, and the handle retains compact per-file facts rather than
raw source bodies. The slim result includes numeric build_metrics, including
source counts/bytes, phase timings, RSS samples, source_text_bytes_retained=0,
privacy-safe compile-session snapshot counts/bytes/completeness, and bounded
preprocessor/source-index counters. scan_structural_risks exposes the same
privacy-safe source-index facts under scan_metrics. Those counters distinguish physical source loads,
source/masked-text cache hits and bytes, logical expansions, comment-mask fast
paths, plain expansion-line fast paths, and exact/LRU include-resolution hits,
misses, entries, and evictions; they never expose paths, include names, macros,
or source content. Source Graph manifest receipts expose digest reuse/read
counts and bytes plus a conflict count under the same privacy boundary.
Repeated module/UVM descendants are retained as an internal template object
DAG while preserving the existing nested-dict hierarchy and handle-tool
schemas. Logical stats count each instance path, but memoized summaries and the
retained handle do not copy an identical descendant subtree for every parent.
The metrics report logical nodes, reachable physical nodes, allocations, cache
hits, and reused nodes. If local NPI later adds instance-specific file:line
facts, the overlay uses copy-on-write only along annotated paths, so siblings
sharing one template cannot acquire each other's provenance.
Hierarchy edges are positive evidence, not an elaboration guess. Full-build scan records and admitted nodes carry fixed origin/status/gap metadata. Explicit or implicit generate controls, instance arrays, and bind statements remain raw diagnostic candidates but are not flattened into fictitious child paths; duplicate definitions stop at an ambiguous node without guessed descendants. Parameter overrides keep their safe direct edge while recording that the public compatibility tree did not materialize the specialization. Source Graph carries query-relevant hierarchy gaps into its receipt and coverage boundary, preventing complete negative claims; the parameter-only gap is informational because Slang performs specialization itself. Build metrics include candidate/unresolved and duplicate-definition counts using only numeric values and fixed labels.
Internally, Source Graph no longer depends directly on the compatibility tree
shape. hierarchy_provider.py defines bounded O(depth) scope lookup, exact
instance-to-definition bindings, and capped direct-child reads. The default
compile-log provider wraps component_tree without importing Slang. Every
prepared Connectivity IR exposes a second semantic provider over its existing
query-engine indexes, so generate-scope paths, instance arrays, and parameter
specializations retain their elaborated InstanceDecl bindings without
copying another full hierarchy or rebuilding path dictionaries. Provider-local
stable instance IDs are scoped by the immutable design identity; the public
hierarchy and Source Graph receipt schemas are unchanged.
For offline provider validation on a licensed development host,
scripts/benchmark_hierarchy_provider_soc.py compares this Slang provider with
a bounded NPI oracle in separate fresh processes. The NPI arm performs only
exact dotted-prefix get_inst() lookups (256 by default, hard-capped at 1,024),
never a top/sibling walk, and its partial fragment cannot support exhaustive
negative hierarchy claims. The benchmark emits hashes, counts, timings, and RSS
rather than signal/source/instance names. It is opt-in development tooling: it
does not run from build_tb_hierarchy and does not change production backend
routing.
The companion scripts/benchmark_connectivity_differential_soc.py compares a
bounded driver/load/path corpus against direct NPI and Source Graph execution.
Each provider runs in a fresh process, and neither arm may enter the production
fallback chain. The Source Graph arm prepares exactly one bounded artifact per
query attempt; an incomplete projection remains an explicit coverage fact
rather than being hidden by dynamic expansion or Static output. Reports omit
query text, signal/scope/source paths, and expressions. They contain only
SHA-256 evidence anchors, counts, fixed statuses, timings, cache metrics, and
RSS; driver/load rows also retain their numeric, fixed-label resource-bound
receipt so truncation is measurable without exposing design identity. NPI-only
facts are classified as coverage-explained while Source Graph is
non-exhaustive and as unexpected only under exhaustive Source Graph coverage;
Source Graph-only facts and path reachability differences remain separate
categories because NPI is a reference, not an infallible oracle.
The input is a bounded JSON corpus (at most 64 semantic queries):
{
  "schema_version": "1.0",
  "queries": [
    {"operation": "driver", "signal_path": "tb.dut.result", "recursive": true},
    {"operation": "loads", "signal_path": "tb.dut.request", "max_depth": 1},
    {"operation": "path", "from_signal": "tb.dut.a", "to_signal": "tb.dut.b"}
  ]
}
Run it only on an authorized licensed development host:
python3.11 scripts/benchmark_connectivity_differential_soc.py \
  --compile-log <compile.log> --corpus <queries.json> --top <top>
This benchmark is development tooling only. It is not called by an MCP tool and does not select, promote, or suppress a production backend.
The full scanner avoids repeated work without weakening preprocessing proof.
Slash-free lines outside a block comment bypass the character masker; quoted
strings are removed with the same grammar before structural token collection;
and simulator-recorded include edges provide an unambiguous basename index
before directory search. Positive include resolutions then enter a 4,096-entry
LRU, while unresolved includes are never cached. Definition regexes accept only
horizontal indentation, so ^\s* cannot backtrack across thousands of blank
lines in expanded headers. Within a directive-bearing compilation unit, an
active comment-aware line with no backtick bypasses both directive and hierarchy
macro recognition. Metadata regexes run only when their required literal is
present, and an expanded/trusted structural view replaces root-local instance
facts without first parsing and discarding that root instance list. Ambiguous
include basenames retain ordered include-directory resolution, and all
optimizations preserve per-compilation-unit macro state, cancellation
checkpoints, compact snapshots, and the public hierarchy schema.
Two optional full-build guardrails are disabled by default. Set them below an outer MCP watchdog when a site wants a structured blocker instead of an opaque client/process termination:
export TRACEWEAVE_HIERARCHY_TIMEOUT=20
export TRACEWEAVE_HIERARCHY_MAX_SOURCE_BYTES=1073741824
The transient shared-source tier is enabled by default and has independent limits. A capacity miss safely uses the original readers; it does not block the tools or publish a partial hierarchy:
export TRACEWEAVE_COMPILE_SOURCE_INDEX=1
export TRACEWEAVE_COMPILE_SOURCE_INDEX_MAX_BYTES=134217728
export TRACEWEAVE_COMPILE_SOURCE_INDEX_MAX_FILES=32768
Set TRACEWEAVE_COMPILE_SOURCE_INDEX=0 to disable sharing. Invalid or
non-positive limits disable only the optimization and appear as the fixed
compile_source_index_config_invalid disposition.
A guardrail hit returns build_status="blocked", a fixed blocker, and no
hierarchy_handle; it does not masquerade as a partial panorama. The compact
compile context is retained in a four-entry process cache so a subsequent
single-endpoint driver/load query can opt into bounded bootstrap:
find_signal_loads(
  signal_path="top.u_agent.gate_en",
  compile_log=".../comp.log",
  supplementary_compile_logs=[".../elab.log"],
  simulator="vcs",
  allow_bounded_bootstrap=true,
)
Bootstrap is intentionally not a replacement for build_tb_hierarchy. It is
available only for explain_signal_driver and find_signal_loads, keeps NPI
precedence, searches only simulator-recorded ordered inputs (never the
filesystem), proves the top-to-target instance chain plus package/include and
preprocessor context, fingerprints every selected input, and removes broad
-v/-y library search options from bootstrap replay. A uvm_pkg import is
kept as the explicit uvm_dynamic_connectivity exclusion without expanding the
whole simulator UVM library. A proved positive
Source Graph fact is usable but remains scoped: coverage_status is
inconclusive, exhaustive_search=false, and negative_claim_allowed=false.
When preprocessing is imperfect, the receipt exposes only fixed, privacy-safe
preprocessor_issue_categories. A target chain entirely proved before an
uncertainty boundary may continue with
bootstrap_include_context_incomplete; if the unresolved context could hide a
remaining instance segment, bootstrap stops with
bootstrap_include_context_unproved. No path, macro value, or source fragment
is added to the public diagnostic. A direct generate/array/bind candidate is
also never promoted into a flat ancestor chain: bootstrap stops with
bootstrap_hierarchy_edge_unproved and a fixed hierarchy coverage exclusion.
If an exact full-design source index is already active, bootstrap may reuse it;
on a miss it reports miss_no_active_session and keeps its original bounded
reader instead of initiating a full-project preload.
If proof, build, or query is inconclusive, the bootstrap route returns an honest
no-fact receipt and does not launch the whole-source Legacy Static scan that it
was introduced to avoid. The normal full-hierarchy route keeps its existing
Source Graph-to-Static fallback.
Bootstrap limits are hard and independently configurable (byte values are plain integers). The defaults leave substantial headroom above the reported 3,843-source workload. The 24-second internal timeout deliberately remains below its observed 27-second outer termination so TraceWeave can return a structured blocker instead of being cut off mid-request:
export TRACEWEAVE_BOOTSTRAP_TIMEOUT=24
export TRACEWEAVE_BOOTSTRAP_MAX_SOURCE_INPUTS=128
export TRACEWEAVE_BOOTSTRAP_MAX_SOURCE_BYTES=67108864
export TRACEWEAVE_BOOTSTRAP_MAX_INVENTORY_FILES=16384
export TRACEWEAVE_BOOTSTRAP_MAX_INVENTORY_BYTES=1073741824
export TRACEWEAVE_BOOTSTRAP_MAX_INCLUDE_DEPTH=64
export TRACEWEAVE_BOOTSTRAP_MAX_HIERARCHY_DEPTH=256
Run the reproducible reported-scale benchmark with:
python3.11 scripts/benchmark_hierarchy_bootstrap.py --mode hierarchy
python3.11 scripts/benchmark_hierarchy_bootstrap.py --mode bootstrap
For the same before/after measurement on a real compile log, use the
compile-log-only benchmark below. It disables the optional NPI source overlay
by default, omits paths from its output, and reports the structural result hash,
hierarchy counts, phase timing, RSS, and preprocessor counters. Repeat
--supplementary-compile-log for split compile/elaboration flows; use
--npi-source-overlay only when that separately licensed overlay is the target
of the measurement.
python3.11 scripts/benchmark_tb_hierarchy.py \
  --compile-log /path/to/build.log --simulator vcs
Pass --no-hierarchy-template-sharing only for a real-design eager/shared A/B.
The focused fresh-process synthetic benchmark makes repeated-subtree scaling
and semantic equivalence directly reproducible:
python3.11 scripts/benchmark_hierarchy_materialization.py \
  --branches 1000 --fanout 1000 --repeats 3
Use the companion structural benchmark to measure the other half of the default parallel source-analysis step. It reports no paths or finding text; instead it emits wall/RSS, logical source opens and bytes, per-category counts, and a hash of the complete result for before/after equivalence checks.
python3.11 scripts/benchmark_structural_scan.py \
  --compile-log /path/to/build.log --simulator vcs
To measure the shared tier itself, the combined benchmark runs both public tools in parallel in fresh processes, alternates enabled/disabled trial order, and reports read amplification, wall/RSS, and both complete semantic hashes:
python3.11 scripts/benchmark_compile_source_index.py \
  --compile-log /path/to/build.log --simulator vcs --repeats 3
Mixed Verilog/SystemVerilog/VHDL builds remain eligible when the selected top
and queried region can be elaborated by the Verilog/SystemVerilog frontend.
Compile-command and filelist inputs use one shared, case-insensitive suffix
policy: .v, .vh, .sv, .svh, .svi, .sva, and .svl are regular
frontend text inputs. .svp is retained in exact order, content fingerprints,
worker requests, and KDB build inputs, but is treated as protected: lexical
hierarchy/risk scans do not inspect its payload and Source Graph coverage
reports protected_region rather than claiming visibility into encrypted IP.
VHDL files stay in the content identity but are not passed to Slang; coverage
reports opaque_vhdl_boundary (and the unprojected-file count). A frontend
diagnostic or opaque VHDL region therefore prevents exhaustive negative claims,
but does not discard proved positive driver/load/path facts: a query with a
positive fact returns Source Graph with positive_fact_confidence, while only
an inconclusive no-match advances to Legacy Static. VHDL internals and a design
whose selected elaboration top is itself VHDL are not projected in this phase.
Source Graph is enabled by default. If the MCP interpreter does not have the
optional frontend, the dependency blocker is recorded and the request continues
to Legacy Static. The recommended setup installs pyslang==11.0.0 into the
same repository-local interpreter used to launch the MCP server:
bash scripts/setup_source_graph.sh
# Configure the MCP command as <TRACEWEAVE_HOME>/.venv/bin/python
No Source Graph-specific environment variable is required on that path: the
default policy is enabled, expects frontend version 11.0.0, and launches its
isolated worker with the MCP interpreter. Sites that deliberately keep the
native frontend in a separate pinned Python environment can instead configure:
export TRACEWEAVE_SOURCE_GRAPH=1
export TRACEWEAVE_SOURCE_GRAPH_PYTHON=/path/to/pyslang-11.0.0/bin/python
export TRACEWEAVE_SOURCE_GRAPH_FRONTEND_VERSION=11.0.0
export TRACEWEAVE_SOURCE_GRAPH_TIMEOUT=120
If a site compile wrapper adds a private plusarg that is known to be strictly runtime-only, it can be excluded from frontend replay with an exact local allowlist:
export TRACEWEAVE_SOURCE_GRAPH_RUNTIME_PLUSARGS_JSON='["+PROJECT+RUNTIME_MODE"]'
The value must be a JSON list of at most 256 exact, case-sensitive tokens.
Prefix and wildcard matching are never used; unknown options remain
fail-closed, and semantic +define+, +incdir+, and +libext+ tokens cannot
be allowlisted. The private token text is not exposed in public receipts, but
the policy participates in cache identity. Restart or reconnect the MCP server
after changing it.
TRACEWEAVE_SOURCE_GRAPH_TIMEOUT is a finite worker deadline in seconds
(0.001..86400); the default remains 120. Every attempted preparation reports
the validated value as source_graph.effective_timeout_sec. Exact overlapping
builds share one live worker even when the compile manifest is incomplete, but
an incomplete artifact is still never inserted into the memory or disk cache.
After a successful content-anchored incomplete build, the runtime may retain one
bounded, one-shot session handoff for the next exact artifact request (including
the same effective timeout): at most one entry, 512 MiB, and 60 seconds. The
consumer removes it immediately; it is never searched by dominating scope and
still reports cache_disposition="bypass_incomplete_key", with
artifact_reuse="session_handoff" and cache_tier="handoff". Missing content
identity, incomplete snapshots, implicit scope, oversize artifacts, expiry, and
failed/timed-out/cancelled builds all rebuild normally. Cancelling one live
waiter leaves the worker alive for the others; cancelling all waiters terminates
it.
When a usable KDB is present but you specifically need to exercise Source Graph for a driver, load, path, or X-trace test, select it explicitly:
export TRACEWEAVE_CONNECTIVITY_ROUTE=source_graph
This does not rename, move, or invalidate the KDB. It avoids constructing or
calling NPI for those four public connectivity tools and for the optional
build_tb_hierarchy file/line overlay, then uses the normal Source
Graph-to-Static fallback if Source Graph cannot answer safely. Hierarchy
topology still comes from the compile log; its project receipt reports
source_info_overlay="compile_log" and
source_info_overlay_reason="npi_skipped_by_policy". The connectivity
receipt keeps kdb_validation_status="usable", reports
connectivity_route="source_graph", and records the NPI attempt as
status="skipped" with reason="npi_skipped_by_policy". Unset the variable or
set it to auto to restore the default trusted NPI -> Source Graph -> Legacy
Static route. Invalid values preserve auto and surface the fixed
connectivity_route_config_invalid receipt instead of silently changing the
route.
On large parameterized SoCs, the bounded frontend tolerates compile-hierarchy
candidates removed by the selected generate specialization: it records an
inconclusive focused_instance_not_elaborated coverage gap and continues with
the instances that really elaborated. Packed selects are checked against the
declared range before expansion, so an unsigned parameter underflow in an
inactive branch cannot materialize an enormous host-language range. During
X-trace, an inconclusive parent-net query may request that parent's direct
children as a bounded frontier; TraceWeave rebuilds the exact ancestor union
and restarts at the original X-bearing signal. The expansion remains capped by
TRACEWEAVE_SOURCE_GRAPH_FRONTIER_MAX_INSTANCES, and exceeding the cap falls
back honestly rather than enumerating the design.
Driver resolution is bit-mapping based, not an exact-whole-bus heuristic. For
example, a binding such as .instr_rdata_i({8'h0, instr_rdata_core}) can report
the constant-driven upper byte and the 24-bit signal-driven lower segment
separately. Positive segments remain usable under partial coverage; only a
complete artifact can prove an uncovered segment has no driver.
Source Graph results expose this distinction explicitly in the additive
claim_semantics receipt. The existing confidence field is unchanged and
remains the conservative combination of positive evidence and global artifact
coverage. Consumers should interpret the new fields independently:
positive_fact_confidence: confidence in the returned positive source fact;target_bit_coverage: whether the requested driver/load bits were all resolved;global_coverage_status: coverage of the bounded artifact, including unrelated unsupported constructs;exhaustive_search: whether the operation searched its supported space exhaustively (a positive path returns the first proved path and is not exhaustive);exclusive_driver_proved: whether every requested driver bit has an exhaustive, non-overlapping driver set;negative_claim_allowed: whether “no driver/load/path exists” is a sound claim.
For example, a large SoC driver result may retain legacy confidence="partial"
and coverage_status="inconclusive" while reporting
positive_fact_confidence="exact" and target_bit_coverage="complete". The
returned bit-mapped driver is then usable, but the caller must not call it the
only possible driver unless exclusive_driver_proved=true, and must not turn an
empty result into a negative conclusion unless negative_claim_allowed=true.
trace_x_source preserves the same receipt on each Source Graph chain node.
Warm driver/load graph walks are independently resource-bounded, even after a
large IR has been built. The fixed defaults admit 4,096 visited states, 16,384
inspected IR edges, 256 unique matches, and 4,096 expansion frontiers. The
walk checks cooperative cancellation at state and edge boundaries and sorts
its indexes before selecting a bounded result, so the same canonical IR yields
the same retained facts. Hitting any bound sets query_truncated=true, the
specific *_truncated flag and query_*_limit coverage gap, and forces
coverage_status="inconclusive". Returned facts remain positively proved, but
exhaustive_search=false, exclusive_driver_proved=false for drivers, and
negative_claim_allowed=false; a high-fanout load list must therefore never be
described as complete. The public MCP inputs are unchanged in this slice.
The synthetic query benchmark runs each mode in a fresh process and reports query/serialization time, result bytes, RSS, limits, and stable-result status:
python3.11 scripts/benchmark_source_graph_query.py --fanout 50000 --mode bounded
python3.11 scripts/benchmark_source_graph_query.py --fanout 50000 --mode full
Signal-to-instance resolution is also indexed independently of design size: the query engine probes dotted hierarchy prefixes from deepest to shallowest against the instance table instead of sorting and scanning every instance. Wide-load matching constructs a requested-bit membership set once per match, while retaining the ordered bit tuples required for ascending ranges and concat mappings. These are internal changes; public paths, bit ordering, receipts, and schemas are unchanged. Reproduce the 30k-instance and 4,096-bit workloads with:
python3.11 scripts/benchmark_connectivity_query_indexes.py \
  --workload instance-resolution --size 30000 --repeats 100
python3.11 scripts/benchmark_connectivity_query_indexes.py \
  --workload wide-load --size 4096 --repeats 100
python3.11 scripts/benchmark_connectivity_query_indexes.py \
  --workload path-chain --size 4096 --repeats 10
python3.11 scripts/benchmark_connectivity_query_indexes.py \
  --workload path-comb --size 4096 --repeats 10
The IR still uses explicit ordered bit tuples. A wider interval/segment rewrite
is deliberately deferred until a measured workload justifies its schema,
cache-version, and correctness cost. The path workloads independently expose
deep-path CPU cost and queued shared-prefix memory, so path-search storage can
be optimized without conflating it with instance or packed-bit representation.
On Linux 4.18 with CPython 3.11.13 and an AMD Ryzen 7 5700G, three paired fresh-
process runs at 4,096 edges reduced the process-median path-chain query from
39.47 to 24.78 ms (1.59x) and path-comb from 77.12 to 20.87 ms (3.69x).
path-comb median maximum RSS fell from 63,900 to 31,464 KiB; the single-chain
case instead increased from 32,456 to 33,584 KiB because it trades one growing
prefix for the predecessor table. Result fingerprints, statuses, visited-state
counts, traversed-edge counts, and truncation receipts were identical. A real
OpenTitan two-fact short path remained effectively unchanged at 0.452 versus
0.438 ms. A 100,000-instance lookup was 0.0037 ms median, and even a synthetic
65,536-bit load was 75.6 ms while serializing a 3.44 MB public result, so numeric
stable IDs, a hierarchy trie, and interval-bit IR remain evidence-gated rather
than part of this change.
An optional exact, content-addressed disk cache can reuse a validated scoped IR after an MCP restart. It remains disabled by default:
export TRACEWEAVE_SOURCE_GRAPH_DISK_CACHE=1
export TRACEWEAVE_SOURCE_GRAPH_DISK_CACHE_MAX_ENTRIES=8
export TRACEWEAVE_SOURCE_GRAPH_DISK_CACHE_MAX_BYTES=536870912
It uses the existing TRACEWEAVE_CACHE_DIR root and stores its private
namespace under source_graph/disk-v1/. The process-memory exact/dominating
cache is always checked first and performs no disk I/O on a hit. A memory miss
does one direct exact-artifact lookup; there is no startup scan or disk-level
dominating-scope search. Every fresh process still hashes and validates all
ordered source/support inputs, options, tops, and compile/hierarchy snapshots
before the disk lookup. A verified hit skips the frontend worker, constructs a
new query engine, and enters the memory cache. Unknown, truncated, corrupt, or
version-mismatched entries are fixed-reason misses followed by the normal cold
build; they are never connectivity negatives or Static results.
Memory-level dominating reuse can cross two different dependency closures, but
only through explicit fail-closed containment proofs: the full compile
manifest, options, tops, frontend/schema versions, and compile/hierarchy
snapshots must match exactly; the cached ordered input set must contain every
requested input; and its proved hierarchy scope plus objective exclusions must
dominate the request.
The reverse subset direction, changed source/snapshot/version, duplicate-input
manifest, or non-dominating sibling remains a miss. The selected payload still
comes from one cached artifact. Every projected artifact is contractually marked
compile_projection_pruned_inputs, so coverage stays inconclusive and only
proved positive facts are reusable. Disk lookup remains exact-only. A
reproducible two-scope orchestration benchmark is available as:
python3.11 scripts/benchmark_source_graph_scope_reuse.py \
  --delay-ms 50 --repeats 5
To compare the historical reactive two-build sequence against the bounded first-artifact policy on the same eligible SoC target, run each strategy in a fresh process. The report includes plan sizes, preparation/build/load time, worker and parent peak RSS, cache bytes, and a hash of the final public query result:
python3.11 scripts/benchmark_source_graph_initial_scope.py \
  --compile-log /path/to/build.log --simulator vcs \
  --signal tb.dut.path.to.signal --operation driver --max-depth 20 \
  --strategy reactive-sequence
python3.11 scripts/benchmark_source_graph_initial_scope.py \
  --compile-log /path/to/build.log --simulator vcs \
  --signal tb.dut.path.to.signal --operation driver --max-depth 20 \
  --strategy bounded-adjacent
For a reproducible cross-restart observation on any SoC layout, use
scripts/soak_source_graph_soc.py. It takes an explicit verification root,
compile log, simulation log, waveform, top, and an external JSON list of public
driver/load/path queries; no DVSim, FuseSoC, or Bazel directory convention is
embedded. Every sample is a fresh process, and the script refuses a non-empty
cache root unless --resume is explicit. Raw cache/telemetry stays under that
owner-private root; the optional --output file contains numeric and
fixed-label aggregates only. Run the script with --help for the complete
invocation.
The persisted canonical ConnectivityIR can contain protected-IP-derived
structural information. TraceWeave creates its namespace and entries with
owner-only directory/file permissions (0700/0600), rejects symlinks and
non-regular entry files, publishes atomically, and applies deterministic entry
and byte limits only on local lookup/publish/maintenance paths. Choose a trusted
local TRACEWEAVE_CACHE_DIR; do not place this opt-in cache on an untrusted or
shared filesystem. Failed, timed-out, or cancelled builds are not published.
Run build_tb_hierarchy first, as in the standard workflow, so the request has
an exact compile/hierarchy handle. backend_status then reports
selected_backend, attempted_backend, actual_backend, the ordered
attempted_backends chain, and a Source Graph receipt containing fixed blocker
labels, coverage, build/compile/IR fingerprints, cache disposition, and numeric
resource metrics. Additive fixed labels distinguish memory, disk, build,
and one-shot handoff tiers plus the disk validation outcome; receipts never
expose cache paths or entry names. Positive results under partial or
inconclusive coverage stay partial; only complete coverage can establish
not_connected. On this normal
full-hierarchy route, a fallback recomputes the whole result with Legacy Static,
so payload provenance is never mixed. The explicit bootstrap-only exception is
documented above: it suppresses that unbounded Static rescan and cannot make a
negative claim.
Functional Verification
After connecting either client, run a quick end-to-end smoke test:
- Start
codexorclaudeinside a project directory that contains a sim log and waveform files. - Submit a direct waveform-debug request, for example: "Call the TraceWeave MCP. Start with
get_sim_pathsto list the logs and waves for this case." - Confirm that the execution log shows actual MCP tool calls such as
get_sim_paths,parse_sim_log, andsearch_signals— not just shell commands reading files manually.
Standard MCP Workflow
This is the default workflow for simulation-log and waveform debug:
- Call
get_sim_paths(verif_root, case_name?). For non-standard layouts you may also pass explicitsim_log/wave_file/compile_logpaths; any field you supply is used as-is and the omitted ones are still auto-discovered (asim_logpath also anchors discovery of the matching waveform and compile/elab logs). An explicit path may be absolute or relative — a relative path is resolved againstverif_rootand each of its ancestors (so a path relative to the repo root also works), and if still not found it is recovered by basename. - Choose the
phase == "elaborate"compile log for a complete single-log flow. For split VCS source-compile/elaboration logs, use the source-compile log as primary and retain the ordered companions forsupplementary_compile_logs. - Run
build_tb_hierarchy(with any supplements) andscan_structural_risksin parallel on that same primary compile log. - If a sim log is present, call
parse_sim_log; then, on a failing run with a waveform, callsweep_handshakesfor a one-call whole-design protocol-health scan (a default-flow step, likescan_structural_risksat the runtime layer). - Use
recommend_failure_debug_next_stepsoranalyze_failure_event. - Use
search_signalsandanalyze_failureswhen you need waveform snapshots for explicit signals. - Use
explain_signal_driver,trace_x_source, orget_signals_by_cyclefor deeper investigation. - Use
get_diagnostic_snapshotat any time to inspect reusable cached session state.
Important workflow rules:
scan_structural_risksis part of the default workflow and should not be skipped unless the user explicitly asks to skip it.- Use the same
compile_logfor bothbuild_tb_hierarchyandscan_structural_risks. - Always read structural
coverage_status: onlycompletewithtotal_risks=0means the supported source set was scanned without findings.zero_coveragescanned no supported Verilog/SystemVerilog files, whiledegradedscanned only a partial or parser-degraded source set; neither is a clean result. - Prefer
failure_events[].time_psfromparse_sim_logas the waveform time anchor. - If
fsdb_runtime.enabled == false, prefer.vcdover.fsdb.
Tool Quick Reference
Session Overview
get_diagnostic_snapshot: Read-only summary of cached session data and suggested next calls; mirrorsparse_sim_log'sprotocol_symptom_hintso a scoreboard failure surfaces the protocol-health pointer at session start
Paths and Hierarchy
get_sim_paths: Discover compile logs, sim logs, waveforms, simulator, and cases. Optional explicitsim_log/wave_file/compile_logoverrides win over auto-discovery; omitted fields are still discovered (anchored at thesim_log/wave_filedirectory)build_tb_hierarchy: Stream compile evidence and build the full testbench hierarchy server-side without retaining raw source bodies; return a slim payload (project, stats, depth-2 tree skeleton, interfaces, ambiguous_basenames,build_metrics,hierarchy_handle). For split VCS flows, pass orderedsupplementary_compile_logsonce; later connectivity calls keep using the primarycompile_log. A configured resource guard returnsbuild_status="blocked"and no handle. Full completed data is reachable via the handle tools below.scan_structural_risks: Scan compiled RTL/TB sources for structural risk patterns in a lock-free cancellable worker; returnseligible_file_count,files_scanned,coverage_status, andcoverage_warningsso zero or partial source coverage cannot be mistaken for a clean scan
Hierarchy Handle Tools
All take the hierarchy_handle returned by build_tb_hierarchy. On a stale or unknown handle they return {"error": "handle_expired"}; re-run build_tb_hierarchy to refresh.
get_tb_subtree(handle, root="", depth=1, max_nodes=500): Slice the component_tree starting at a dotted instance path.lookup_tb_files(handle, ...): Query the compiled file set by objective scan facts (basename,name_contains,path_contains,has_module,contains_uvm,file_type). At least one filter is required. Usebasename=...to disambiguate multi-version files reported inambiguous_basenames.find_tb_instance(handle, path=... | module=...): Locate an instance by exact path or all instances of a module.get_tb_file_detail(handle, path): Return symbols defined in a single compiled file. Unknown paths returnfile_not_in_compile_setwith basename-similardid_you_meansuggestions — verify file membership before any RTL read.get_tb_class_hierarchy(handle, root_class?, depth=-1): UVM/SV class inheritance tree built from compile-set scans.dump_tb_section(handle, section): Escape hatch for the full rawcompile_result,include_tree,filelist_tree,interfaces,files_full,component_tree_full, orclass_hierarchy_full. Prefer the targeted tools above.
Log Analysis
parse_sim_log: Parse and normalize runtime failures into grouped summaries andfailure_events; also returnslog_snapshot_idso same-path reruns can be compared after the simulator overwrites the log. Itscandidate_previous_logsare evidence-backed simulation siblings selected from bounded head/tail samples; compile/elaboration/build logs and ambiguous helper logs are excluded. On a scoreboard/compare-style failure it setsprotocol_symptom_hint, a boundary-safe pointer reminding you to check bus-protocol health (runsweep_handshakesonce for all interfaces) before reading RTL line-by-line — it never asserts a protocol type or a specific signal.diff_sim_failure_results: Compare two simulation runs by paths or bybase_snapshot_id/new_snapshot_id. If onlynew_log_pathis supplied after an earlierparse_sim_logof the same path, TraceWeave uses the previous parsed snapshot as the baseline.get_error_context: Extract raw log context around a specific line
Waveform Analysis
search_signals: Resolve full hierarchical signal paths.keywordaccepts a single string or a list of keywords (max 16) — pass a list to batch several lookups in one call (one result entry per keyword, in input order) instead of issuing consecutive single-keyword searches. Each result also carriesdirection(input/output/inout/implicit/null) andvar_type(wire/reg/integer/real/parameter/…), so clients can filter ports/nets/variables in a chosen scope without a separate tool. FSDB populates both fields; VCD populates onlyvar_typeand returnsdirection: null(the VCD format does not encode port direction)get_signal_at_time: Query a signal value at a specific timestampget_signal_transitions: Retrieve transitions for a signal over the strict closed interval[start_time_ps, end_time_ps]; FSDB and VCD never mix an earlier timestamp intotransitions. The last value-change strictly before the window is exposed separately aspredecessor, which clocked samplers use to classify a transition at the first in-window timestamp. Returns at mostmax_transitionsentries (default 1000, earliest in range kept); a clipped result setstruncated: true+ ahint. When bounded native FSDB output is also truncated,transition_count_is_lower_bound=true; narrow the time range for complete data. Otherwisetransition_countreports the total found, and the explicit return cap can be raised for bulk extractionget_signals_around_time: Retrieve context around a failure timestamp.transitions_in_windowis a strict closed-window list;pre_window_transitionscontains only earlier value changes, capped byextra_transitionsand ordered chronologically on both FSDB and VCD. Flags avalue_at_centerthat is a sub-cycle transient (a combinational glitch at the clock edge that settles back within the same cycle — e.g. an interconnect mux re-settling to idle for ~1ns) viatransient_note+ per-signalcenter_transient/center_settles_to, so an edge-sampled glitch is not misread as the settled protocol value.return_mode="values_only"keeps the atomic multi-signal sample but strips the transition lists (each signal returnsvalue_at_center+window_transition_count+ any transient annotation) — the compact shape for comparing one time point across several traces.extra_transitions=0is honored strictly: zero pre-window history.get_signals_by_cycle: Sample signals cycle-by-cycle on a clock edgeget_waveform_summary: Return waveform metadata. Includes a time-scale self-check:scale_unit(the scale read from the waveform header, e.g.100fs/1ps/1ns;unknownwhen unreadable) andscale_fs_per_tick— all timestamps in tool output are real picoseconds converted with this factor, never raw file ticks. When the scale is unreadable the summary carries ascale_warningand every time-based query on that waveform is refused instead of silently assuming a 1ps scale
Cursors and Verification Primitives
Time inputs on get_signal_at_time, get_signal_transitions, get_signals_around_time, trace_x_source, and diff_first_divergence accept a TimeSpec: a raw integer (ps), a cursor reference @<name>, or a unit literal such as 12.34ns / 5us.
cursor_set(name, time_ps, note?)/cursor_list()/cursor_delete(name): Named, process-scoped time anchors. Tools that locate an instant (e.g.diff_first_divergence,period) auto-register a cursor you can later reference as@<name>instead of copying ps timestamps across calls. Cursors are not persisted — server restart drops them.diff_first_divergence(wave_path_a, signal_a, wave_path_b, signal_b, ...): First time two waveform signals hold unequal values — across two waveforms (e.g. passing vs failing run) or within one (two signals that should match, e.g. lockstep / shadow registers). Auto-registers a cursor at the divergence. Requires both sides to be dumped waveform signals (it does not compare against a software reference model).period(wave_path, signal, edge?, ...): Dominant edge-to-edge period of a signal and the first beat that deviates from it (off-beat), auto-registered as a cursor. For "this signal should be periodic — where did the cadence first break?" (clocks, strobes, fixed-rate valids).suggest_handshakes(wave_path, scope?, ...): Scans the waveform and proposes ready-to-useinspect_handshakebundles — pairs*valid/*readyby scope and stem, finds the clock, and groups the channel payload buses. Run it first so you don't hand-assemble{clock, valid, ready, payload}. Covers AXI/generic valid-ready and req/ack. When it finds nothing, a lightweight name probe (htrans→AHB,psel+penable→APB) upgrades the empty-result hint into a copy-paste-readysuggest_protocol_bundlescall.suggest_protocol_bundles(wave_path, protocol=ahb|apb, scope?, ...): Scans for protocol-specific bundles where there is no literalvalid. AHB candidates return ready-to-useinspect_handshakeargs withvalid_htrans,ready, and payload; APB candidates returnpsel/penable/preadyfacts and loudly report thatinspect_handshakestill needs a derived valid signal forpsel && penable. For AHB candidates the result also returns anext_stepfield — a copy-paste-readyinspect_handshake(...)call per interface — because discovery only locates the bundle; the analysis is theinspect_handshakerun. Direction tags are mechanical discovery facts only (initiator_side/responder_side/unknown), with unknown/conflicting markers reported rather than guessed.inspect_handshake(wave_path, clock, valid, ready, payload?, ...): Cycle-by-cycle classification of a clocked valid/ready handshake — stall runs (valid high, ready low), the longest/over-threshold stalls, backpressure imbalance (ready high, valid low), and, whenpayloadsignals are given, payload-hold violations (a payload that changes while the transfer is still stalled). It also flags premature valid deassertion (check_valid_hold, default on): a stalled beat whose valid/htrans goes inactive the next edge — before ready/HREADY arrived — is the master dropping the transfer instead of waiting (the AHB master-not-waiting-for-HREADY bug). This needs nopayloadand catches what payload-hold structurally cannot: a 1-cycle stall (max_stall_cycles==1) never lets payload change, and htrans (the derived valid) is not a payload signal. Protocol-agnostic: AXI*valid/*ready, generic valid-ready streams, or credit interfaces. For AHB there is no literal valid — passvalid_htrans=<htrans path>(andhtrans_rule:active=NONSEQ/SEQ, ornon_idle) and a derived valid is computed (withpayload=haddr/hwrite/hsize which must hold while hready is low; HWDATA/HRDATA are excluded as data-phase, so the hold check cannot false-positive on the address/data phase offset). For an AHB interface a third check, x_while_valid, flags a control field that is x/z while the derived valid is asserted — an active transfer carrying an unknown address/control field; it stays off for a literal-validinterface whose payload may be legally-x data lanes (a false positive). A separate write data-phase hold check (passhwrite+write_data=HWDATA) verifies HWDATA stays stable through a write data-phase wait state (HREADY low) — awrite_data_hold_violation; this is the data-phase window, one cycle behind the address-phase valid, that the htrans-keyed payload-hold cannot see (and why HWDATA is excluded frompayload). It is sound only on the producer (initiator/master) interface — a responder interface's HWDATA is an interconnect-mux output that glitches at the clock edge — sosuggest_protocol_bundlesattacheshwrite/write_dataonly to initiator-side bundles. On AHB the result also carries aprotocol_semanticsreceipt naming which metrics are faithful vs suppressed (valid-hold faithful;ready_without_validis idle-bus, not a violation; payload-hold address-phase only), and the premature-deassertion finding carriesaccepted_before_deassert=False(the dropped beat was never accepted) — so a true positive cannot be waved away as AHB pipeline overlap. Returnscoveragefacts for checks it actually ran (stall_checked,backpressure_checked,payload_hold_checked/partial,valid_hold_checked,x_while_valid_checked), without assigning protocol side. Auto-registers a cursor at the first problem (x-while-valid > hold violation > premature deassertion > long stall > longest stall). On a finding it setsviolating_signal(the held signal for a payload-hold, the x'd control field for an x-while-valid, the valid/htrans for a premature deassertion;nullfor a plain stall) and anext_actionslink toexplain_signal_driver. For the one-sided violations (x-while-valid, payload-hold, premature deassertion) it also returns a structuredattributionblock —violating_side=valid_driver,exonerated_side=ready_driver— because both are breaches of the valid-driver's obligation (payload travels with valid; only the producer can mutate payload mid-stall or drop valid before acceptance), so the responder/ready side cannot cause them: don't start in the slave driver/monitor. This is protocol role, not trace-ownership: the valid-driver is the channel producer (master on AXI AW/AR/W, slave on R/B; AHB htrans is always master) —explain_signal_driveronvalidlands on the actual instance. A plain stall is genuinely two-sided, soattributionstays empty and the link targetsready. Surfaces protocol-timing facts that leave no value pattern in scoreboard logs.sweep_handshakes(wave_path, scope?, ...): Whole-design handshake anomaly sweep — discovers every valid/ready interface and every AHB interface (htrans-derived valid) and inspects each over the window in one call, returning a comparative fact table (per-interfacekind=valid_ready/ahb, stalls, deadlock signature, x-while-valid, payload-hold, write-data-hold, premature valid deassertion, backpressure) ordered by a transparent mechanical key (on anahbrowready_without_validis suppressed fromflagsand the sort — it is idle-bus, not backpressure). Interfaces sharing a clock reuse one transition read, edge extraction, and sample-time vector; signals shared across interfaces are cached only until their last consumer, while unique payloads are not retained. On FSDB, a bounded native group loads a clock group's signals once and still reads each signal independently through the reusable per-call output buffer; older wrappers, groups over the conservative 16-signal default, and native begin failures fall back automatically to the legacy path (TRACEWEAVE_FSDB_GROUP_MAX_SIGNALSadjusts the limit after RSS review). This changes execution cost, not the MCP interface, fact table, truncation receipts, or coverage semantics. This is the one-call protocol-health check the scoreboard-failure hint steers toward (APB excluded — needs a derived valid; clocking-block*_cbmirror scopes are dropped — no own clock, redundant with the parent interface). For opaque global symptoms (timeout/hang) when you don't yet know which of many interfaces misbehaves; it collapses Nsuggest_handshakes+inspect_handshakeround-trips into one. Returns facts, not a root-cause verdict — re-rank as the symptom warrants. On a backpressured pipeline the worst-stall ordering surfaces the propagation front, while the root is the stall→starvation boundary. The result includescoverage_status(complete/truncated/zero_coverage/degraded) pluscoverage_warnings;flagged_count=0is only meaningful when coverage is complete. A scopedzero_coverageresult can retry unscoped or at a parent scope;truncatedcan raisemax_interfaces. An unscoped zero-interface result remains explicitly not-a-pass but is not replayed with identical arguments. Adegradedresult is retried only when an action changes scope/window/edge/cap; otherwise recommendation reports the missing dump/clock/window prerequisite. Setstruncated=true(loudly) when discovery exceedsmax_interfaces(default 64).recommend_failure_debug_next_stepspreserves this fact inruntime_protocol_coverageeven whenruntime_protocol_findings=[].verify_window(wave_path, clock, mode, predicate | antecedent+consequent, ...): Evaluate a temporal predicate over a clock window and return a preciseholdsverdict plus a concrete witness/counterexample (cycle + sampled values). Templates, not a DSL: a term is{signal, op, value}(op: eq/ne/gt/ge/lt/le/is_x/is_known); a predicate is a list of terms (implicit AND);modeisalways/never/eventually/implication(A ⊦→ B within N cycles) /sequence(per-accepted-beat increment of one signal — address-stride checks;predicateis the accepted-beat gate,delta={signal,value,op?,modulo?,restart_when?}, wheremoduloabsorbs WRAP wrap-around andrestart_whenre-seeds at burst starts, both supplied by you so the tool stays burst-decode-free).implicationtakes anoverlapflag: defaulttrue(|->, response window includes A's own cycle) orfalse(|=>, window starts the NEXT cycle) — useoverlap=falsefor a stability/hold property ("B must STILL hold next cycle", e.g. AHBHTRANS/valid held through a wait state:(htrans==2 && hready==0) |=> htrans==2), where A already implies B on its own cycle. Withoverlap=truesuch a property is a vacuous pass (B already true on A's cycle, the window never matters) — the result is flaggedvacuous=truewith a loudVACUOUS PASSwarning so aholds=trueis not misread as exclusion evidence; re-run withoverlap=false. x/z cycles are reported asunknown(never silently passed) and an implication whose response window runs past end-of-trace isinconclusive(never silently failed). On asequenceviolation it setsviolating_signal+ anext_actionslink toexplain_signal_driver(bus facts do not self-attribute master/slave). Use to prove or disprove an RTL inference in one call.reconstruct_transactions(wave_path, clock, req_valid, req_ready, cmp_valid, cmp_ready, ...): Reconstruct id-correlated request/response transactions from two handshake channels — match accepted request beats to completion beats by anidfield and return per-transaction latency plus aggregate facts (outstanding curve incl. per-id peak, ordering, unmatched = hang signature). One generic core, not a tool per protocol: AXI read = AR→R (req_id=arid,cmp_id=rid,cmp_last=rlast); AXI write = AW→B plus an optional unindexed W-data channel (data_valid/data_ready/data_last+data_fields).req_id/cmp_idare optional — omit both for an unindexed in-order stream (AXI-Lite, APB), which pairs in FIFO order. An optionalresetclears in-flight state so a transaction straddling reset is not a phantom hang. An optionalreq_len(AxLEN) checks each txn'sbeat_countagainstreq_len+1— a mismatch (early/late LAST, dropped/extra beat) is surfaced per-txn (expected_beats,beat_count_mismatch) and asbeat_count_mismatch_count(x/z len → not checked; noreq_len→ count 0 = not checked, not a clean verdict).latencyis a distribution, not an "outlier" verdict; out-of-order completion across ids is supported.
FSDB coverage note: native transition output is bounded. If an inspected clock
or signal returns only a prefix, the affected handshake row sets
transition_data_truncated, the sweep increments transition_truncated_count,
and coverage_status is not complete; zero findings then apply only to the
returned prefix. Narrow the time window for a complete targeted check.
Deep-Dive Analysis
analyze_failures: Focus on one grouped failure and return log plus waveform contextanalyze_failure_event: Rank likely instances, source files, and signals for a specificfailure_eventrecommend_failure_debug_next_steps: Return the default next debug targetexplain_signal_driver: Trace a waveform signal back to likely RTL driver logicfind_signal_loads: List the consumers (fanout) of a signal — module-input ports, RHS uses, always-block sensitivitytrace_signal_path: Find a structural connectivity path between two signals. Trusted NPI evidence wins; otherwise the bounded dual-endpoint Source Graph follows supported IR bindings and combinational dependencies. Only complete coverage can establishnot_connected; an inconclusive negative falls through tounsupported_reason="static_backend_no_path_api". This is connectivity, NOT temporal driver direction — useexplain_signal_driverfor driver semantics.trace_x_source: Trace X/Z propagation upstream throughtrusted NPI -> one bounded Source Graph artifact -> whole-trace Static. Wave locks cover only waveform reads. Any backend switch or proved scope expansion discards the partial chain and restarts at the original signal, so one returned chain never mixes backend or artifact provenance.backend_statusreports ordered attempts, restart reasons, Source Graph fingerprints/coverage, and selected/actual backend;trace_restarted=truemakes the retry explicit. NPItestbench_driven, source-line, and driver-vs-load cross-check evidence are preserved on the terminal trace node.build_kdb: Auto-build a Verdi KDB from the parsed compile log (vericom + elabcom). Use when the simulator is Xcelium (xrun) and the NPI backend reports no KDB. Output is cached underTRACEWEAVE_CACHE_DIR(default~/.cache/traceweave/kdb/<hash>/); cache hits skip re-running Verdi. WithTRACEWEAVE_NPI_EXECUTION=lsf, every cache miss/forced rebuild runs on LSF and never silently falls back to a local licensed build. A runnablebuild.shis written next to the KDB for inspection or manual reproduction. RequiresVERDI_HOMEwithbin/vericomandbin/elabcom.
explain_signal_driver, find_signal_loads, trace_signal_path, and trace_x_source automatically engage a Verdi NPI backend when a KDB is detected. A trustworthy NPI result wins; otherwise TraceWeave tries the bounded on-demand Source Graph before recomputing the whole result or trace with Legacy Static. Static still has no honest sig_to_sig_conn_list equivalent, so an inconclusive Source Graph path ends as structured unsupported rather than an approximation. X-trace backend/artifact changes always restart from the original signal. NPI remains the deepest path: it walks the elaborated netlist with fan_in_reg_list / sig_to_sig_conn_list, so it can cross instance port boundaries, interface positional bindings, and assign chains beyond the Source Graph's explicitly projected scope. In local NPI execution mode, build_tb_hierarchy can also enrich component-tree source_file / source_line fields from elaborated NPI evidence. This optional enrichment is separately resource-admitted: the default auto policy accepts only a clean KDB and at most 4,096 compile-proved instance paths, then calls netlist.get_inst() only for those paths. A degraded KDB or larger design keeps compile-log provenance and reports a fixed skip reason without loading NPI. Set TRACEWEAVE_HIERARCHY_NPI_SOURCE_OVERLAY=force to opt into targeted enrichment for degraded/larger designs (still capped at 100,000 paths), or off to disable it. This setting does not change NPI priority for driver/load/path queries. The initial LSF scope deliberately does not submit an implicit batch job from build_tb_hierarchy, so in LSF mode hierarchy source information remains compile-log-derived. Affected hops in find_driver / find_loads results carry source_info_origin: "npi" or "source_graph", while Static remains compile-log-derived; Source Graph path hops likewise carry only IR-backed scope/source/edge evidence. The result envelope carries a backend_status block with the selected/attempted/actual backend, ordered fallback chain, Source Graph coverage/build receipt, KDB flow, and per-simulator kdb_hint. NPI is deep but not infallible: when the only driver it can report for a net is also a LOAD of that net (an interface-slice alias, or a register that reads the net), there is no RTL driver and the real driver is testbench/behavioral — a UVM driver writing through a virtual interface + clocking block, which RTL register fan-in cannot see. explain_signal_driver detects this contradiction with a driver-vs-loads cross-check and returns driver_status="testbench_driven" (with a cross_check.conflict receipt) instead of naming the load as an "exact" driver — so an AHB master's HTRANS/HADDR points you at the TB driver/BFM, not at a DUT interconnect register that merely reads the bus.
Recursive NPI driver queries retain native Verdi semantics without allowing
fan_in_reg_list() to materialize an unbounded cone. TraceWeave registers the
official FAN_IN callback before traversal, admits at most 4,096 native states,
and caps the public result at 32 driver facts. NPI and Source Graph driver
results expose the same backend-neutral traversal receipt: returned/output
counts, visited/state limits, callback counts when available, truncation,
search_exhaustive, fixed incomplete_reasons, and
continuation_supported=false. A bounded positive prefix remains usable and is
reported as driver_status="partial"; only search_exhaustive=true supports a
complete driver-set claim. If callback registration is unavailable or fails,
TraceWeave does not silently run the whole native cone: it returns any direct
driver facts as coverage-incomplete. Callback reset runs on success, failure,
and cancellation, and callback registration is serialized because pynpi stores
it globally. trace_x_source preserves this receipt on its terminal node and
uses driver_traversal_incomplete, rather than promoting one bounded candidate
to an exclusive root-cause verdict.
For load queries, NPI uses net.load_list() direct consumers and crosses an
outward-facing child output only through its paired parent net. It never starts
the native whole-cone fan_out_reg_list() walk. Every backend caps public load
output at 256 and returns an enumeration receipt with the returned count,
limit, truncation/exhaustiveness facts, and continuation_supported=false.
Thus a useful positive prefix remains available without being mistaken for all
loads; pagination will require a future backend-neutral cursor that preserves
the exact artifact and work identity.
A kdb.elab++ carrying Verdi's .hasElabcomError marker is selected as a
degraded NPI candidate when no clean elaborated KDB is available. Error count is
not a threshold: TraceWeave accepts only load_design return code 0, a
non-empty get_top_inst_list(), and the requested top when its name is
inspectable. Other return codes, an empty/mismatched top list, a corrupt KDB,
or a license/import failure still fall through normally.
Degraded mode trusts positive evidence, not exhaustive negative claims. A
resolved driver, bounded partial driver with a returned fact, non-empty load
list, or found path can return from NPI; the
attempt reports coverage_status="partial", and load-list completeness is
approximate even though each returned hop may still have exact NPI
confidence. An unresolved driver, empty load list, testbench_driven claim, or
not-found/not-connected path continues through Source Graph and then Legacy
Static. trace_x_source discards its entire partial NPI chain and restarts from
the original signal on the first such inconclusive lookup. Public status keeps
the artifact fact kdb_validation_status="elaboration_error" and, after a
successful partial load, adds kdb_degraded=true, kdb_error_count, and
kdb_error_log. When the separate hierarchy overlay policy is explicitly
forced, successful source enrichment from such a KDB is reported as
source_info_overlay="npi_partial"; the default hierarchy policy skips it.
This behavior is default-on. To restore the previous clean-KDB-only gate, set the following before starting the MCP server, then restart or reconnect it:
export TRACEWEAVE_NPI_ALLOW_DEGRADED_KDB=0
The first implementation supports already-existing user/project degraded
KDBs. build_kdb still treats a non-zero elabcom exit as a failed build and
does not publish that failed artifact into the normal cache.
For VCS flows the cheapest way to get a KDB is to recompile with -kdb=only — the hint surfaces the exact command. For Xcelium flows there is no native KDB; get_diagnostic_snapshot will list build_kdb in missing_steps so the LLM agent can produce one on demand. Set TRACEWEAVE_AUTO_KDB=0 to opt out of the auto-build suggestion.
Usage telemetry
When enabled, TraceWeave appends one JSONL line per tool call to $TRACEWEAVE_CACHE_DIR/telemetry/usage.jsonl (default ~/.cache/traceweave/telemetry/) — tool name, argument keys and a few scalar flags (never argument values or paths), result size, latency, a session id anchored to each get_sim_paths case, and on failed calls a classification error_code (a code or exception class name, never the message). It is local-only (nothing is sent anywhere) and exists to quantify which tools actually get used. The telemetry directory and JSONL are tightened to owner-only 0700/0600 on every append, including an existing file created under a permissive umask. The normal user default is that TRACEWEAVE_TELEMETRY is absent; recording is then disabled and no telemetry file is written. To opt in, set TRACEWEAVE_TELEMETRY=1 before starting the MCP server, then restart or reconnect it after changing the value.
Source Graph calls use a second independently validated allowlist of numeric/fixed-label diagnostics, including memory/disk/build/handoff tier and process resource aggregates. When the opt-in semantic session is active, it also reports frontend launches and session hit/miss/restart/eviction counts. When the opt-in disk cache is enabled, it additionally carries exact disk hit/miss/corrupt/build-skip counts, frontend launches, lookup/read/validate/write/publish/eviction timings, and artifact bytes/entry counts. It never persists artifact fingerprints, cache/source/wave paths, signal/scope/value content, diagnostics, or exception text. python3.11 scripts/telemetry_report.py reports per-tool and per-session usage plus Source Graph tier counts, exact disk hit rate, validation outcomes, builds/skips, bytes/entries/evictions, and p50/p95 latency by tier. Its query-frequency block also reports metric-bearing Source Graph calls per case and the count of adjacent same-case calls completing within the default 60-second session window. That count is only an upper bound on reuse opportunity: a shared case does not prove the calls select the same eligible semantic context. Add --json for machine-readable output. Use a fresh private TRACEWEAVE_CACHE_DIR when an operational soak needs an isolated observation window.
Testing
Run the full test suite from the repo root:
python3.11 -m pytest
Run a single file:
python3.11 -m pytest tests/test_server.py
Run a single test:
python3.11 -m pytest tests/test_server.py -k diagnostic_snapshot
Recommended change flow:
- Make the code change.
- Run the relevant tests first.
- Run the full suite if the change affects shared behavior.
- Restart the MCP client so it reconnects to the updated server.
Follow the WeChat public account:

1 maintainer

Download files
Download the file for your platform. If you're not sure which to choose, learn more about installing packages.
Source Distribution
Built Distribution
Filter files by name, interpreter, ABI, and platform.
If you're not sure about the file name format, learn more about wheel file names.
Copy a direct link to the current filters
File details
Details for the file traceweave_mcp-2.0.1.tar.gz.
File metadata
- Download URL: traceweave_mcp-2.0.1.tar.gz
- Upload date:
- Size: 580.4 kB
- Tags: Source
- Uploaded using Trusted Publishing? Yes
- Uploaded via:
twine/7.0.0 CPython/3.13.14
File hashes
| Algorithm | Hash digest | |
|---|---|---|
| SHA256 |
1cde4b68cf4a0649da6a2683660b48dc4db533d3c829199005ea0b1db243d02e
|
|
| MD5 |
a3559c2a2b905c047543b26de169f5da
|
|
| BLAKE2b-256 |
3b12bca58653e4b0113e7f8a4610ecdf9cd2a218ff38ad84a5e262a2f1edd5e5
|
Provenance
The following attestation bundles were made for traceweave_mcp-2.0.1.tar.gz:
Publisher:
release.yml on gokeshenzhen/TraceWeave
-
Statement:
-
Statement type:
https://in-toto.io/Statement/v1 -
Predicate type:
https://docs.pypi.org/attestations/publish/v1 -
Subject name:
traceweave_mcp-2.0.1.tar.gz -
Subject digest:
1cde4b68cf4a0649da6a2683660b48dc4db533d3c829199005ea0b1db243d02e - Sigstore transparency entry: 2650242829
- Sigstore integration time:
-
Permalink:
gokeshenzhen/TraceWeave@91720e8adb85e7f51d67c5e54ea5c836ae0c4ad2 -
Branch / Tag:
refs/tags/v2.0.1 - Owner: https://github.com/gokeshenzhen
-
Access:
public
-
Token Issuer:
https://token.actions.githubusercontent.com -
Runner Environment:
github-hosted -
Publication workflow:
release.yml@91720e8adb85e7f51d67c5e54ea5c836ae0c4ad2 -
Trigger Event:
push
-
Statement type:
File details
Details for the file traceweave_mcp-2.0.1-py3-none-any.whl.
File metadata
- Download URL: traceweave_mcp-2.0.1-py3-none-any.whl
- Upload date:
- Size: 548.4 kB
- Tags: Python 3
- Uploaded using Trusted Publishing? Yes
- Uploaded via:
twine/7.0.0 CPython/3.13.14
File hashes
| Algorithm | Hash digest | |
|---|---|---|
| SHA256 |
7244b07e08cb5408c3c7ec919b8b320e84087728a280e9a8b5766399b6af4ba5
|
|
| MD5 |
9effecf3570a6fc935054708592ff780
|
|
| BLAKE2b-256 |
ce435fe65b523b00deb090b39ab198c891f54702e5aa3cb8c3e38b10cbc86366
|
Provenance
The following attestation bundles were made for traceweave_mcp-2.0.1-py3-none-any.whl:
Publisher:
release.yml on gokeshenzhen/TraceWeave
-
Statement:
-
Statement type:
https://in-toto.io/Statement/v1 -
Predicate type:
https://docs.pypi.org/attestations/publish/v1 -
Subject name:
traceweave_mcp-2.0.1-py3-none-any.whl -
Subject digest:
7244b07e08cb5408c3c7ec919b8b320e84087728a280e9a8b5766399b6af4ba5 - Sigstore transparency entry: 2650242883
- Sigstore integration time:
-
Permalink:
gokeshenzhen/TraceWeave@91720e8adb85e7f51d67c5e54ea5c836ae0c4ad2 -
Branch / Tag:
refs/tags/v2.0.1 - Owner: https://github.com/gokeshenzhen
-
Access:
public
-
Token Issuer:
https://token.actions.githubusercontent.com -
Runner Environment:
github-hosted -
Publication workflow:
release.yml@91720e8adb85e7f51d67c5e54ea5c836ae0c4ad2 -
Trigger Event:
push
-
Statement type:














