
trainspotter
Spot what went wrong in a training run before you burn another GPU-day. Automatic diagnosis of loss curves and training logs.




Every ML engineer has stared at a TensorBoard or W&B chart trying to answer
"is this run okay?" -- and caught the answer late: a spike that should have
triggered a restart three hours ago, an eval curve that's been overfitting
since epoch 4, a learning-rate schedule that never actually warmed up. The
signal was in the log the whole time. trainspotter reads the log a run
already writes and turns eyeballing into a report: which pathologies were
detected, where (step ranges), the evidence behind each, and the usual
fixes. It runs post-hoc on a finished log, live via watch on a growing
one, or as a CI gate that fails the build.
Report
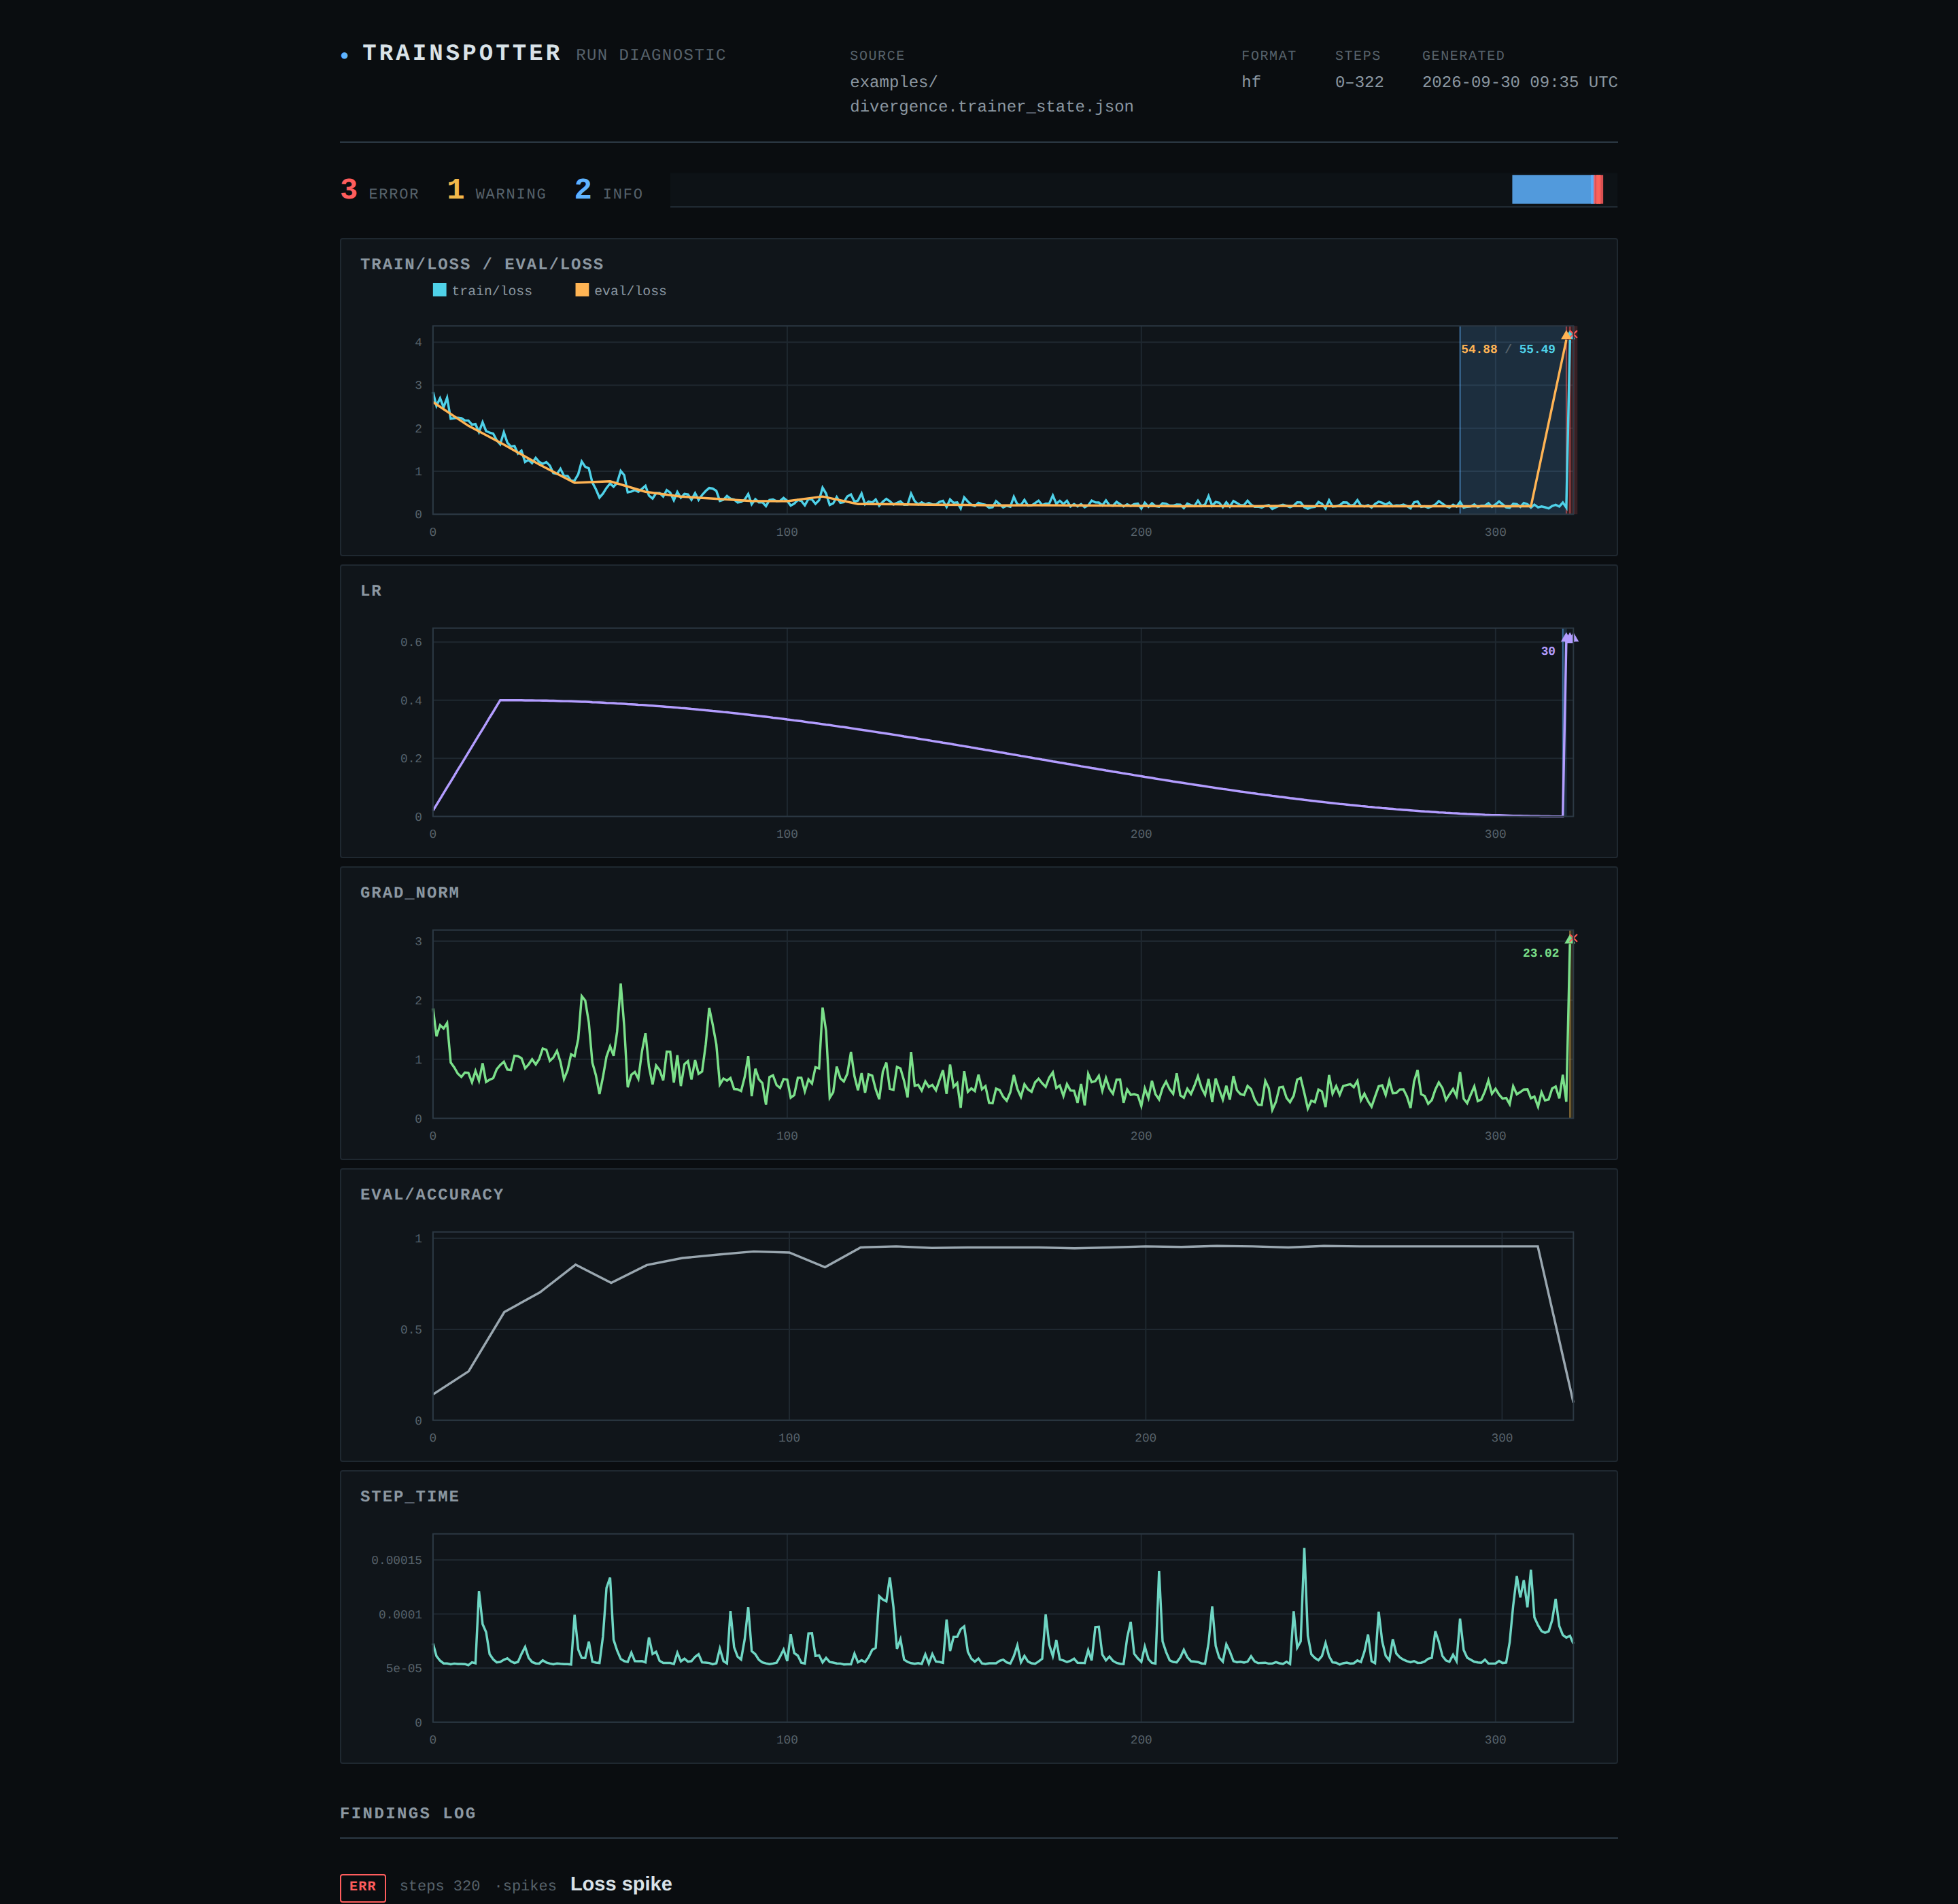
(top of the report -- full report, all 5 charts + all 6 findings)
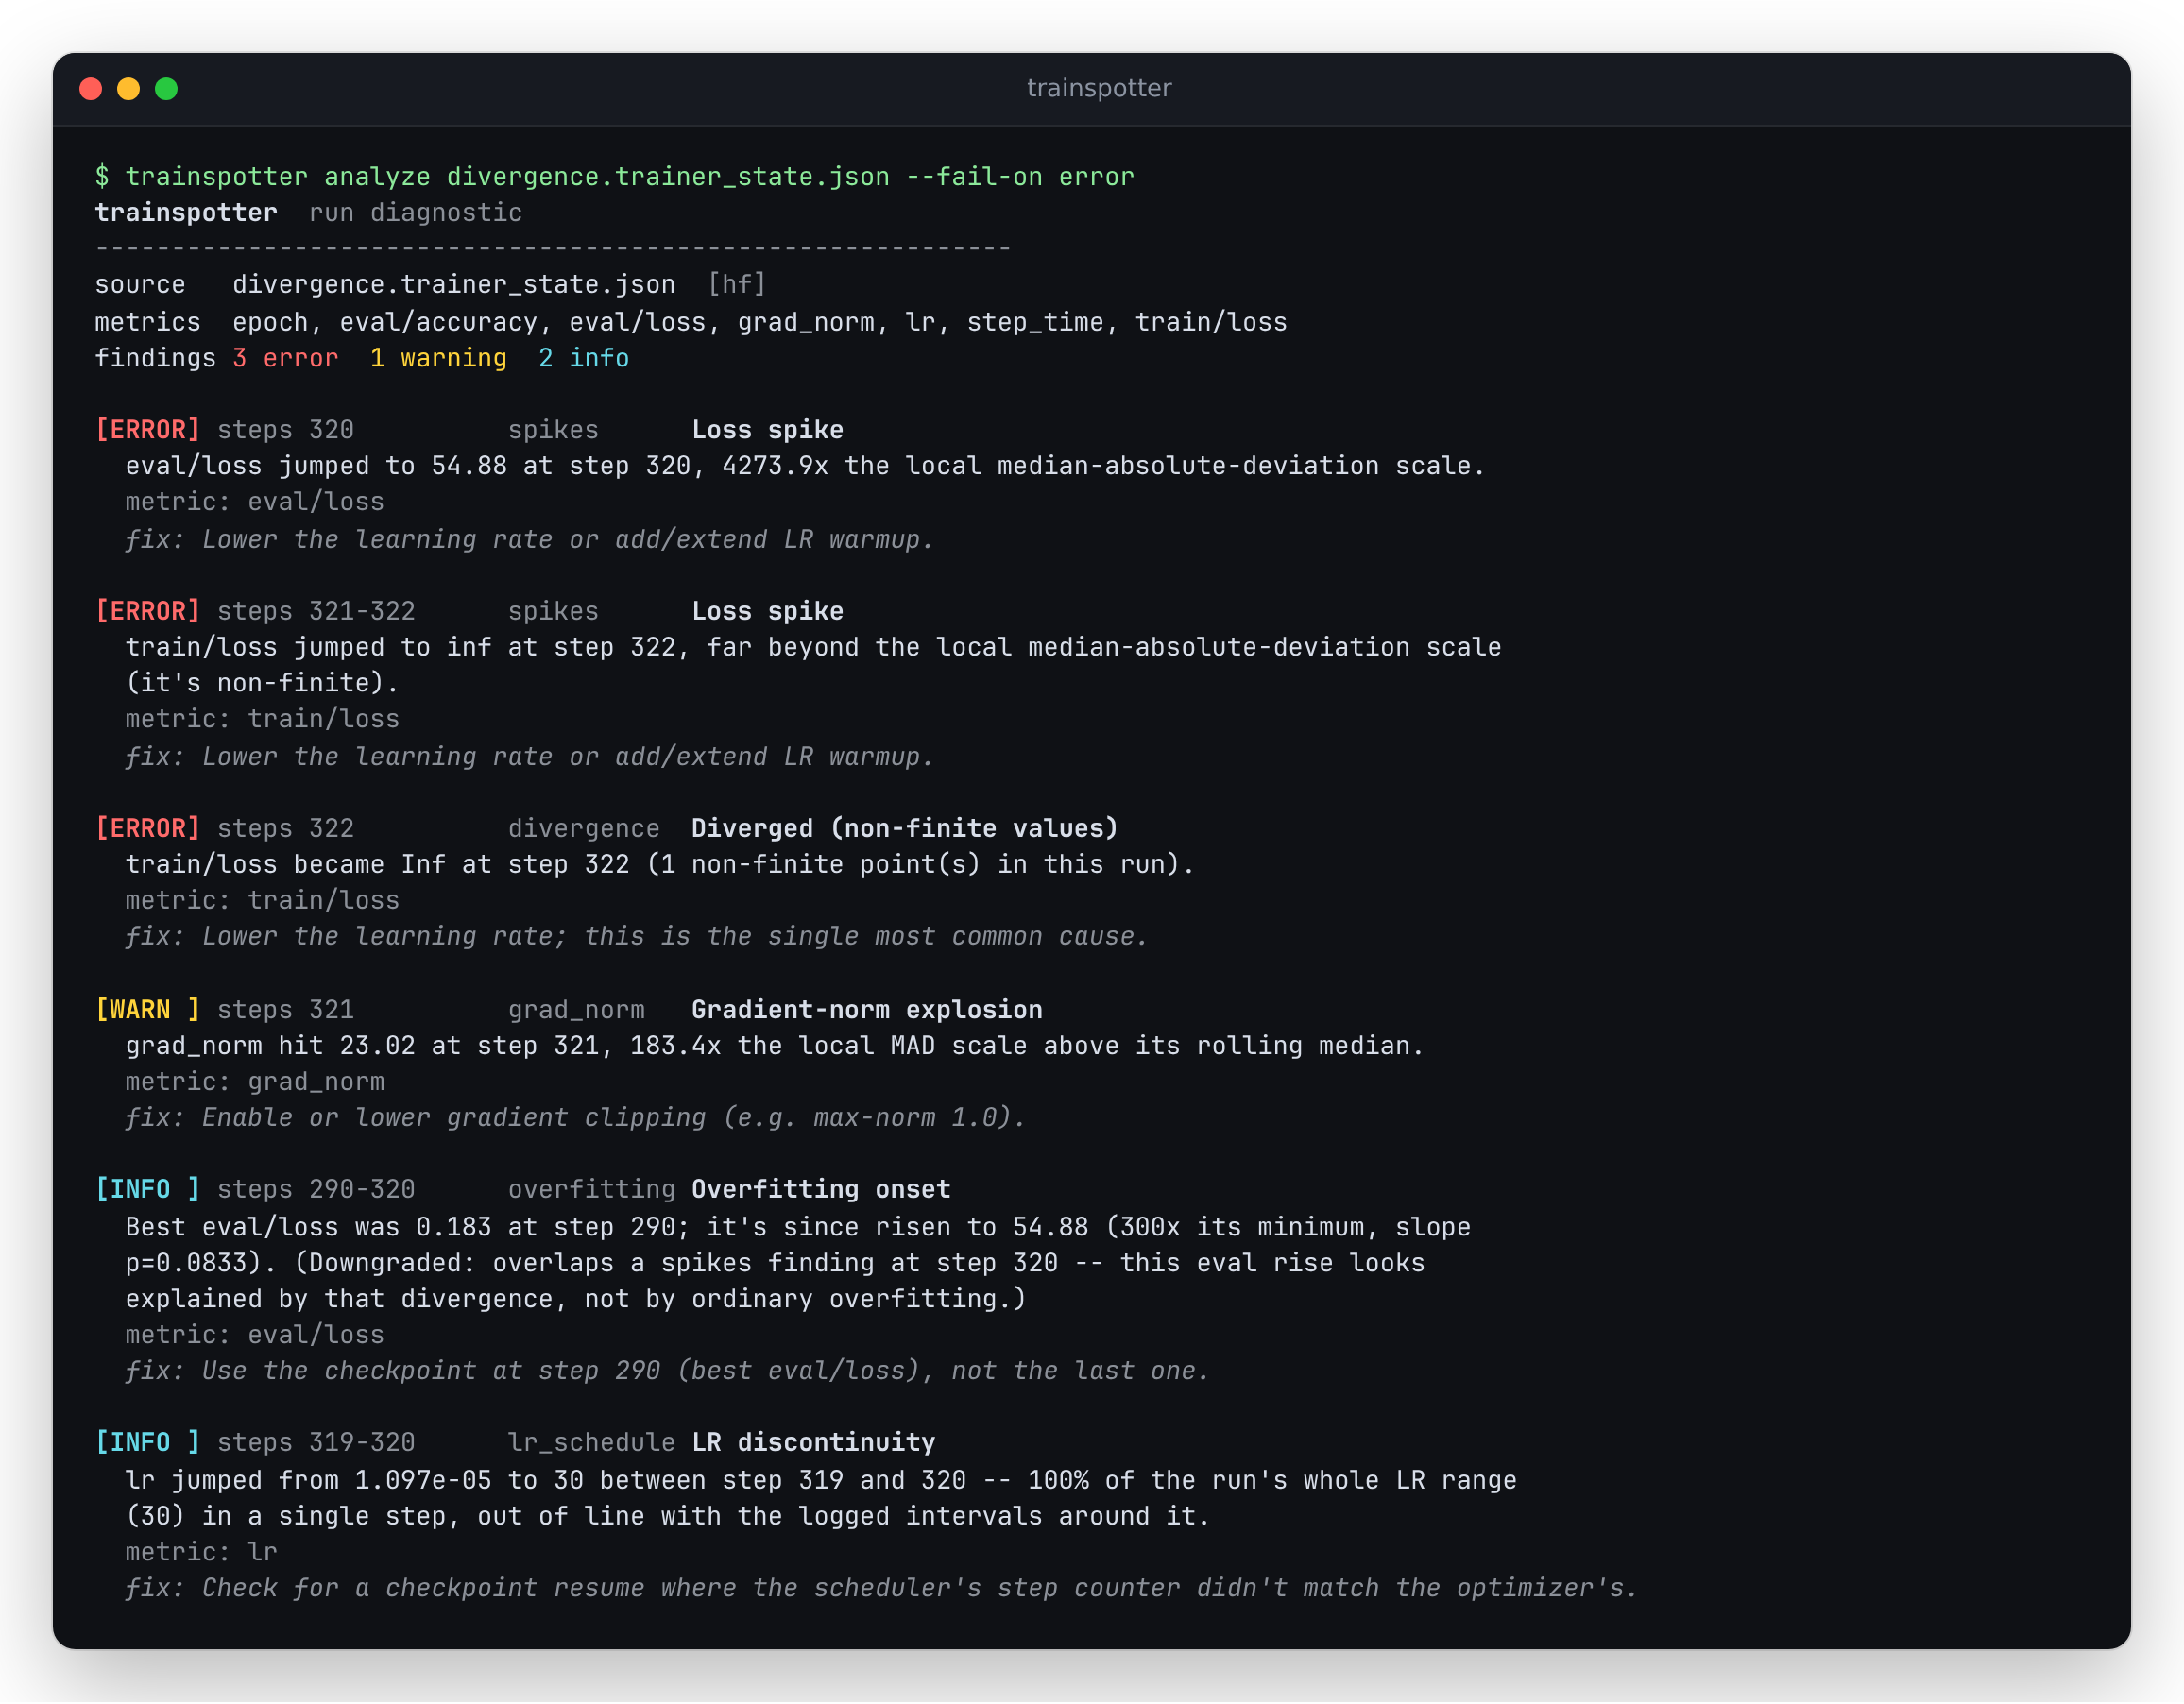
Browse every example's full HTML report at
antonsoo.github.io/trainspotter
(built by scripts/build_site.py). Both images above are real output from examples/divergence.trainer_state.json (see
Real demo data for exactly how that log was produced).
Quickstart
pip install trainspotter
git clone --depth 1 https://github.com/antonsoo/trainspotter && cd trainspotter
trainspotter analyze examples/divergence.trainer_state.json
Or point it at your own log:
trainspotter analyze path/to/trainer_state.json --output html --out report.html
Features
- Five readers, auto-detected from the file: Hugging Face
trainer_state.json, generic CSV/JSONL, Weights & Biases CSVs (a run's history, or a chart's export), PyTorch LightningCSVLoggermetrics.csv, and TensorBoard logdirs (pip install trainspotter[tensorboard]). - Reads logs the way tools really write them. The names
transformers.Trainersends to W&B and TensorBoard (train/learning_rate,train/grad_norm), Lightning'strain_loss_stepandlr-AdamW, Keras'strain/andvalidation/directories,add_scalars' directory per curve, a run resumed from a checkpoint, and a W&B chart export or a logdir that holds several runs (one is analysed, the others are listed;--runpicks). See What it reads. - Nine detectors -- see the table below -- each with a documented algorithm, tunable thresholds, and stated false-positive modes.
- Three report formats: a color-coded terminal report, JSON (stable schema, for tooling), and a self-contained HTML report (inline SVG charts, no CDN, no JavaScript -- opens from disk, works offline forever).
- CI gating:
--fail-on warning|errorexits non-zero if any finding at or above that severity was found. - Live tailing:
trainspotter watch <file>re-reads a growing log on an interval and prints only newly-appeared findings. - numpy is the only required dependency. No pandas, no plotting
library, no web framework. (
tensorboardsupport is an optional extra since parsing the event-file format properly needstbparse.)
Usage
# Terminal report (default), with a CI-style exit code
trainspotter analyze run/trainer_state.json --fail-on error

# Machine-readable JSON
trainspotter analyze run/trainer_state.json --output json > findings.json

# Self-contained HTML report
trainspotter analyze run/trainer_state.json --output html --out report.html

# Force a reader instead of auto-detecting from the extension
trainspotter analyze run/metrics.csv --format lightning

# A TensorBoard logdir, or a W&B chart export, with several runs in it
trainspotter analyze runs/ --run lr-1e-3

# Tail a log that's still being written
trainspotter watch run/trainer_state.json --interval 5 --fail-on error
Real terminal output (from examples/overfitting.trainer_state.json, one
finding shown):
[WARN ] steps 125-799      overfitting Overfitting onset
  Best eval/loss was 0.526 at step 125; it's since risen to 0.5554 (5.6%, slope p<0.0001).
  Meanwhile train/loss kept falling over the same range (slope < 0) -- the classic
  overfitting signature.
  metric: eval/loss
  fix: Use the checkpoint at step 125 (best eval/loss), not the last one.
What it reads
| Source | What is in it | How it is read |
|---|---|---|
trainer_state.json |
log_history of one transformers.Trainer run |
Every entry with a step; the closing summary entry (train_runtime, the run's average train_loss) is metadata, not a point |
| W&B run history CSV | _step, _runtime, one column per logged key |
As logged; _-prefixed bookkeeping columns are skipped |
W&B chart export (wandb_export_*.csv) |
Step, then <run> - <metric>, ...__MIN, ...__MAX for every run drawn |
One run; the MIN/MAX band columns are not metrics |
| W&B runs table | One row per run (Name, State, Runtime, config...) |
Refused: its rows are different runs, not steps |
Lightning metrics.csv |
step, epoch, sparse metric columns |
Blank cells skipped; train_loss_step is the loss curve, train_loss_epoch keeps its name |
| TensorBoard logdir | Event files, in one directory or a tree | Split directories (train/, validation/) and add_scalars directories (Loss_train/) are parts of one run; other subdirectories are runs. A restart that rewinds the step counter replaces what the earlier session wrote from that step on, as TensorBoard itself shows it |
| Any CSV / JSONL | A step column and numeric columns |
As is |
Names are mapped onto the vocabulary the detectors look for (train/loss,
eval/loss, lr, grad_norm, step_time, throughput, epoch), one
logged metric per name: of lr-AdamW/pg1 and lr-AdamW/pg2, the first is
lr and the second keeps its own name. A name that only looks alike
(val/box_loss, test/loss) is left alone.
A source with several runs is analysed one run at a time: the run with the
most points, unless --run names another (its name, or the start of it).
Real output, for two of the bundled example runs written as one TensorBoard
logdir:
$ trainspotter analyze runs
source   runs  [tensorboard]
run      lr-3e-4  1 of 2 in this source; --run picks another: lr-1e-3
metrics  eval/loss, grad_norm, lr, train/loss
findings 0 error  0 warning  0 info

No pathologies detected. Clean run, or nothing this detector set covers.

$ trainspotter analyze runs --run lr-1e-3
source   runs  [tensorboard]
run      lr-1e-3  1 of 2 in this source; --run picks another: lr-3e-4
metrics  eval/loss, grad_norm, lr, train/loss
findings 3 error  1 warning  2 info
...
CI usage
- name: Diagnose the training run
  run: trainspotter analyze runs/latest/trainer_state.json --fail-on error
  # exits 1 if any error-severity pathology was detected
Detectors
Every detector's full algorithm and false-positive list lives in its
module's docstring (src/trainspotter/detectors/*.py); this table is the
summary.
| Detector | Detects | How | Stated false-positive modes |
|---|---|---|---|
spikes |
A sudden jump in a loss metric | Modified z-score (0.6745·(x−median)/MAD) against a trailing rolling median/MAD; flags |z| > 6 |
Deliberate LR restarts/curriculum jumps; bumpy metrics with a too-small window |
divergence |
NaN/Inf, or sustained upward drift | Any non-finite value; or an OLS slope > 0 with p < 0.05 over the tail window, and the last value ≥ 1.5× the running minimum | Metrics meant to increase (only checks loss-type metrics by default); a temporary cyclic-schedule upswing |
plateau |
A metric that's stalled, not just converged | Sliding-window OLS slope test (p ≥ 0.2 = not significant) plus a < 2% relative-change guard; suppressed if the window has already recovered ≥ 80% of the metric's total drop, or lr has decayed to ≤ 30% of its peak |
A real stall near a coincidentally low value, or right as an unrelated LR decay finishes, can be wrongly suppressed by the convergence check |
overfitting |
Train still improving while eval worsens | Finds eval's running-minimum step; tests whether the slope after it is significantly positive (p < 0.1) and ≥ 1% above the minimum | A noisy eval set can show a false uptick; a mid-run change in eval data |
lr_schedule |
Missing warmup, LR rising after its peak, discontinuities | Ramp check on the first value vs. peak; running-max monotonicity after the peak; a jump of ≥ 20% of the LR's total range that isn't one leg of a steady ramp | Cyclic/warm-restart schedules trip the last two by design; step-decay drops are reported as info |
grad_norm |
Gradient-norm explosions and clipping saturation | Same z-score as spikes (one-sided) for explosions, threshold 10 (higher than spikes' 6 -- a single z of 6-8 is common early-training noise); fraction of a trailing window within 0.5% of its own max, for saturation |
Norms logged post-clip are saturated by construction; an isolated explosion with no coinciding loss spike is weaker evidence than one that lines up with a spikes finding |
throughput |
Step-time / throughput regressions | Median step time, early-run baseline window vs. recent window, flags ≥ 1.4× | Checkpoint/eval steps inflate single points; early-run kernel/dataloader warmup can pollute the baseline |
eval_noise |
An eval metric too noisy to rank checkpoints by | Median absolute step-to-step jitter as a fraction of the run's total improvement; flags ≥ 15% | An already-converged run has small total improvement by construction |
loss_floor |
Implausibly low train loss very early (heuristic) | Loss < 0.05 absolute and < 5% of its starting value within the first 10% of steps | Explicitly a heuristic: an easy task, a small-scale loss, or a resumed checkpoint all look identical to this |
Trust the healthy case
A tool that flags an unremarkable run gets ignored, and recall on real
incidents matters less than that first impression -- so trainspotter is
tested for silence, not just for alarms. On the healthy baseline run,
trainspotter reports no warnings, and tests/test_examples_regression.py
asserts this on every commit, alongside asserting that the other four
examples still flag the pathology they were built to demonstrate. Findings
are also ordered errors-first, then warnings, then info (chronological
within a level) -- so on a run that did break, the thing that broke
leads the report instead of sitting below routine early-training noise.
How it works
Data model. Every reader converges on one shape
(trainspotter.model.Run): a dict of named metric series, each a list of
(step, value, wall_time) points. Detectors and reports only ever see
this shape -- they have no idea whether the log came from transformers,
a CSV, or TensorBoard. Readers normalize common spellings (loss /
train_loss / Loss/train / train_loss_step become train/loss;
learning_rate / train/learning_rate / lr-AdamW become lr; see
What it reads) but pass anything unrecognized straight
through, so a custom metric like eval/bleu still reaches the detectors
under its own name.
Robust statistics, not raw thresholds. Spikes and gradient-norm
explosions are judged by a modified z-score against a trailing rolling
median and MAD (median absolute deviation), not a mean/stddev: a mean and
stddev are themselves dragged around by the very outlier you're trying to
detect, while the median and MAD barely move. This is the same construction
Iglewicz & Hoaglin describe for outlier labeling. Plateau and overfitting
use an ordinary-least-squares slope with a normal-approximation t-test
(math.erf-based, no scipy dependency) rather than eyeballing "did it go
up or down."
Charts don't let one spike flatten the rest of the curve. The HTML
report's axis logic (report/html_report.py) picks tick spacing with
Heckbert's "nice numbers" algorithm (Graphics Gems, 1990 -- 1/2/5x10^n
steps, not whatever an even split of the range happens to produce) and
floors the axis at 0 for the non-negative metrics trainspotter charts
(loss, LR, grad_norm, accuracy, step time), instead of padding below zero.
If the max is more than 1.5x the 99th percentile, the axis caps at that
instead of stretching to fit one outlier -- the point is still drawn,
clamped to the top edge with a small triangle and its real value labeled
next to it, not hidden.
Every finding is honest about its own limits. Each detector's
docstring states its false-positive modes in plain language (see the table
above, or the source for the full version) -- this isn't boilerplate, it's
meant to be read before you act on a finding. loss_floor is explicitly
labeled a heuristic, not a statistical test, because there's no
distribution-free way to know a loss is "too low" without knowing the task.
Real demo data
Nothing in examples/ is fabricated. All five logs were produced by
examples/generate_examples.py, which trains a small hand-written numpy
MLP (64 → 32 ReLU → 10, softmax cross-entropy, every gradient computed and
applied by hand -- no autodiff framework) on scikit-learn's load_digits
dataset (1797 real 8×8 handwritten-digit images, bundled with
scikit-learn, no download). It's deterministic (seeded) and takes about
three seconds to regenerate on this machine:
uv sync --extra examples   # or: pip install scikit-learn
uv run python examples/generate_examples.py
| File | What it is | How the pathology was actually induced |
|---|---|---|
baseline |
A normal, unremarkable run | Full dataset, weight decay, cosine LR with warmup. On this run, trainspotter reports no warnings -- see Trust the healthy case for why that's asserted by a test, not just eyeballed |
divergence |
A genuine crash after real training | 320 steps (80% of the run) of ordinary warmup + cosine-decay training -- loss ~2.8 -> ~0.15, eval accuracy up to ~96% -- then a simulated incident at step 320: the LR schedule jumps to 30 and the loss function switches to a version with the classic missing-max-subtraction softmax bug. Plain high LR alone was tried first and didn't produce real divergence -- see the note in divergence_run()'s docstring for why (softmax cross-entropy's gradient is bounded by construction) |
overfitting |
Genuine overfitting | Only 4 training examples per class (40 total), no regularization, 800 steps -- the model memorizes the training set while held-out eval loss turns upward after step 125 |
missing_warmup |
No LR ramp-up | LR set to a constant 0.5 from step 0, no warmup phase at all |
throughput_drop |
A real, measured slowdown | Steps 150-259 insert an actual time.sleep(0.02) per step (simulating e.g. I/O contention) -- step_time in the log is genuinely measured wall-clock time, not a fabricated number |
Each file is committed in both HF trainer_state.json format
(<name>.trainer_state.json) and generic CSV (<name>.csv), written from
the same in-memory log so the two are guaranteed consistent.
A real transformers.Trainer run
examples/transformers_tinygpt2.trainer_state.json is a genuine
trainer_state.json written by transformers.Trainer itself (not the
numpy MLP above): a real 2-layer, 64-dim GPT-2 (GPT2LMHeadModel from a
from-scratch GPT2Config, ~330K parameters), trained for 6 epochs / 726
steps on CPU on a small hand-written toy corpus (short sentences about
training, tokenized with the real gpt2 tokenizer), in about 90 seconds
on this machine. Regenerate it with
examples/generate_transformers_example.py (needs torch + transformers
in a separate environment -- see the script's docstring for the exact
install commands; they are not project dependencies).
Running trainspotter against it caught a real bug in the HF reader during
development: Trainer.train() appends one extra log_history entry after
training ends -- a run summary with train_runtime, train_samples_per_second,
and a train_loss key that is the average loss over the whole run, not a
per-step reading. The reader's first version merged that average straight
into the train/loss series (since train_loss is one of the recognized
spellings of loss), which showed up as a fake spike on the run's last
step. The fix -- detect that entry by its unique train_runtime key and
route it to run metadata instead of a metric point -- is
src/trainspotter/readers/hf.py's _SUMMARY_MARKER_KEY, and
tests/test_readers.py::test_hf_trainer_state_excludes_the_final_run_summary_entry
pins it. This is exactly the kind of gap a hand-written fixture can miss
and a real framework's output finds immediately -- the reason this example
was worth the extra torch install.
It also exposed a false positive, now fixed: the first version reported an
lr_schedule "LR discontinuity" at steps 5-10, because logging_steps=5
logs the 20-step warmup so coarsely that each logged interval covers 25% of
the run's LR range. The discontinuity check now reports a jump only when it
stands out from the logged intervals around it (a neighbor moving the same
way at no less than half the per-step rate makes it one leg of a steady
ramp), and says how many steps the interval spans. On this run trainspotter
reports nothing, which
tests/test_detector_lr_schedule.py::test_the_real_transformers_run_has_no_lr_finding
pins.
Accuracy and limitations
- Every threshold in this README and in the detector table is a default,
not a law of nature -- they're tuned to be reasonable on the example
runs above, not validated against a large corpus of real training
incidents. Expect to adjust
window,threshold,alpha, etc. for your own runs' scale and logging frequency. - Readers are tested against real files, not remembered schemas: every
reader in
tests/test_readers.pyis exercised against a file this repo's test suite writes to disk in the documented format. The TensorBoard reader is tested against real event files written by TensorBoard's ownEventFileWriter.tests/test_real_layouts.pywrites the bundled example runs the way other tools would have logged them (a W&B history and chart export of atransformersrun, four TensorBoard layouts, a Lightningmetrics.csv) and requires the findings the original gives. The W&B chart export's column layout was checked against exports committed to public repositories; it is not written by W&B in these tests. - One run at a time. From a source with several runs, one is analysed
and
--fail-ongates that run only. A run is told from a split of a run by its directory name (train,validation,val,eval,test), so a run literally namedtrainnext to other runs is read as a split. - Detectors are tested against synthetic signals with known ground
truth: a spike planted at step k must be found at step k; a clean
curve must produce zero findings. See
tests/test_detector_*.py. A separate regression test (tests/test_examples_regression.py) runs the whole detector set against all five real example logs and asserts the healthy baseline stays quiet while the other four still flag what they're supposed to. - No detector here is a substitute for understanding your training run. They're heuristics built to reduce how often you have to stare at a chart by eye, not a certified diagnosis -- read the false-positive modes in the detector table before trusting a finding blindly.
trainspotter watchre-reads the whole file on every poll (default every 2s) rather than tailing new bytes; fine for the log sizes this tool targets (thousands to tens of thousands of steps), not designed for gigabyte-scale logs.- The OLS significance tests (
plateau,overfitting,divergence's sustained-growth check) use a normal approximation to the t-distribution, accurate for windows of about 30+ points; on shorter windows they're slightly anti-conservative, which is why each detector also requires a minimum window size before trusting the test.
Development
uv sync --all-extras --dev
uv run pytest                        # 141 tests
uv run ruff check src tests examples
uv run mypy src
See CONTRIBUTING.md for the detector-contribution pattern.
Contributing
Issues and PRs are welcome -- see CONTRIBUTING.md.
License
MIT © 2026 Anton Soloviev
Part of Officina, a set of small open-source tools by Anton Soloviev.
1 maintainer

Metadata
1 maintainer
Release files for trainspotter 0.2.1
For a detailed explanation of source distributions (sdists) and built distributions (wheels), please see the package formats documentation.
Source distribution (sdist)
| File | Size | Uploaded | |
|---|---|---|---|
| trainspotter-0.2.1.tar.gz | 66.6 kB | Details |
Built distribution (wheel)
| File | Interpreter | ABI | Platform | Reset |
|---|---|---|---|---|
| trainspotter-0.2.1-py3-none-any.whl | Python 3 | none | any | Details |
Total release size: 137.1 kB
Release files / trainspotter-0.2.1.tar.gz
| Download URL | trainspotter-0.2.1.tar.gz |
|---|---|
| Size | 66.6 kB |
| Tags | Source |
|
SHA-256 checksum How to use checksums |
668bafc22822aae600ac1d76c9710891871ed08c79912e3cce54b371f4b3b40e
|
|
BLAKE2b-256 checksum How to use checksums |
a361e0bae8623d05aa8b1343f7ab6d23982bd010bfccdf542e86274b1ece295d
|
| Upload date | |
|
Uploaded using Trusted Publishing? What is trusted publishing? |
No |
| Uploaded via |
uv/0.12.21 {"installer":{"name":"uv","version":"0.12.21","subcommand":["publish"]},"python":null,"implementation":{"name":null,"version":null},"distro":{"name":"Ubuntu","version":"24.04","id":"noble","libc":null},"system":{"name":null,"release":null},"cpu":null,"openssl_version":null,"setuptools_version":null,"rustc_version":null,"ci":null}
|
Release files / trainspotter-0.2.1-py3-none-any.whl
| Download URL | trainspotter-0.2.1-py3-none-any.whl |
|---|---|
| Size | 70.5 kB |
| Tags | Python 3 |
|
SHA-256 checksum How to use checksums |
dc9ce9150566569f0d3bd864fa5407ee3433061e4ab9a1aab78c6604097f6df5
|
|
BLAKE2b-256 checksum How to use checksums |
c6107bf6ef97fdd079c0ba03090a158b30c0cfcd1beed991389782234ffb514d
|
| Upload date | |
|
Uploaded using Trusted Publishing? What is trusted publishing? |
No |
| Uploaded via |
uv/0.12.21 {"installer":{"name":"uv","version":"0.12.21","subcommand":["publish"]},"python":null,"implementation":{"name":null,"version":null},"distro":{"name":"Ubuntu","version":"24.04","id":"noble","libc":null},"system":{"name":null,"release":null},"cpu":null,"openssl_version":null,"setuptools_version":null,"rustc_version":null,"ci":null}
|















