Plotly figure widget for trame


Project description

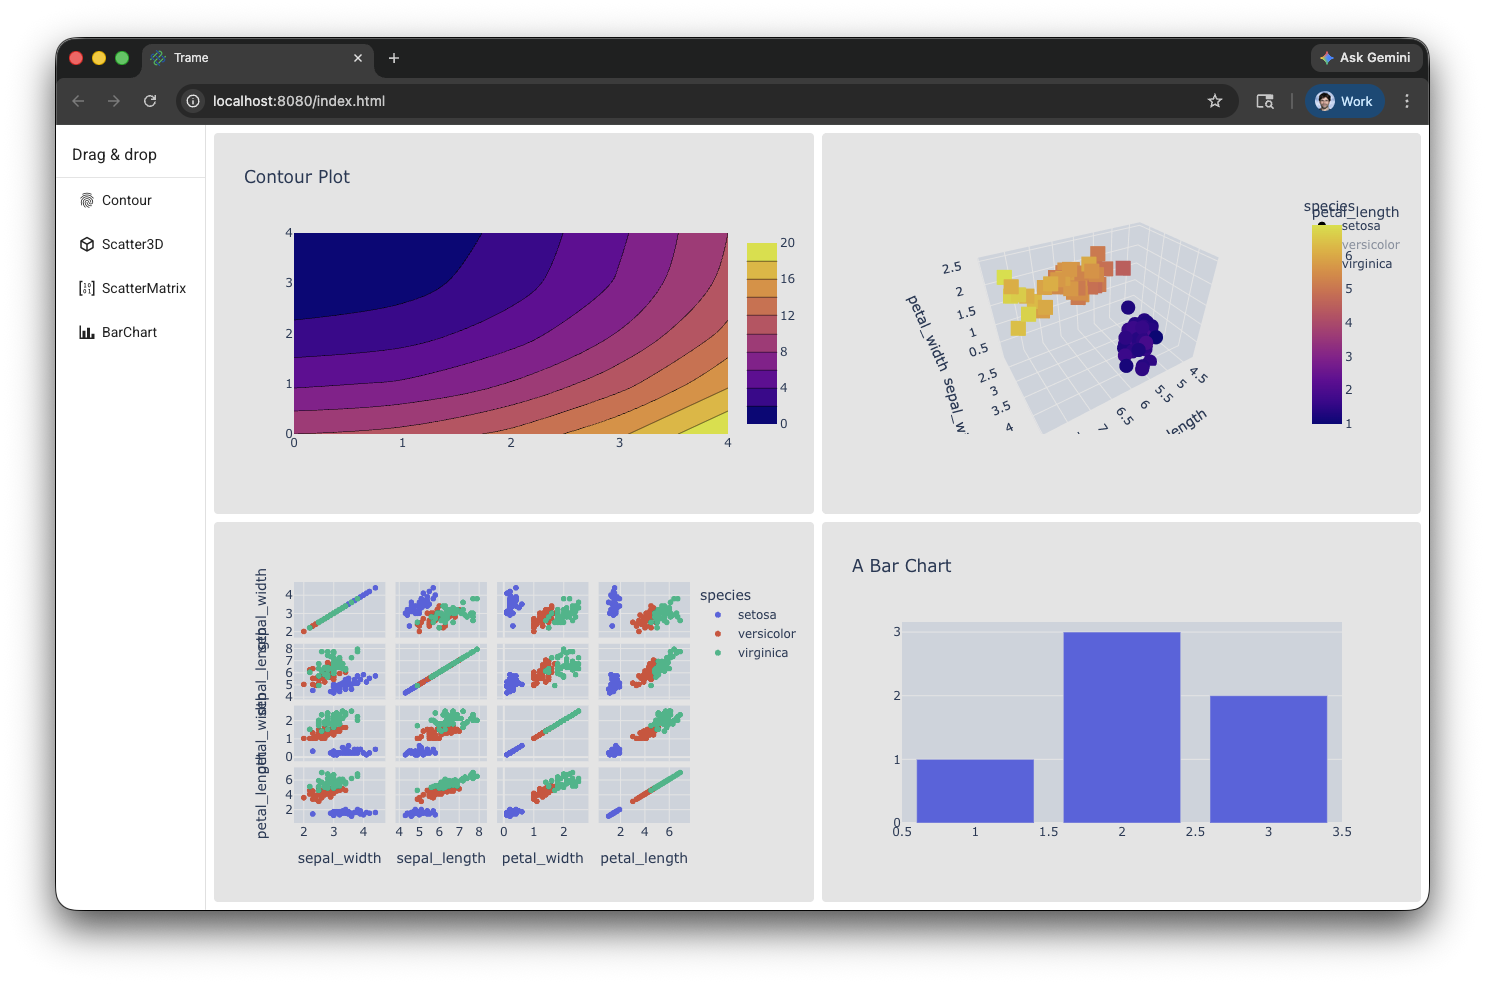
trame-plotly extend trame widgets with components that can interface with Plotly to display their charts.
Plotly integration in trame allow you to create rich visualization by leveraging their Python or JavaScript interface. The JavaScript version is exposed via Vue.plotly within trame.widgets.plotly.Plotly class definition.
This package is not supposed to be used by itself but rather should come as a dependency of trame. For any specificity, please refer to the trame documentation.
Installing
trame-plotly can be installed with pip:
pip install trame-plotlyUsage
The Trame Tutorial is the place to go to learn how to use the library and start building your own application.
The API Reference documentation provides API-level documentation.
The Plotly component relies on the server for generating the chart definition. This can be achieved by hand or by simply using the Python version of Plotly.
How to use it?
Using the Python library
import plotly.graph_objects as go
from trame.widgets import plotly

fig = go.Figure(
    data=go.Contour(
        z=[
            [10, 10.625, 12.5, 15.625, 20],
            [5.625, 6.25, 8.125, 11.25, 15.625],
            [2.5, 3.125, 5.0, 8.125, 12.5],
            [0.625, 1.25, 3.125, 6.25, 10.625],
            [0, 0.625, 2.5, 5.625, 10],
        ]
    )
)
fig2 = go.Figure(
    data=go.Contour(
        z=[
            [5.625, 6.25, 8.125, 11.25, 15.625],
            [2.5, 3.125, 5.0, 8.125, 12.5],
            [10, 10.625, 12.5, 15.625, 20],
            [0.625, 1.25, 3.125, 6.25, 10.625],
            [0, 0.625, 2.5, 5.625, 10],
        ]
    )
)

widget = plotly.Figure(fig)
widget.update(fig2)
But if you are feeling more adventurous you can use the component API directly by building the data yourself as well.
from trame.widgets import plotly

# https://plotly.com/javascript/reference/
plotly_data = [
  {
    "x": [1,2,3,4],
    "y": [10,15,13,17],
    "type": "scatter",
  }
]

# https://plotly.com/javascript/reference/layout/
plotly_layout = {
  "title": "My graph",
}

# https://plotly.com/javascript/configuration-options/
plotly_options = {
  "scroll_zoom": True,
  "editable": True,
  "static_plot": True,
  "to_image_options": {
    "format": "svg", # one of png, svg, jpeg, webp
    "filename": "custom_image",
    "height": 500,
    "width": 700,
    "scale": 1 # Multiply title/legend/axis/canvas sizes by this factor
  },
  "display_mode_bar": True,
  "mode_bar_buttons_to_remove": [
    "zoom2d", "pan2d", "select2d", "lasso2d", "zoomIn2d", "zoomOut2d", "autoScale2d", "resetScale2d", # 2D
    "zoom3d", "pan3d", "orbitRotation", "tableRotation", "handleDrag3d", "resetCameraDefault3d", "resetCameraLastSave3d", "hoverClosest3d", # 3D
    "hoverClosestCartesian", "hoverCompareCartesian", # Cartesian
    "zoomInGeo", "zoomOutGeo", "resetGeo", "hoverClosestGeo", # Geo
    "hoverClosestGl2d", "hoverClosestPie", "toggleHover", "resetViews", "toImage", "sendDataToCloud", "toggleSpikelines", "resetViewMapbox", # Other
  ],
  "mode_bar_buttons_to_add": [
    {
      "name": 'color toggler',
      "icon": icon1, # https://plotly.com/javascript/configuration-options/#add-buttons-to-modebar
      "click": "...",
    },
  ],
  "locale": "fr",
  "display_logo": False,
  "responsive": True,
  "double_click_delay": 1000,
}

# Hand made chart
chart = plotly.Figure(
  data=("chart_data", plotly_data),
  layout=("chart_layout", plotly_layout),
  **plotly_options,
)
Type |
Values |
|---|---|
properties |
data, layout, display_mode_bar, scroll_zoom, editable, static_plot, to_image_options, mode_bar_buttons_to_remove, mode_bar_buttons_to_add, locale, display_logo, responsive, double_click_delay |
events |
after_export, after_plot, animated, animating_frame, animation_interrupted, auto_size, before_export, button_clicked, click, click_annotation, deselect, double_click, framework, hover, legend_click, legend_double_click, relayout, restyle, redraw, selected, selecting, slider_change, slider_end, slider_start, transitioning, transition_interrupted, unhover |
License
trame-plotly is made available under the MIT License. For more details, see LICENSE This license has been chosen to match the one use by Plotly and vue-plotly which are instrumental for making that library possible.
Development
Build and install the Vue components
cd vue-components
npm i
npm run build
cd -
Install the library
# Create venv and install all dependencies
uv sync --all-extras --dev

# Activate environment
source .venv/bin/activate

# Install commit analysis
pre-commit install
pre-commit install --hook-type commit-msg
Community
Trame | Discussions | Issues | Contact Us

Enjoying trame?
Share your experience with a testimonial or with a brand approval.
JavaScript dependency
This Python package bundle the plotly.js-dist-min@3.0.0 JavaScript library. If you would like us to upgrade it, please reach out.
Release history Release notifications | RSS feed


Download files
Download the file for your platform. If you're not sure which to choose, learn more about installing packages.
Source Distribution
Built Distribution
Filter files by name, interpreter, ABI, and platform.
If you're not sure about the file name format, learn more about wheel file names.
Copy a direct link to the current filters
File details
Details for the file trame_plotly-3.1.2.tar.gz.
File metadata
- Download URL: trame_plotly-3.1.2.tar.gz
- Upload date:
- Size: 4.0 MB
- Tags: Source
- Uploaded using Trusted Publishing? Yes
- Uploaded via: twine/6.1.0 CPython/3.13.12
File hashes
| Algorithm | Hash digest | |
|---|---|---|
| SHA256 |
358432cac8295a69275a098d10f75ee3cc3f0638dba1605c56a324ae01a5de15
|
|
| MD5 |
718612ecda0eae5e1bf66c7d44d1dfd2
|
|
| BLAKE2b-256 |
3402d0afe991e91aa4aa0f00ad3664cc1de7cf163ace29ef52ad48d1cfdae3aa
|
Provenance
The following attestation bundles were made for trame_plotly-3.1.2.tar.gz:
Publisher:
test_and_release.yml on Kitware/trame-plotly
-
Statement:
-
Statement type:
https://in-toto.io/Statement/v1 -
Predicate type:
https://docs.pypi.org/attestations/publish/v1 -
Subject name:
trame_plotly-3.1.2.tar.gz -
Subject digest:
358432cac8295a69275a098d10f75ee3cc3f0638dba1605c56a324ae01a5de15 - Sigstore transparency entry: 1288559349
- Sigstore integration time:
-
Permalink:
Kitware/trame-plotly@56fabf304f5668bcf0f2f6b334dd158770a77a6e -
Branch / Tag:
refs/heads/master - Owner: https://github.com/Kitware
-
Access:
public
-
Token Issuer:
https://token.actions.githubusercontent.com -
Runner Environment:
github-hosted -
Publication workflow:
test_and_release.yml@56fabf304f5668bcf0f2f6b334dd158770a77a6e -
Trigger Event:
push
-
Statement type:
File details
Details for the file trame_plotly-3.1.2-py3-none-any.whl.
File metadata
- Download URL: trame_plotly-3.1.2-py3-none-any.whl
- Upload date:
- Size: 4.0 MB
- Tags: Python 3
- Uploaded using Trusted Publishing? Yes
- Uploaded via: twine/6.1.0 CPython/3.13.12
File hashes
| Algorithm | Hash digest | |
|---|---|---|
| SHA256 |
57eabb34d221954a2f5c7b81d4159571f307547168d93532aa16324f33589705
|
|
| MD5 |
c204790388c73e5a7aac2eb1aa44e4f9
|
|
| BLAKE2b-256 |
da2defef08bad8a3eb7428e645a99455aefe6563218667ca8eff0555bba4ad80
|
Provenance
The following attestation bundles were made for trame_plotly-3.1.2-py3-none-any.whl:
Publisher:
test_and_release.yml on Kitware/trame-plotly
-
Statement:
-
Statement type:
https://in-toto.io/Statement/v1 -
Predicate type:
https://docs.pypi.org/attestations/publish/v1 -
Subject name:
trame_plotly-3.1.2-py3-none-any.whl -
Subject digest:
57eabb34d221954a2f5c7b81d4159571f307547168d93532aa16324f33589705 - Sigstore transparency entry: 1288559461
- Sigstore integration time:
-
Permalink:
Kitware/trame-plotly@56fabf304f5668bcf0f2f6b334dd158770a77a6e -
Branch / Tag:
refs/heads/master - Owner: https://github.com/Kitware
-
Access:
public
-
Token Issuer:
https://token.actions.githubusercontent.com -
Runner Environment:
github-hosted -
Publication workflow:
test_and_release.yml@56fabf304f5668bcf0f2f6b334dd158770a77a6e -
Trigger Event:
push
-
Statement type:


