Trend detection on stock time series data

Project description
trendet - Trend detection on stock time series data


Introduction
trendet is a Python package to detect trends on the market so to analyze its behaviour. So on, this package
has been created to support investpy features when it comes to data retrieval
from different financial products such as stocks, funds or ETFs; and it is intended to be combined with it,
but also with every pandas.DataFrame, formatted as OHLC.
Anyways, trendet can also be used to identify trends from any pandas.DataFrame which contains any column with
int64 or float64 values, even though it is intended to be used with stock data; it can also be used for any
pandas.DataFrame.
Installation
In order to get this package working you will need to install it using pip by typing on the terminal:
$ python -m pip install trendet --upgrade
Or just install the current release or a specific release version such as:
$ python -m pip install trendet==0.7
Usage
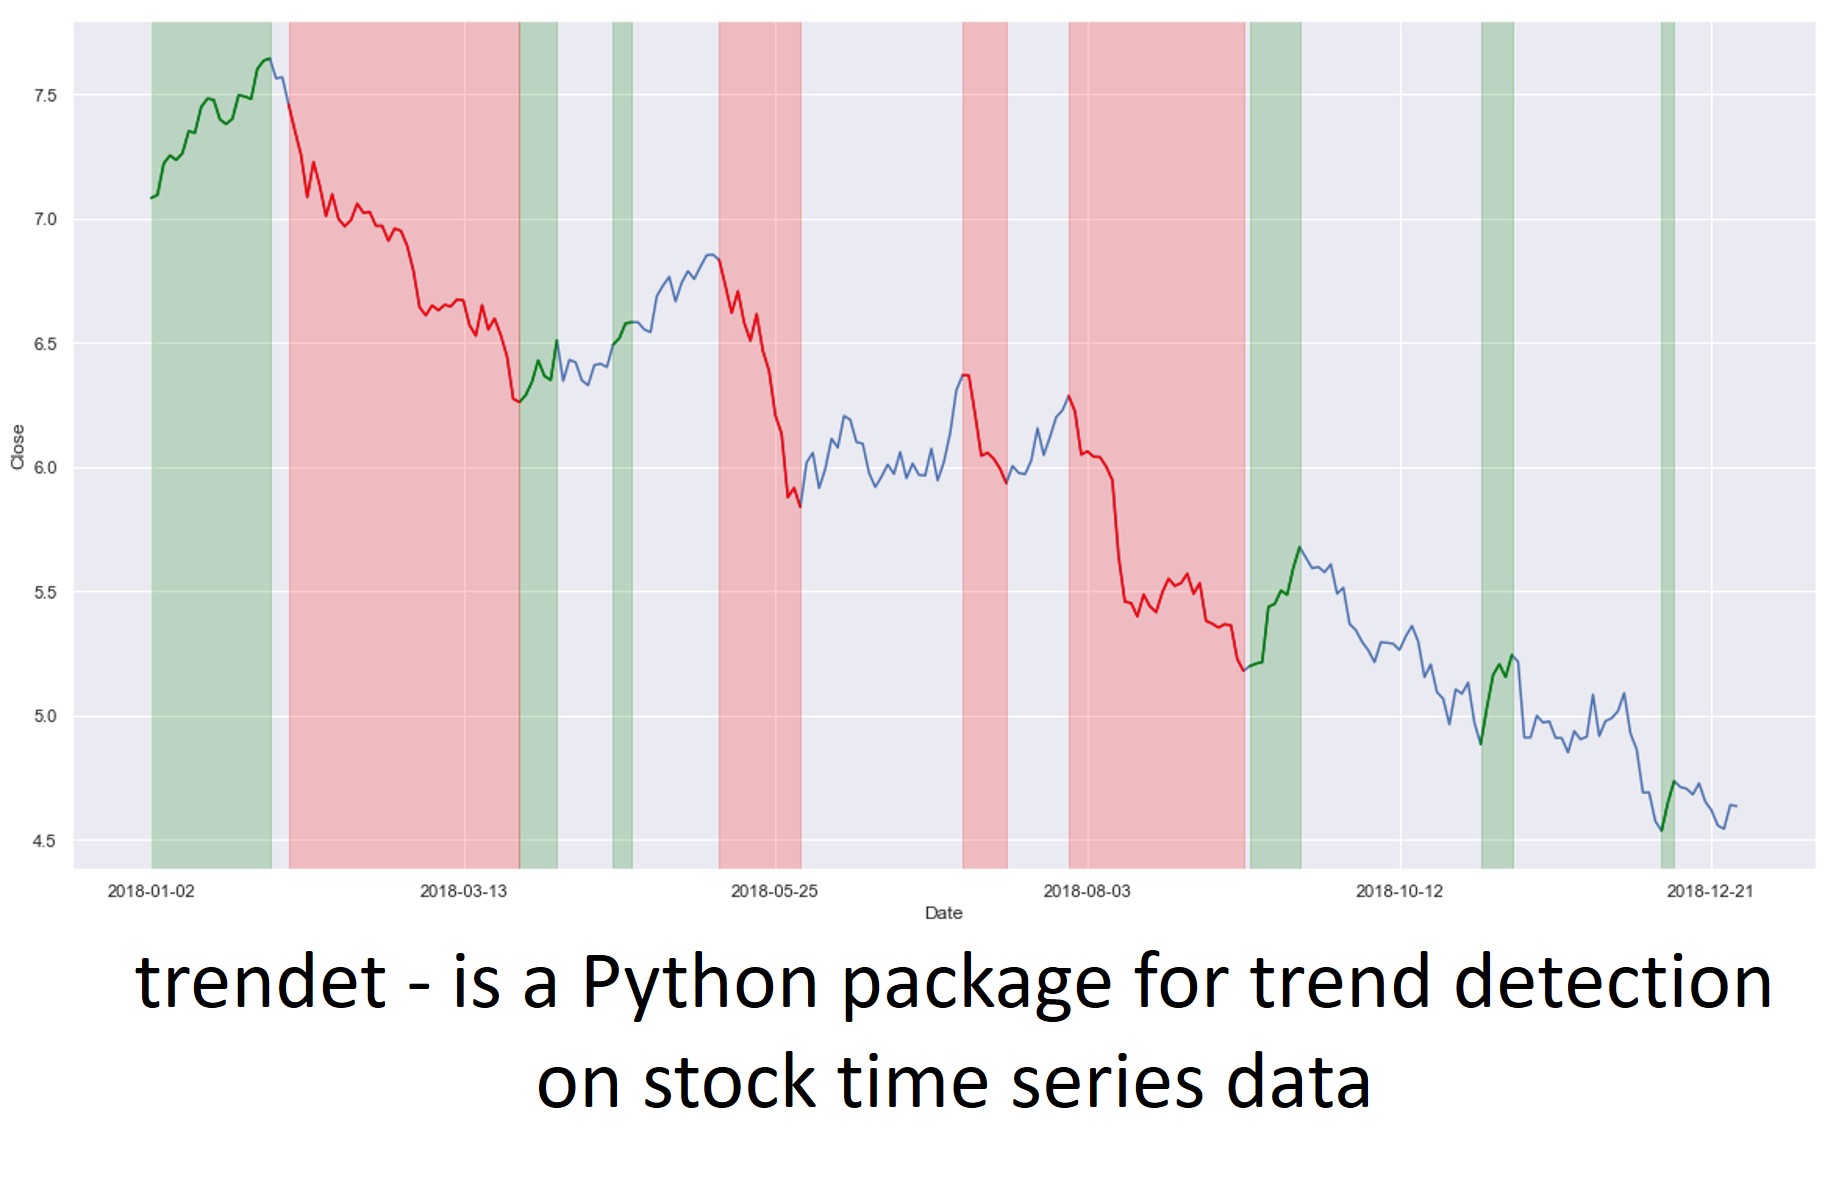
As trendet is intended to be combined with investpy, the main functionality is to detect trends on stock time series data so to analyse the market and which behaviour does it have in certain date ranges.
In the example presented below, the identify_all_trends function will be used to detect every bearish/bullish trend
with a time window above 5 days, which, for example, implies that every bearish (decreasing) trend with a longer
length than 5 days will be identified as a down trend and so on added to a pandas.DataFrame which already contains
OHLC values, in new columns called Up Trend and Down Trend which will be labeled as specified, with letters
from A to Z by default.
import trendet

import matplotlib.pyplot as plt
import seaborn as sns

sns.set(style='darkgrid')

df = trendet.identify_all_trends(stock='BBVA',
                                 country='Spain',
                                 from_date='01/01/2018',
                                 to_date='01/01/2019',
                                 window_size=5,
                                 identify='both')

df.reset_index(inplace=True)

plt.figure(figsize=(20, 10))

ax = sns.lineplot(x=df.index, y=df['Close'])
ax.set(xlabel='Date')

labels = df['Up Trend'].dropna().unique().tolist()

for label in labels:
    sns.lineplot(x=df[df['Up Trend'] == label].index,
                 y=df[df['Up Trend'] == label]['Close'],
                 color='green')

    ax.axvspan(df[df['Up Trend'] == label].index[0],
               df[df['Up Trend'] == label].index[-1],
               alpha=0.2,
               color='green')

labels = df['Down Trend'].dropna().unique().tolist()

for label in labels:
    sns.lineplot(x=df[df['Down Trend'] == label].index,
                 y=df[df['Down Trend'] == label]['Close'],
                 color='red')

    ax.axvspan(df[df['Down Trend'] == label].index[0],
               df[df['Down Trend'] == label].index[-1],
               alpha=0.2,
               color='red')

locs, _ = plt.xticks()
labels = []

for position in locs[1:-1]:
    labels.append(str(df['Date'].loc[position])[:-9])

plt.xticks(locs[1:-1], labels)
plt.show()
Further usage insights can be found on the docs or on the following gist. Anyways, feel free to create your own scripts on how you use trendet or how can it be used in order to improve its features.
Contribute
As this is an open source project it is open to contributions, bug reports, bug fixes, documentation improvements, enhancements and ideas.
Also there is an open tab of issues where anyone can contribute opening new issues if needed or navigate through them in order to solve them or contribute to its solving.
Disclaimer
This package has been created so to identify market trends based on stock historical data retrieved via investpy so to determine which trends have been prevailing on the market based on a single stock OHLC values.
Conclude that this is the result of a research project, so this package has been developed with research purposes and no profit is intended.
Plots have been generated with both matplotlib and seaborn.
Release history Release notifications | RSS feed


Download files
Download the file for your platform. If you're not sure which to choose, learn more about installing packages.
Source Distribution
File details
Details for the file trendet-0.7.tar.gz.
File metadata
- Download URL: trendet-0.7.tar.gz
- Upload date:
- Size: 10.8 kB
- Tags: Source
- Uploaded using Trusted Publishing? No
- Uploaded via: twine/3.1.1 pkginfo/1.5.0.1 requests/2.23.0 setuptools/46.0.0.post20200309 requests-toolbelt/0.9.1 tqdm/4.45.0 CPython/3.7.0
File hashes
| Algorithm | Hash digest | |
|---|---|---|
| SHA256 |
3df59eaa8fccefe013e50f325fde802679007bdb15568eb636270866dd86fbca
|
|
| MD5 |
a02126d768704e6ffb8cdd9aa1c97656
|
|
| BLAKE2b-256 |
ce7998275574358670ee8412b634562b5fa67a06ab205851a29307f1f9cacc66
|


