Library and command-line tool to list features lowering your evaluation score.

Project description
TruLens Hotspots
TruLens Hotspots is a tool for listing features in your evaluation data that correlate with worse results, according to your evaluation metric.
TruLens Hotspots:
- works with any evaluation metric, be they human scores, formula-based scores (F1, BLEU, ROUGE), learnable evaluation metrics (COMET) or LLM-as-a-judge scores
- is a totally black-box method, any model can be diagnosed
- all that is required is just a data frame with per-sample evaluation scores
- is easily pluggable into your Python code (at the end of the day, it's a function that takes a dataframe) or can be used as a stand-alone command-line tool
- can be run stand-alone or as a part of the whole TruLens framework
How to run
As a command-line tool
python -m trulens.hotspots file.csv \
   --score_column COLUMN_WITH_EVALUATION_SCORES \
   [--skip_columns OPTIONAL_SPACE_SEPARATED_LIST_COLUMNS_TO_BE_DISREGARDED] \
   [--more_skipped_columns OPTIONAL_SPACE_SEPARATED_LIST_COLUMNS_TO_BE_DISREGARDED]
Skipping columns
Some columns might correlate with the evaluation metric in a trivial manner, let's say your mean metric is F-score, but you also have columns for precision and recall, it does not make any sense to look at them for hotspots. The list of columns to be skipped is determined in the following manner:
- Some columns are skipped automatically using a simple heuristic (a regular expression for things like "score", "precision", "false negative", etc.)
- You can override them with the
--skip_columnsargument. - ... or you can add more with the
--more_skipped_columnsargument.
As a stand-alone library
from trulens.hotspots import hotspots_as_df, HotspotsConfig

# A Pandas data frame with per-item evaluation scores, the output of whatever evaluation process
# you're using
evaluation_results_df = ...

# The name of the column with the evaluation score
column_with_evaluation_scores = ...

# The names of the columns to be skipped (e.g. auxiliary evaluation scores)
columns_to_be_skipped = ...

hotspots_config=HotspotsConfig(
   score_column=column_with_evaluation_score,
   skip_columns=columns_to_be_skipped)


hotspots_df = hotspots_as_df(hotspots_config, evaluation_results_df)
# hotspots_df is a data frame with hotspots
As a part of the whole TruLens framework
from trulens.core.session import TruSession
from trulens.tru_hotspots import get_hotspots

session = TruSession()

# ... running the whole experiment

feedback_name = "Comprehensiveness" # one of the feedbacks
hotspots_df = get_hotspots(session, feedback="Comprehensiveness")
# hotspots_df is a data frame with hotspots
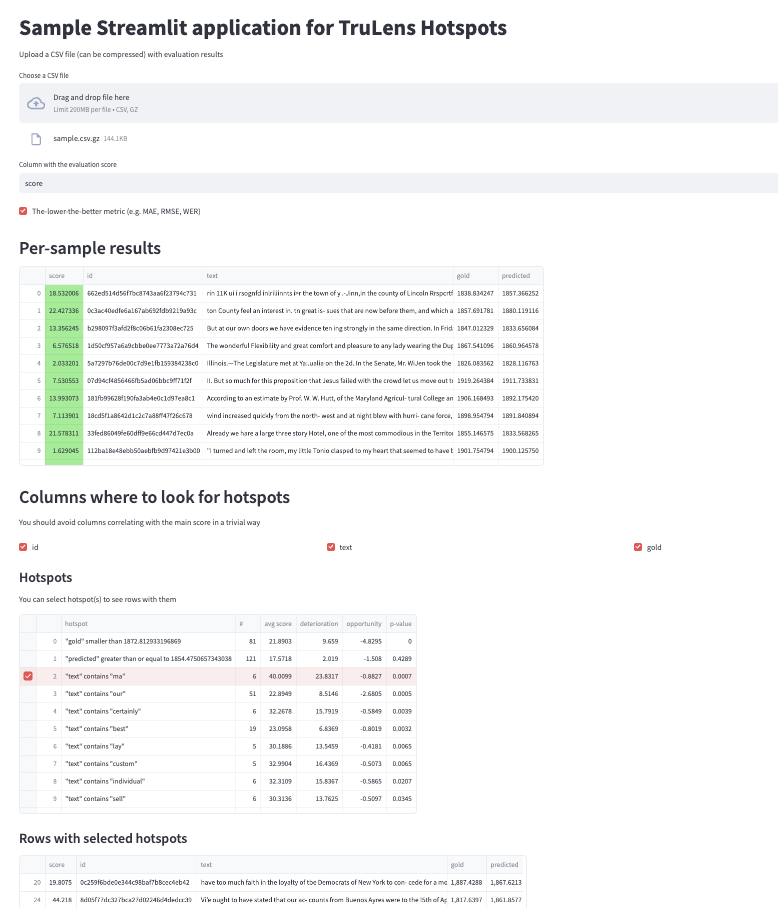
As a part of a stand-alone Streamlit app
It's easy to run TruLens Hotspots as a part of a Streamlit app, see trulens/streamlit.py for helper functions and an example. You can run it as follows:
pip install streamlit
python -m trulens.hotspots.hotspots_streamlit
Similarly, you can use TruLens Hotspots for a Streamlit-in-Snowflake app.
TruLens Hotspots output
TruLens Hotspots returns a table with the following columns:
- Feature - one of the following types:
FOO=bar- fieldFOOis equal tobarFOO:bar- fieldFOOcontains the wordbarlen(FOO)>=10- the length of fieldFOOis greater or equal to 10FOO<20- the value in fieldFOOis less than 20
- Number of occurrences - how many samples the feature occurred in
- Average score - average score for samples containing the feature (it will be significantly worse than the total score!)
- Deterioration - the delta between the average score for samples containing the feature (i.e. column 3) and the average score for the rest of samples (almost always negative)
- Opportunity - how much the average total score would improve if we had somehow fixed the problem with the feature (i.e. move it to the level of the average of negative examples)
- p-Value - assuming that the feature has no real effect on worsening scores, how likely is to get the such a distribution of scores (usually, a tiny value).
Example
Here's the output for a Hotspots run for some LLM evaluated on MMLU:
len(QUESTION)>=117              7027	0.60772753	-0.16549267	+0.08281705	0.00000000000000000000
QUESTION:1	                1711	0.46492572	-0.25676377	+0.03128634	0.00000000000000000000
DOC_ID:mathematics	        748	0.46494490	-0.23814388	+0.01268563	0.00000000000000000000
TAGS=["professional_law"]	1534	0.49343116	-0.22112893	+0.02415694	0.00000000000000000000
DOC_ID:physics	                488	0.56084207	-0.13422581	+0.00466473	0.00000000000000000000
CHOICES:2	                574	0.47180662	-0.22791301	+0.00931648	0.00000000000000000000
TARGET=Wrong, Not wrong	        217	0.32424306	-0.37190742	+0.00574732	0.00000000000000000000
TAGS=["virology"]	        166	0.52613443	-0.16623389	+0.00196516	0.00000000000060876997
CHOICES:0	                372	0.43726682	-0.26002489	+0.00688857	0.00000000000000000000
TAGS=["global_facts"]	        100	0.45071932	-0.24140297	+0.00171915	0.00000000000000904794
TAGS=["professional_accounting"]282	0.51067434	-0.18341221	+0.00368340	0.00000000000000000000
DOC_ID:chemistry	        303	0.56378787	-0.12940765	+0.00279237	0.00000000006836024711
TARGET=Wrong, Wrong	        213	0.37777224	-0.31744618	+0.00481527	0.00000000000000000000
CHOICES=["True, True", ...]	103	0.33951457	-0.35348142	+0.00259283	0.00000000000000000000
CHOICES:10	                317	0.45494130	-0.24090021	+0.00543835	0.00000000000000000000
TAGS=["formal_logic"]	        126	0.51026687	-0.18176729	+0.00163101	0.00000000000034218325
TARGET:only	                245	0.54455000	-0.14844314	+0.00258998	0.00000000000003856501
TAGS=["high_school_mathematics"]270	0.38323714	-0.31318800	+0.00602199	0.00000000000000000000
CHOICES:admissible	        111	0.40249648	-0.29020067	+0.00229399	0.00000000000000000000
QUESTION:Z	                48	0.35212494	-0.33943852	+0.00116031	0.00000000000110015792
As you can see, the hardest examples were the ones with long questions (with at least 117 characters), there were 7027 samples like this, their average score (0.6077) was worse than the average score for other questions (shorter than 117 characters), the difference is 0.1655, which is quite high. The last column indicates that it is virtually impossible to get it by chance. If we somehow fixed the issue with long questions (not saying it would be easy!), we would improve the score by 8 points, which would be huge for MMLU. The second most "troublesome" feature was having "1" in the QUESTION field, i.e. questions about numbers or containing an enumeration. The difference is even bigger (0.2568) than for long questions, but there are fewer of them, so the potential gain is big (3 points), but smaller than for longer questions.
Then follow the features basically representing the hardest domains: mathematics, law, physics (for mathematics and physics even when subtracting the bad effect of long questions and questions containing 1!). Law looks particularly interesting, making the model on par with other domains would improve the score by 2 points.
And there are more interesting observations: questions with numbers in possible answers (CHOICES), with the expected answer being Wrong, Not wrong or containing the word "only" (TARGET) or with letter "Z" pose a special difficulty to our model.
What's the use?
Basically, with TruLens Hotspots, you can easily find features of input, expected output, actual output and metadata that make your evaluation scores go down. You can then diagnose and attack the core issue: it might be a simple problem with pre/post-processing, or maybe you need more or better annotated training (or evaluation) data sets, or maybe you even need to change your model in a significant manner.
What is cool about TruLens Hotspots is that you don't have to pre-define categories of samples to consider ("I will list the average score for domains to check whether any of them got significantly worse score"), TruLens Hotspots will just look at all features and will list the most problematic things for you. In this way, you can find biases of the model you might not even be aware of (like your model being much worse for people from San Mateo than for people from San Jose).
Frequently Asked Questions
Q: So this is just yet another method for explainability, something like Shapley values?
A: No, this is not about how much each feature contributes to the generated output. TruLens Hotspots is about finding "troublemakers", features that make your evaluation scores worse in a systematic manner.
Q: Why are you using p-values? Weren't they discredited? Shouldn't you use the Bonferroni correction at least? A: We're using p-values just for sorting hotspots, there is no claim of statistical significance, we don't use any artificial significance level.
History
TruLens Hotspots is based on the ideas implemented in GEval. An important improvement is that TruLens Hotspots discards features highly correlating with already listed features.
Release history Release notifications | RSS feed


Download files
Download the file for your platform. If you're not sure which to choose, learn more about installing packages.
Source Distribution
Built Distribution
Filter files by name, interpreter, ABI, and platform.
If you're not sure about the file name format, learn more about wheel file names.
Copy a direct link to the current filters
File details
Details for the file trulens_hotspots-2.2.2.tar.gz.
File metadata
- Download URL: trulens_hotspots-2.2.2.tar.gz
- Upload date:
- Size: 16.2 kB
- Tags: Source
- Uploaded using Trusted Publishing? No
- Uploaded via: twine/5.1.1 CPython/3.11.11
File hashes
| Algorithm | Hash digest | |
|---|---|---|
| SHA256 |
f8231ce40e3600939fbe91afc7546f57d50a705e013f95a427aaebe224959d9e
|
|
| MD5 |
333dcc31d7b5d72b3eca604e13f558f2
|
|
| BLAKE2b-256 |
ada526b4b976969ddfaff7217a6db80ef590df96c344e18a98930a427db0bce3
|
File details
Details for the file trulens_hotspots-2.2.2-py3-none-any.whl.
File metadata
- Download URL: trulens_hotspots-2.2.2-py3-none-any.whl
- Upload date:
- Size: 14.2 kB
- Tags: Python 3
- Uploaded using Trusted Publishing? No
- Uploaded via: twine/5.1.1 CPython/3.11.11
File hashes
| Algorithm | Hash digest | |
|---|---|---|
| SHA256 |
ba7c1bda7323019d666b22783f0edde49c43141a5b27aa92c65af873c7df88c9
|
|
| MD5 |
f057fcace76b9885b453c1876ebe389e
|
|
| BLAKE2b-256 |
d3d2bf1e474a6e60c55c67993b5482f57663f065302efc2d13af932e72faeedc
|


