ThrottleStop logs parsers and visualizer.

Project description
tslogs 
A Python parser and visualizer for ThrottleStop logs.


🚩 Table of Contents
🗺️ Overview
tslogs is a Python library to parse, browse, export and visualize ThrottleStop log files.
📖 What is ThrottleStop ?
ThrottleStop is a small application designed to monitor for and correct the three main types of CPU throttling that are being used on many laptop computers.
Official Thread - here
Comprehensive Guide - here
Why would you like to parse ThrottleStop Logs ?
TODO
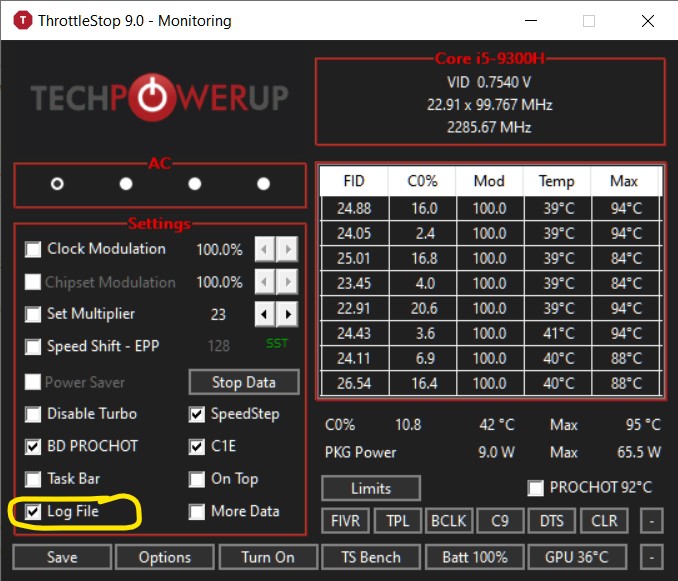
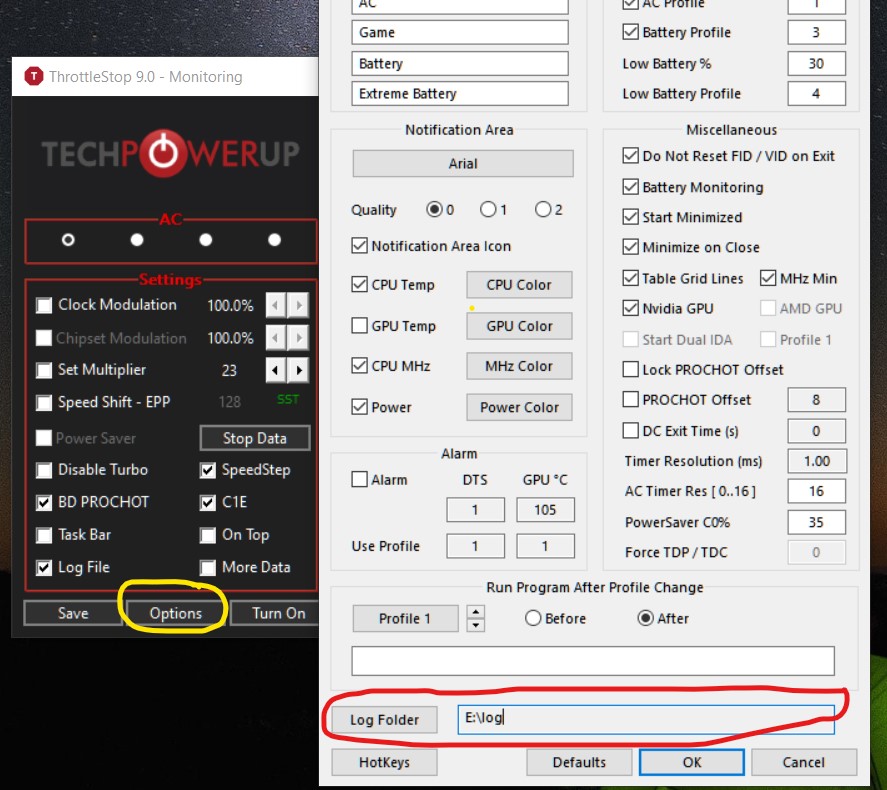
🏳️ Enable Logging in ThrottleStop
| Select the `Log File` checkbox | Click on `Options` button and Select the Folder where you want logs to be saved. |
|
|
🔧 Installing
Installing with pip is the easiest:
# pip install tslogs          # if you have the admin rights
$ pip install tslogs --user   # install it in a user-site directory
Finally, a development version can be installed from GitHub
using setuptools & pip
$ git clone https://github.com/ashutoshvarma/tslogs
$ cd tslogs
# pip install .
💡 Usage
1. tslogs - CLI tool
$ tslogs --help
usage: tslogs [-h] [--json | --plot ] [--dates START END] [--interval INTERVAL] [--smooth SMOOTH] [--output FILE] [--indent VALUE] [--quiet]
              [--version]
              paths paths

positional arguments:
  paths                 One or more paths to log dir or log files.

optional arguments:
  -h, --help            show this help message and exit
  --json, -j            dump all parsed log data.
  --plot, -p            Plot given the logs attributes (default: None). Allowed values are {multi, c0, clock_mod, chip_mod, battery_mw,
                        cpu_temp, gpu_mhz, gpu_temp, vid, power}
  --quiet, -q           Run in silent mode
  --version, -v         show program's version number and exit

Filter:
  --dates, -d START END
                        Datetime range to filter (in ISO format, yyyy-mm-dd HH:MM:SS)

Plot Options:
  --interval, -I INTERVAL
                        Plot data frequency in seconds (default: 60)
  --smooth, -S SMOOTH   Span interval for smoothing the graph, if data frequency is very high using increasing this with 'interval' can
                        yield smooth graph (default: 2)

Output:
  --output, -o FILE     Output file path, default is '-' (stdout)
  --indent VALUE        indent value for json output, default is 4
-
a.) Print the summary
-
b.) Plot Graphs
This will plot
cpu_temp,multi(clock speed in GHz),power(in W) andc0from logs between time 16:00 to 16:15 in2020-07-28.txttslogs .\tests\logs\2020-07-28.txt -p cpu_temp multi power --smooth 2 --interval 1 -d "2020-07-28 16:00:00" "2020-07-28 16:15:00"


2. tslogs - Python Module
TODO
See parse_logs() and LogLine in parse.py. For more references
see the CLI implementation in cli.py
📜 License
This library is provided under the open-source MIT license.
Release history Release notifications | RSS feed

Download files
Download the file for your platform. If you're not sure which to choose, learn more about installing packages.
Source Distribution
Built Distribution
Filter files by name, interpreter, ABI, and platform.
If you're not sure about the file name format, learn more about wheel file names.
Copy a direct link to the current filters
File details
Details for the file tslogs-0.1.0.zip.
File metadata
- Download URL: tslogs-0.1.0.zip
- Upload date:
- Size: 424.5 kB
- Tags: Source
- Uploaded using Trusted Publishing? No
- Uploaded via: twine/3.3.0 pkginfo/1.6.1 requests/2.25.1 setuptools/41.2.0 requests-toolbelt/0.9.1 tqdm/4.55.0 CPython/3.8.3
File hashes
| Algorithm | Hash digest | |
|---|---|---|
| SHA256 |
d4788cbc720429bf1759b6ed9892eca44f0db0db4bfce9451f55b8a91e387378
|
|
| MD5 |
df8674b704ed7592dfd96758f6c8f617
|
|
| BLAKE2b-256 |
3f96b2b4b65932b0cae6b158caebb173febf58e26d9aabb1f18c36ac66e1c8fd
|
File details
Details for the file tslogs-0.1.0-py2.py3-none-any.whl.
File metadata
- Download URL: tslogs-0.1.0-py2.py3-none-any.whl
- Upload date:
- Size: 14.0 kB
- Tags: Python 2, Python 3
- Uploaded using Trusted Publishing? No
- Uploaded via: twine/3.3.0 pkginfo/1.6.1 requests/2.25.1 setuptools/41.2.0 requests-toolbelt/0.9.1 tqdm/4.55.0 CPython/3.8.3
File hashes
| Algorithm | Hash digest | |
|---|---|---|
| SHA256 |
5de3d739cdc691d5404453d2cf18839765c032566b3392b034ceb1bbdd6ce890
|
|
| MD5 |
9a665f587f92e7d2a33f8f709d81bee0
|
|
| BLAKE2b-256 |
79f5da3dd78a97ca36b4ca37fd4cdb05eebcae41aa8b0d0a130819f4ba8da17f
|


