Scientific plotting made easy.

Project description

TUEplots: Extend matplotlib for scientific publications


Why?
tueplots helps you to create scientific plots that can be used in papers, presentations, posters, or other publications.
tueplots does not try to make your plots as beautiful as possible (who are we to judge your favourite color).
Instead, it makes it effortless to avoid common issues like too-small figures, inappropriate fontsizes, or inconsistencies among figures.
Because good-looking figures are important.
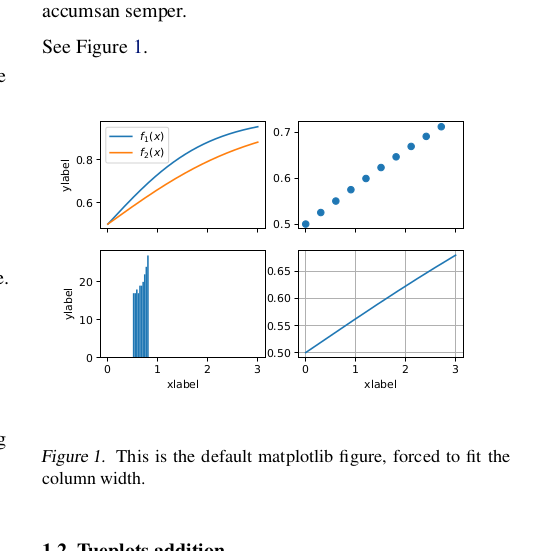
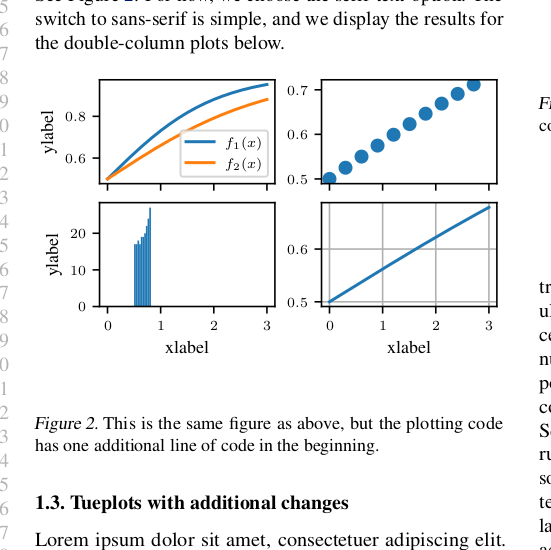
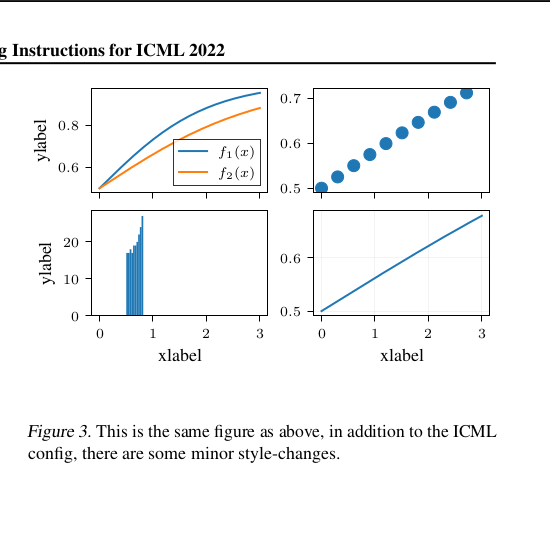
For example, consider the style tailored to the ICML2022 template. (Left: default matplotlib, middle: one line of tueplots-code, right: two lines of tueplots-code)
Principles
tueplots has no internal state:
It only passes around dictionaries, whose key-value pairs match those that matplotlib uses.
Instead of updating global state, it makes it easy for you to do it yourself!
If you want to globally change settings, pass them to matplotlib.pyplot.rcParams.update().
If you only need them for specific contexts, pass them to matpltlib.pyplot.rc_context().
tueplots makes the change easy, so you can make the easy change. This should make tueplots naturally compatible with other matplotlib extensions.
Usage examples are given below.
tueplots has no opinions:
It does not tell you what your figures should look like in the end, but helps you to tailor your plots to your own needs.
We like all the colors, frame-styles, markers, or linewidths.
But we do think that figure sizes should match the text-width in your publication,
and that the font-size in the plot should be readable, and similar to the rest of the paper/presentation/....
Getting started
Installing tueplots is explained here.
Some usage examples are given at this url.
A more specific tutorial, applying tueplots to figures intended for ICML 2022, is on this page.
If something is not working as promised, please refer to the troubleshooting site.
For more advanced tutorials, you may refer to the example notebooks.
Related packages
There are similar packages to tueplots (with different foci, respectively):
- Seaborn: https://seaborn.pydata.org/index.html
- ProPlot: https://proplot.readthedocs.io/en/latest/cycles.html
- SciencePlots: https://github.com/garrettj403/SciencePlots
- MatplotX: https://github.com/nschloe/matplotx
- Themepy: https://github.com/petermckeeverPerform/themepy
The matplotlib third-party plots contains a more comprehensive list. If you know of any others, please feel invited to open an issue/PR.
Miscellaneous
tueplotshas been started at the University of Tübingen (hence the name).
Release history Release notifications | RSS feed


Download files
Download the file for your platform. If you're not sure which to choose, learn more about installing packages.
Source Distributions
Built Distribution
Filter files by name, interpreter, ABI, and platform.
If you're not sure about the file name format, learn more about wheel file names.
Copy a direct link to the current filters
File details
Details for the file tueplots-0.2.4-py3-none-any.whl.
File metadata
- Download URL: tueplots-0.2.4-py3-none-any.whl
- Upload date:
- Size: 18.0 kB
- Tags: Python 3
- Uploaded using Trusted Publishing? No
- Uploaded via: twine/6.2.0 CPython/3.14.3
File hashes
| Algorithm | Hash digest | |
|---|---|---|
| SHA256 |
aafe4ff0727ab127f2665488d070fd2df3fb3dff876c8cf3cfe6091d144744aa
|
|
| MD5 |
99ce7edebc20d331db7deb51ceebc370
|
|
| BLAKE2b-256 |
b65bdc9e79200e7e5b4795a242b777729ccf8687be9025c14bca403a6182e2c2
|


