A PySide6-based desktop application for analyzing tumor volume data

Project description
Tumor Volumetrics


Tumor Volumetrics is a Python application for exploring, summarizing, and visualizing preclinical tumor volume time-series data. It is designed to make it easy to generate standard tumor volume figures to support interactive review of results and generation of publication-quality figures.
Figure 1.
Study viewer with effective treatment example shown.
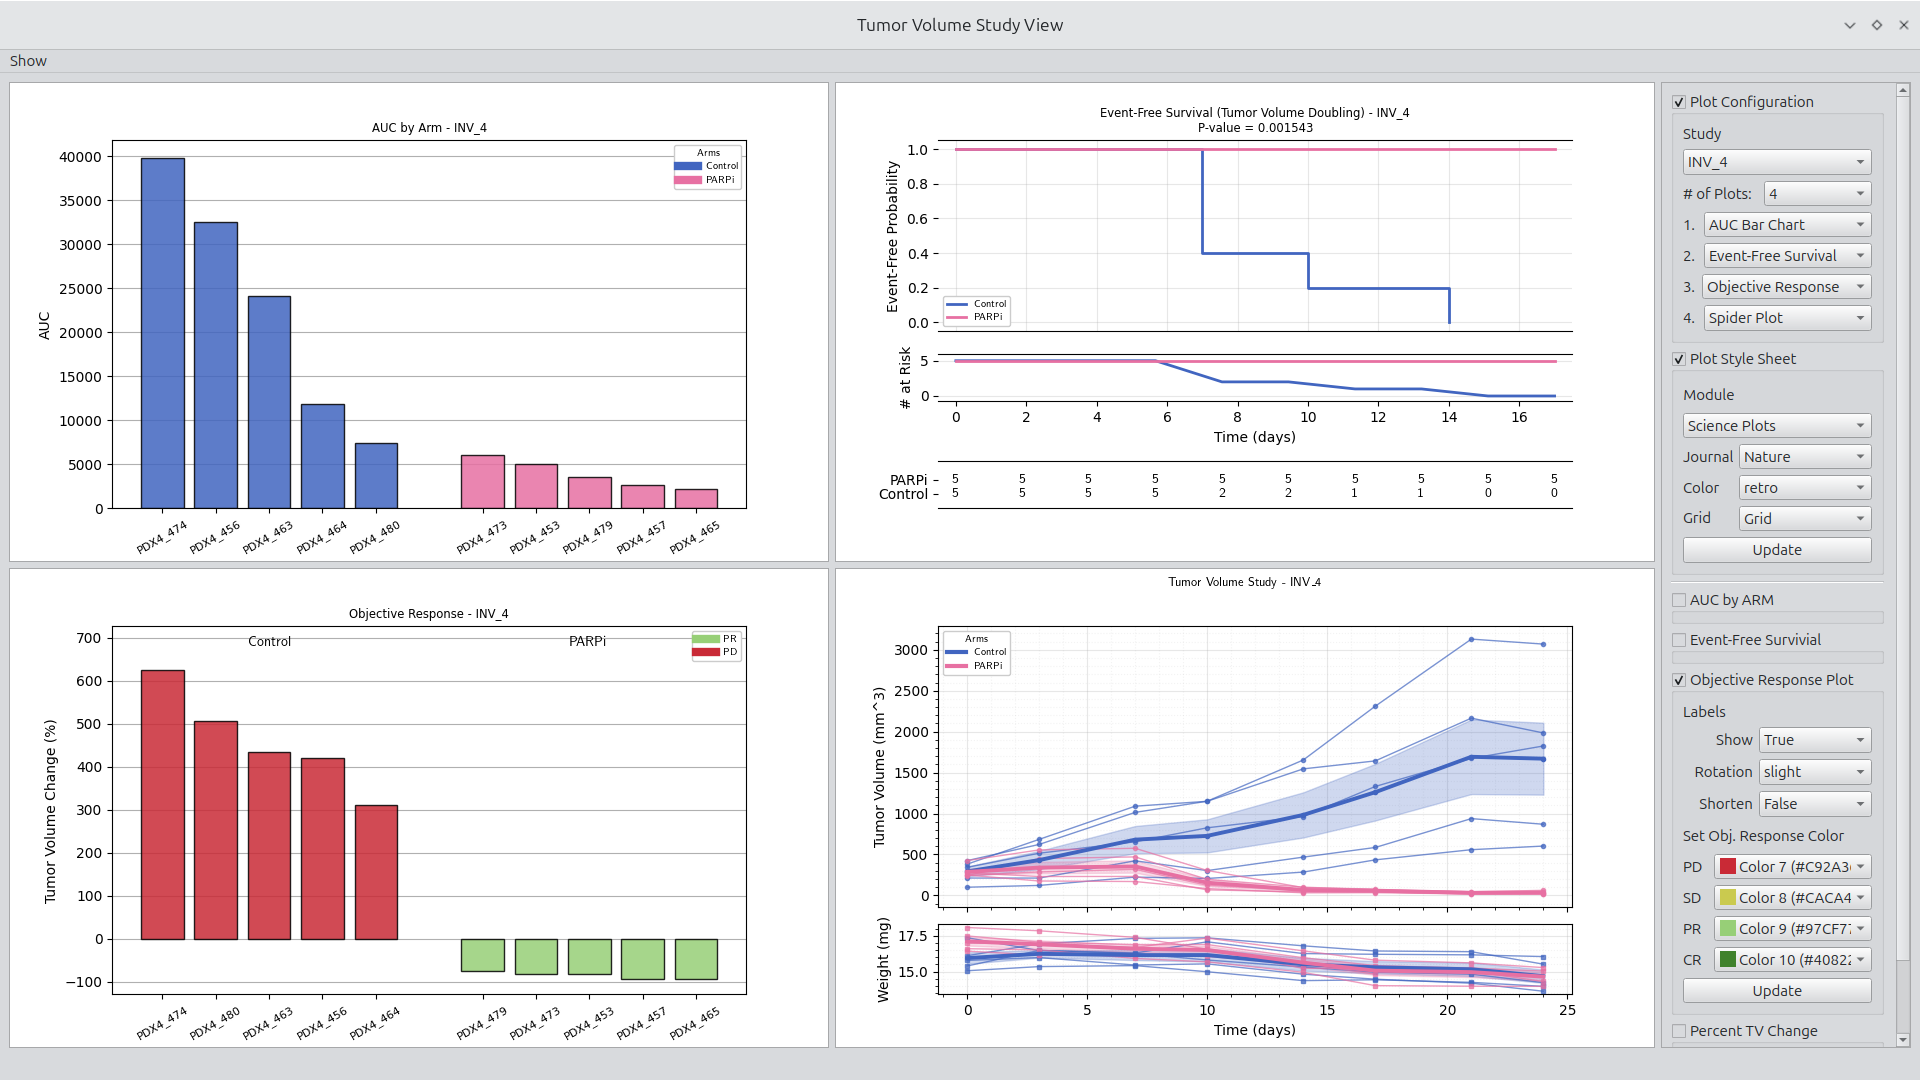
Launching a viewer such as the volume study viewer requires only one click, resulting in the display of common tumor volume plots. The viewer can be configured between 1 and 4 figures. In addition, each figure includes a set of parameters made available through a group box. Configuration and parameter options are made available through the Show menu in the upper left corner. See Figure 1 for an example of a typical study view display.
What This Tool Is For
Tumor Volumetrics is built for scientists and analysts who:
- Work with longitudinal tumor volume data in CSV form
- Need to rapidly explore common experiment and study plots
- Generate publication-quality plots
Plot Style
Set plot to use Matplotlib or Science Plot styles.
Figure 1.
Setting plot style to Matplotlib default style.
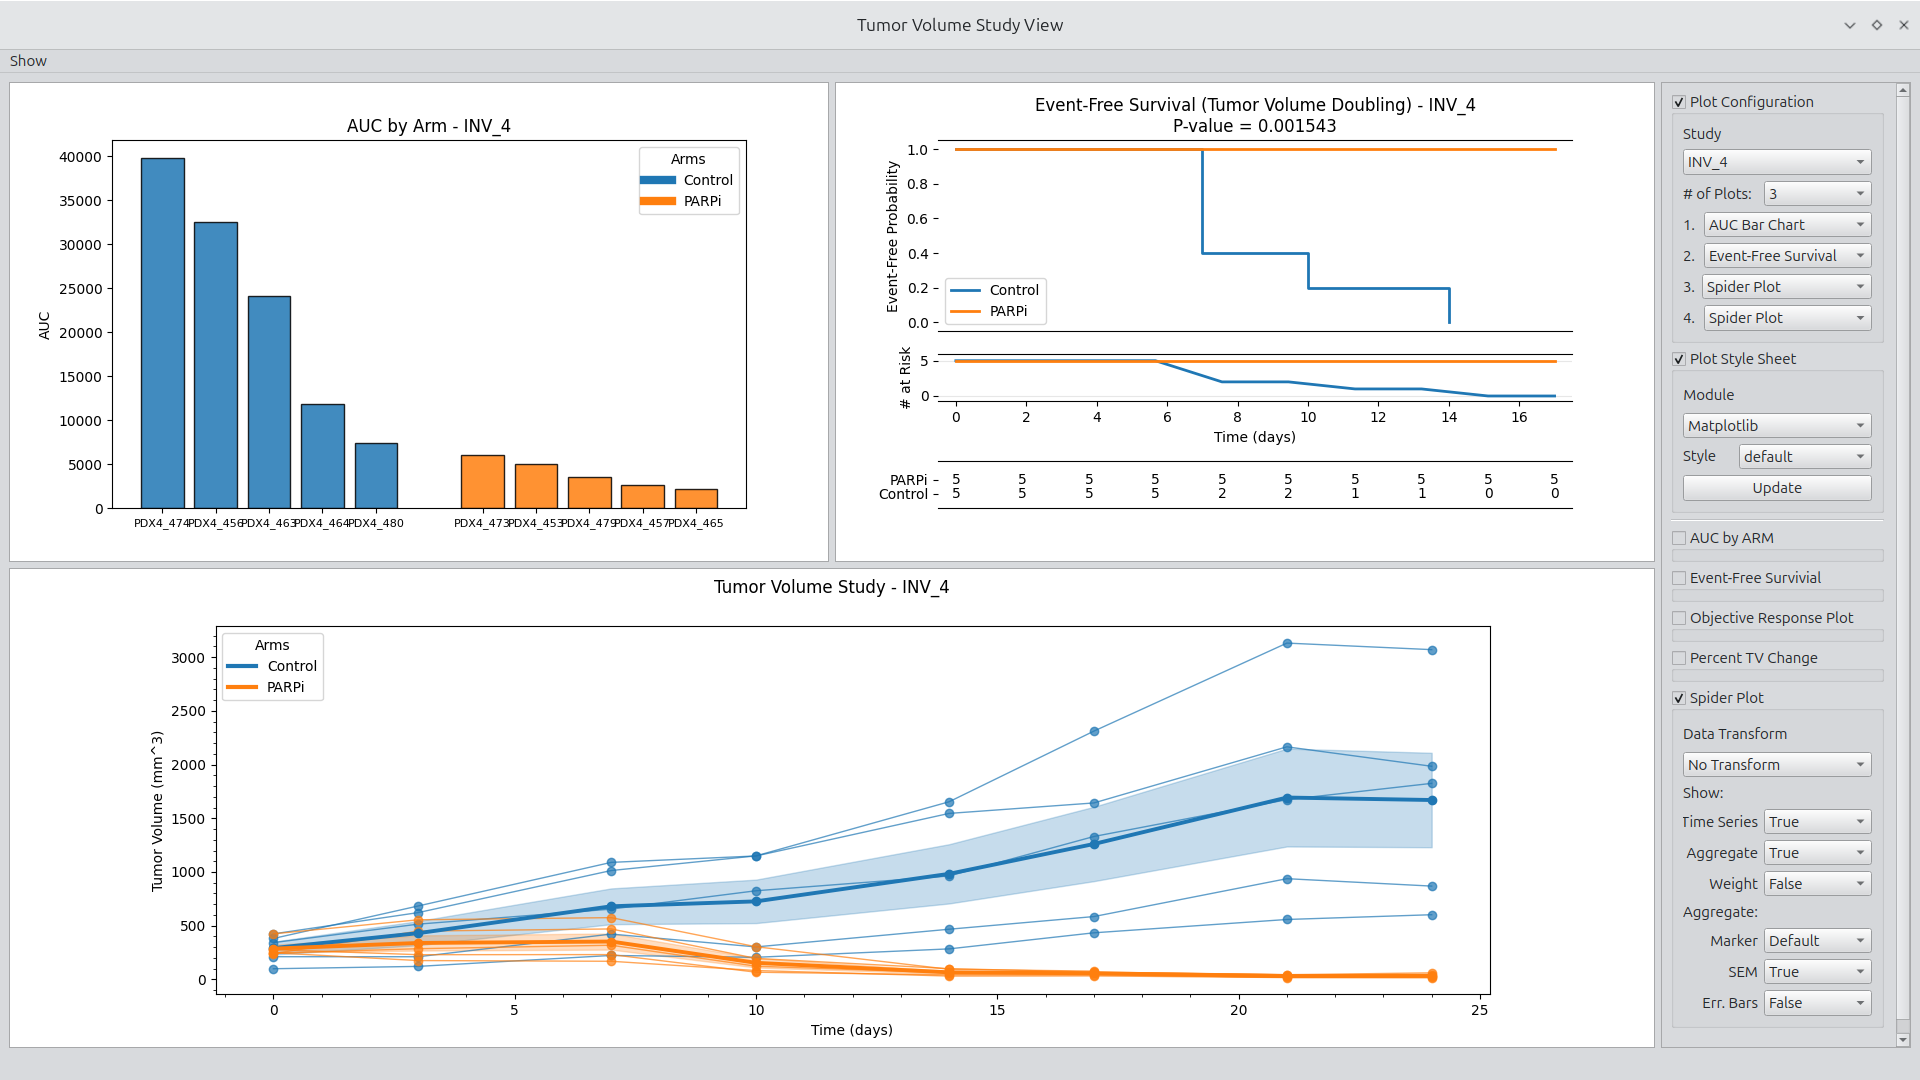
Figure Generation
Users can select a Matplotlib or Science Plot style to update the displayed figures. Objective Response Plots include a feature of smart generation of colors complementary to the selected style.
Right-clicking any figure launches a dialog box for configuring plots including plot width, plot height, and figure DPI. The figure can then either be saved to disk or copied to the clipboard. See Figure 2 for an example.
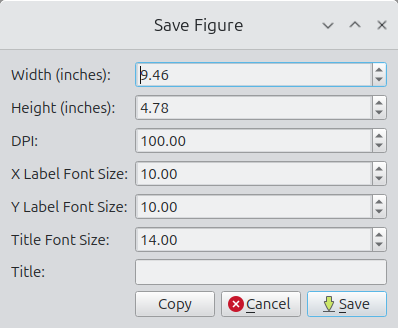
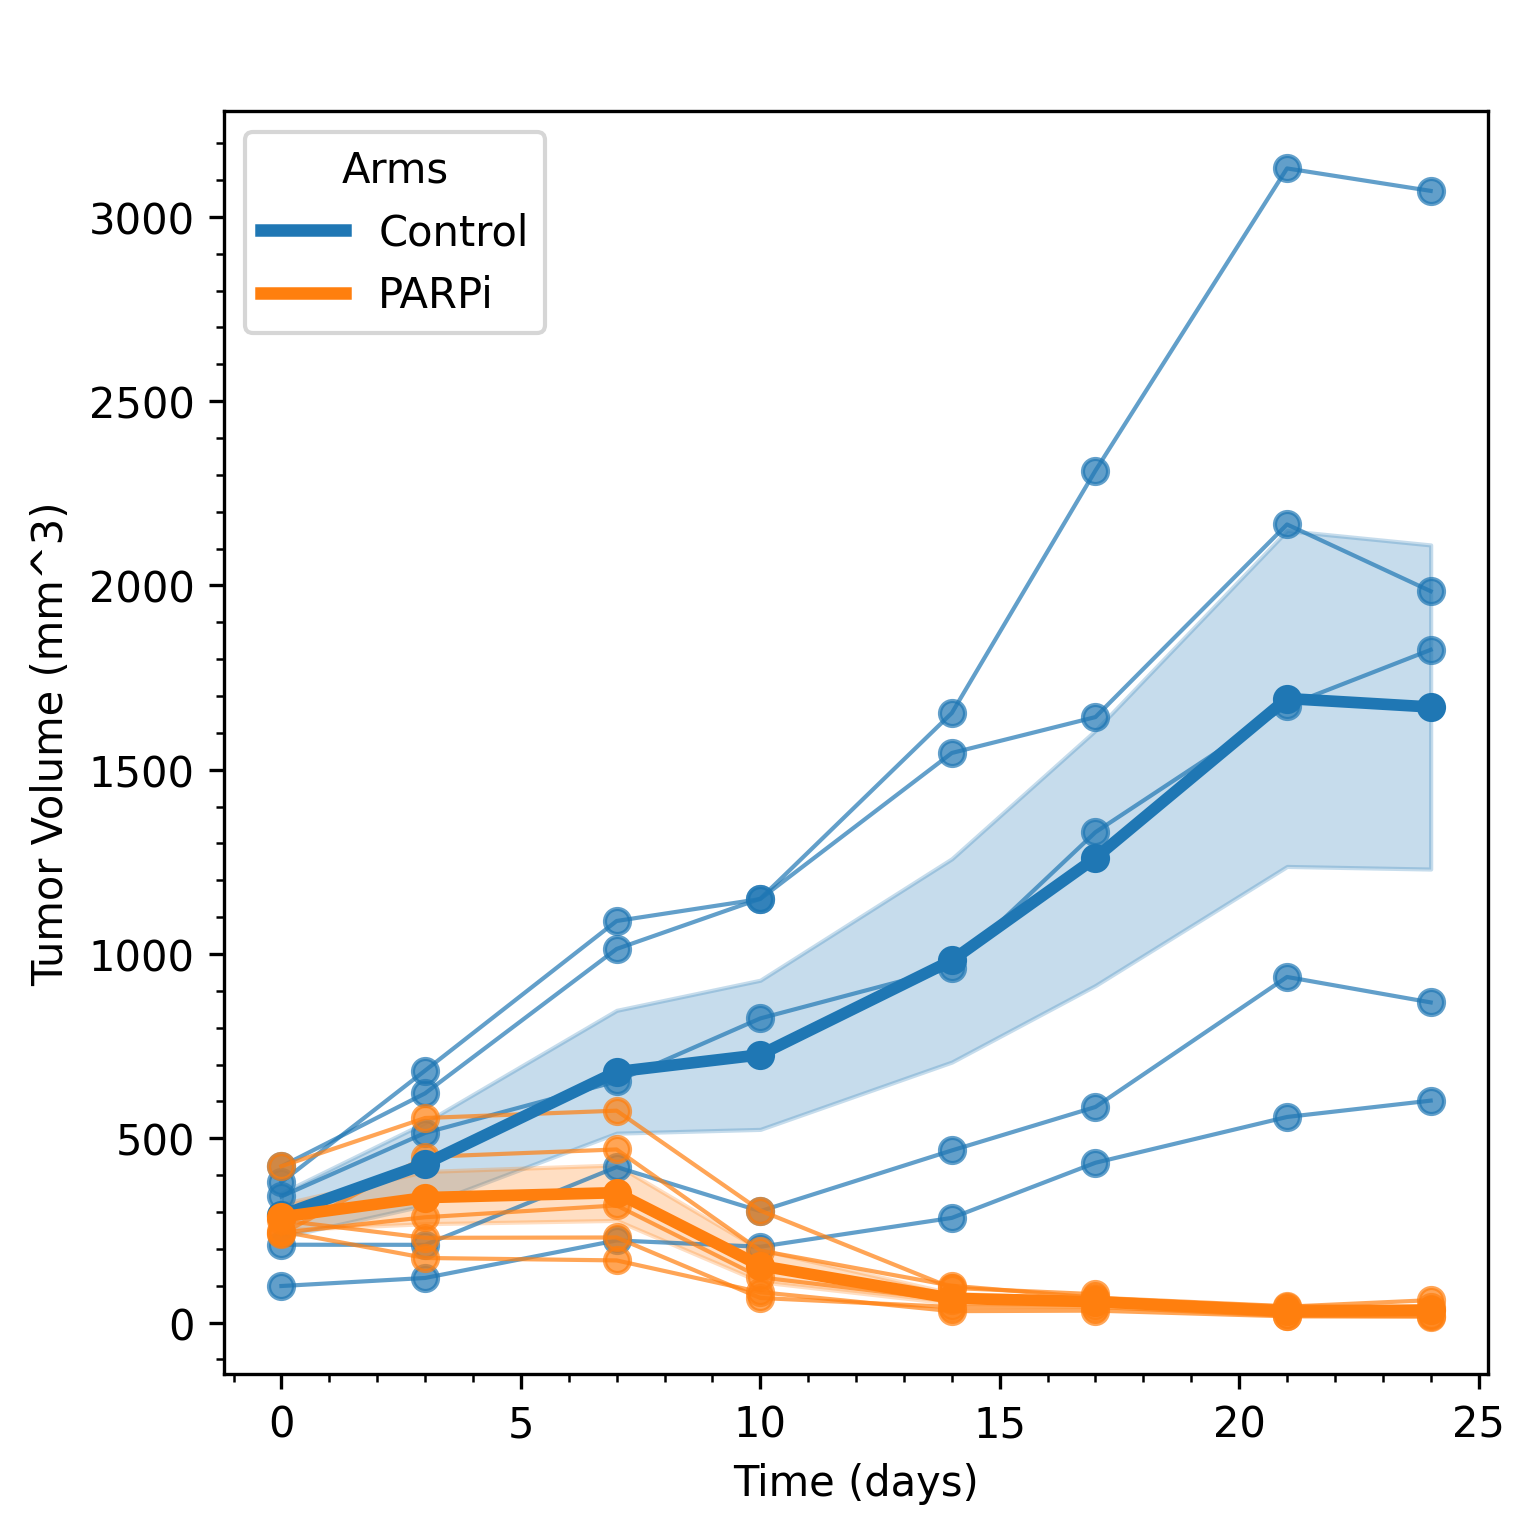
Figure 2. Example of setting plot parameters (top) and generating a square plot (bottom).
Getting Started
Test file
- Download the test file: synthetic_tumor_data.csv
Linux Distribution
- Download the app image from the release section
- Make the app image executable
- Double click on the app image
Main User Interfaces
TumorVolumetrics includes interfaces for loading data files, visualizing experiment data, and visualizing study data. Interfaces are minimal by design, allowing the user to focus on data review.
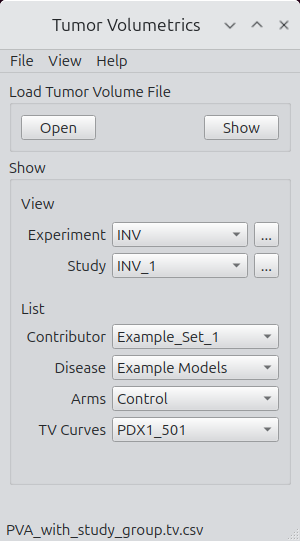
File Loading and Grouping
The file-loading panel supports basic access, inspection, and export.
Key actions:
- Open
Select and load a tumor volume CSV following standard conventions. - Show
Display the entire CSV in a table widget. Sorting, copying, and basic inspection are supported. Additional validation tools are planned. - Experiment Viewer
Clicking on the ellipses next to the experiment list launches the experiment viewer. - Study Viewer
Clicking on the ellipses next to the study list launches the study viewer. - Lists
Contributor, disease, arms, and tumor volume curve lists are populated upon loading.
Figure 3.
Main interface for file access and navigation.
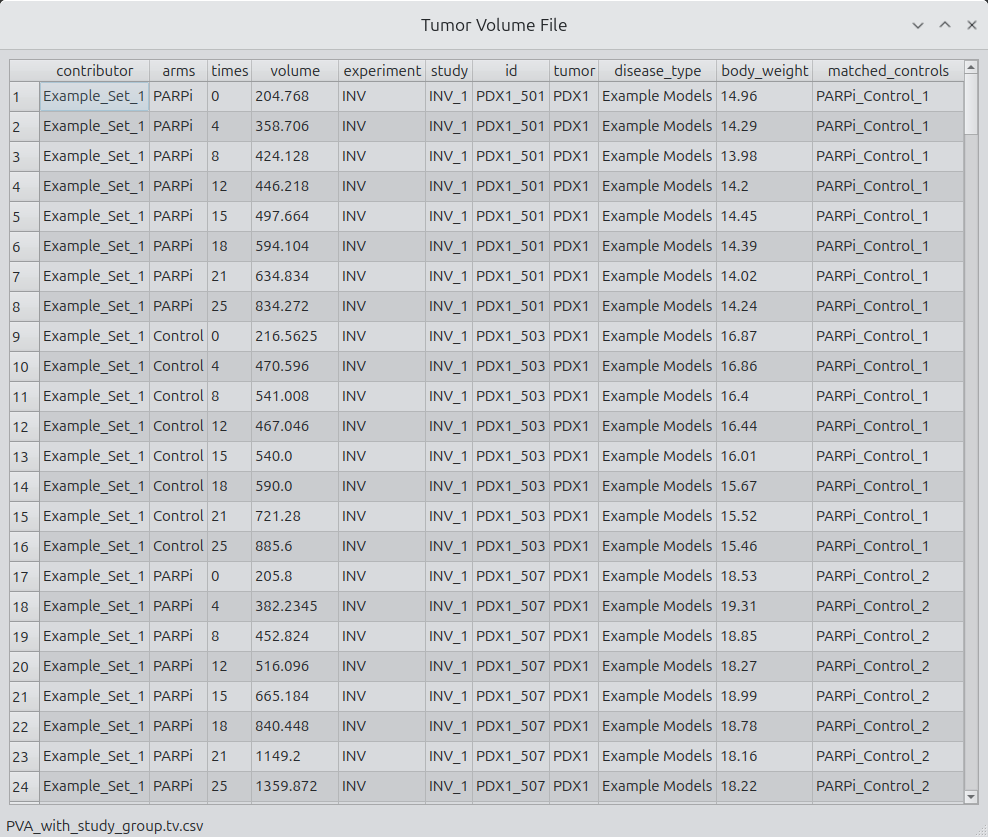
Show
Clicking on the show pushbutton launches a CSV viewer with the selected data file contents shown.
Figure 4.
File selection and inspection interface.
Tumor Volume Experiment Viewer
The Experiment Viewer is optimized for cross-study and cross-arm exploration within an experiment. It allows you to quickly configure and generate standard tumor volume plots with minimal setup.
Figure 5.
Tumor Volume Experiment Viewer.
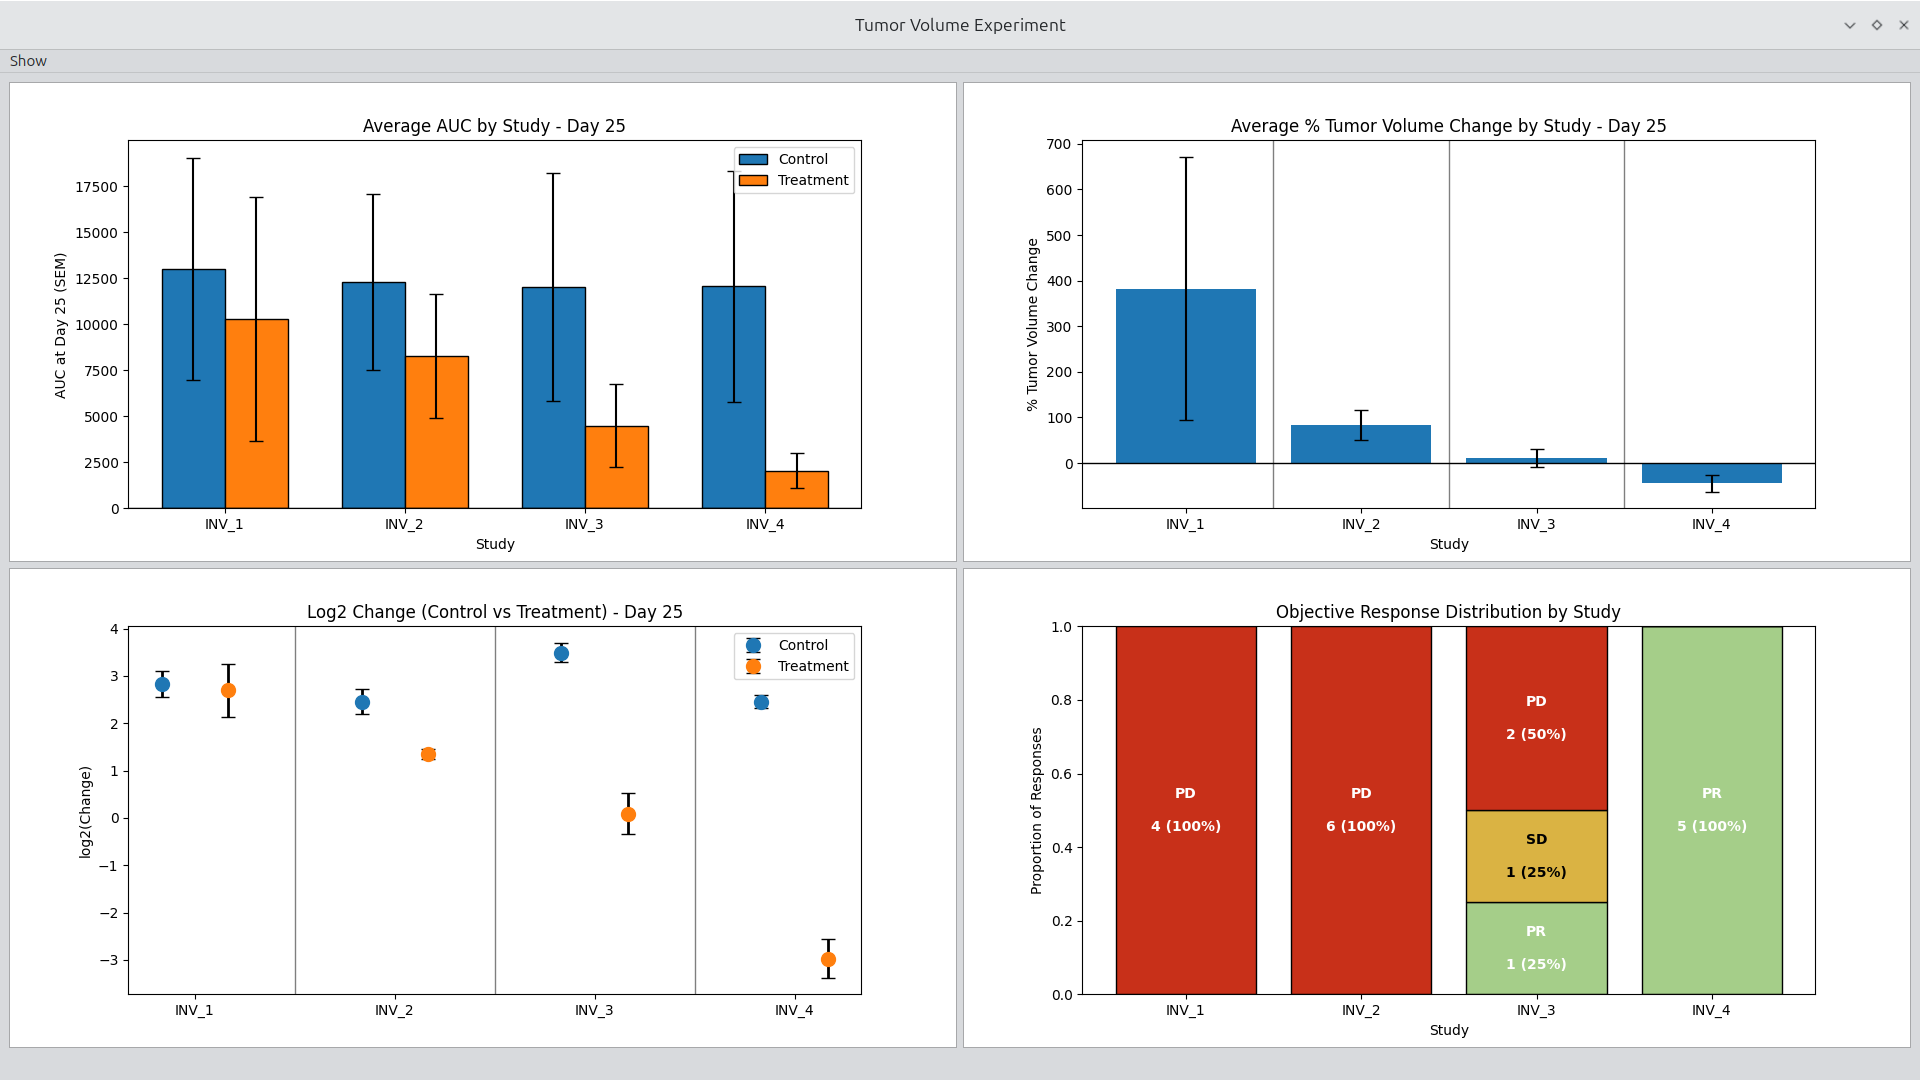
Key capabilities:
- Select experiment, study, and arm combinations
- Generate spider plots, averages, and other standard views
- Adjust plotting options interactively
- Rapidly iterate on figure configuration without code changes
Tumor Volume Study Viewer
The Study Viewer focuses on deep inspection of a single study. It supports arm-level and subject-level exploration and is optimized for understanding response patterns and variability.
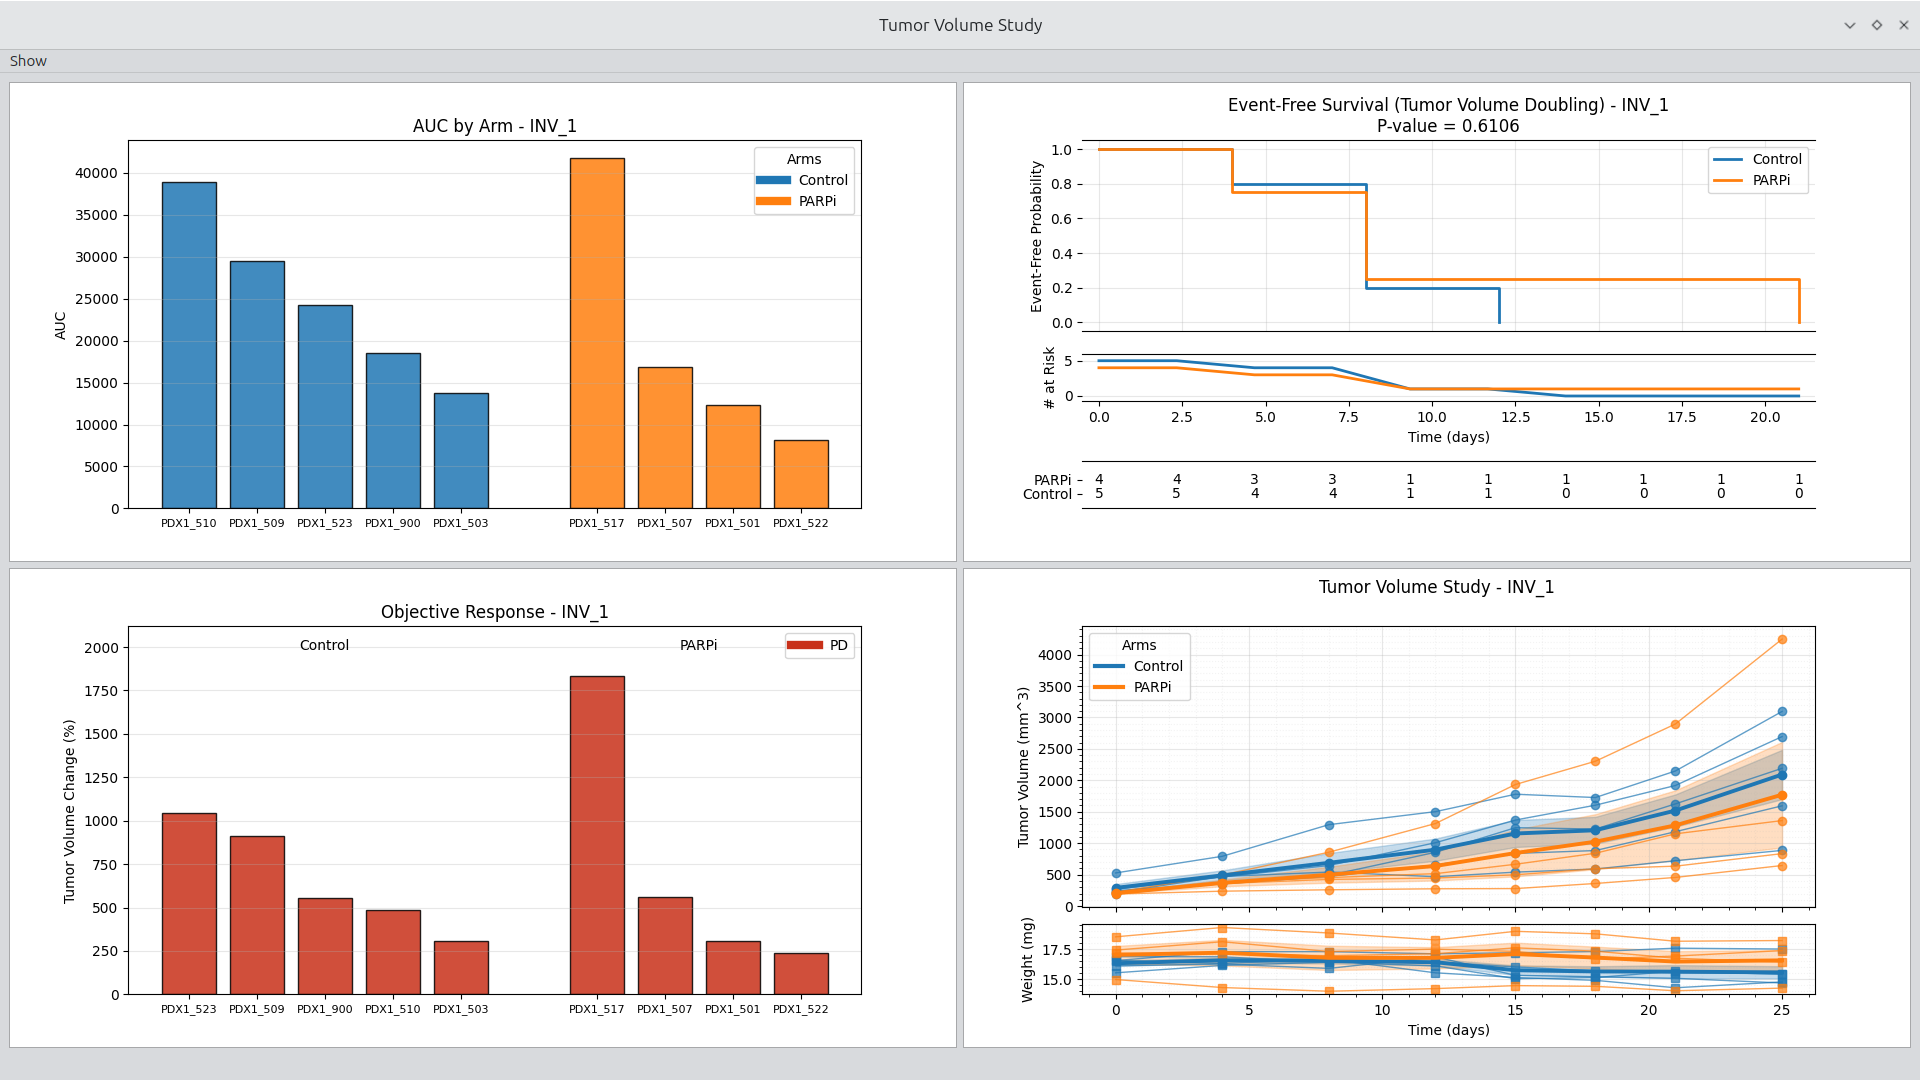
Key capabilities:
- Explore arms and individual time series
- Generate standard study-level plots
- Configure display and grouping options interactively
- Support common review patterns used in study evaluation
Input File Description
The input file is a tab-delimited dataset containing tumor volume measurements across multiple experiments and treatment arms. Each row corresponds to a single measurement for a specific tumor model at a given time point. The file is structured with the following columns:
| Column | Description |
|---|---|
Contributor |
Name or ID of the dataset contributor. Groups related samples or experiments. |
Arms |
Experimental group assignment, e.g., PARPi (treatment) or Control. |
Times |
Time point of measurement in days. |
Volume |
Tumor volume at the given time point, measured in mm³ (or dataset-specific units). |
Experiment |
Experiment identifier for tracking multiple experiments. |
Study |
Study ID for grouping related experiments. |
ID |
Unique identifier for each tumor sample or PDX (patient-derived xenograft) model. |
Tumor |
Tumor model name. |
Disease_Type |
Description or classification of the tumor type. |
Body_Weight |
Body weight of the animal at the measurement time, in grams. |
Matched Controls |
Identifier for matched control samples corresponding to the treatment arm. |
Example Rows
| Contributor | Arms | Times | Volume | Experiment | Study | ID | Tumor | Disease_Type | Body_Weight | Matched Controls |
|---|---|---|---|---|---|---|---|---|---|---|
| Example_Set_1 | PARPi | 0 | 204.768 | INV | INV_1 | PDX1_501 | PDX1 | Example Models | 14.96 | PARPi_Control_1 |
| Example_Set_1 | PARPi | 4 | 358.706 | INV | INV_1 | PDX1_501 | PDX1 | Example Models | 14.29 | PARPi_Control_1 |
| Example_Set_1 | Control | 0 | 216.5625 | INV | INV_1 | PDX1_503 | PDX1 | Example Models | 16.87 | PARPi_Control_1 |
| Example_Set_1 | Control | 4 | 470.596 | INV | INV_1 | PDX1_503 | PDX1 | Example Models | 16.86 | PARPi_Control_1 |
Notes
- The file must be tab-delimited (
\t). - Time points (
Times) should be numeric and consistently spaced within each experiment for proper analysis. - Each treatment arm should have matched controls to allow paired comparisons.
- Column headers must match exactly for automated parsing scripts to work.
- Matched Controls is included as an experiment. The column is not used in the application.
- Email the author, see below, to request a test file.
Design Philosophy
Tumor Volumetrics is built around a few core ideas:
- User first
The viewers and workflows interface drive the design. - Standard plots should be easy
Common oncology figures should not require custom scripts every time. - Extensible, not rigid
New plot types and lab-specific conventions should be easy to add. - Scripting supportive classes Advance users can use classes to conduct analysis.
Roadmap
The long-term goal is a comprehensive PySide6 application that supports:
- Extended XML data format for including metadata with tumor volume data
- Extension points for advanced or lab-specific methods
- Standard preclinical oncology analyses
- Support for user-defined plot configuration
Authors
Dennis A. Dean, II, PhD dennis.a.dean@gmail.com
Version
v0.1
- First functional release
- TumorVolumetricApp (compiled on Ubuntu with PyInstaller)
- TumorVolumetricsApp-x85_64.AppImage
License
This project is licensed under the GNU Affero General Public License v3.0.
See the LICENSE.md file for details.
Acknowledgements
The structure of the Python code benefited from the experience and contributions of the PDXNet community. Discussions during the process of writing the following publications were highly influential in shaping the code written for this application:
- Systematic Establishment of Robustness and Standards in Patient-Derived Xenograft Experiments and Analysis, Cancer Res (2020) 80 (11): 2286–2297
- PDXNet portal: patient-derived Xenograft model, data, workflow and tool discovery, NAR Cancer, Volume 4, Issue 2, June 2022
- Assessment of Patient-Derived Xenograft Growth and Antitumor Activity: The NCI PDXNet Consensus, Mol Cancer Ther (2024) 23 (7): 924–938
We gratefully acknowledge all members of the PDXNet community for their valuable feedback, discussions, and insights that informed both the design and implementation of this application.
Release history Release notifications | RSS feed

Download files
Download the file for your platform. If you're not sure which to choose, learn more about installing packages.
Source Distribution
Built Distribution
Filter files by name, interpreter, ABI, and platform.
If you're not sure about the file name format, learn more about wheel file names.
Copy a direct link to the current filters
File details
Details for the file tumorvolumetrics-0.1.0.tar.gz.
File metadata
- Download URL: tumorvolumetrics-0.1.0.tar.gz
- Upload date:
- Size: 93.8 kB
- Tags: Source
- Uploaded using Trusted Publishing? No
- Uploaded via: twine/6.2.0 CPython/3.12.3
File hashes
| Algorithm | Hash digest | |
|---|---|---|
| SHA256 |
032f75c75dd0b4067d79f6cab0d3a8bcf0b5785c03e538da06834b34b77c24a6
|
|
| MD5 |
5244e74476dfa82c5e6168d12f297682
|
|
| BLAKE2b-256 |
855681ff6e6e3d0154643462f534ba3e9da8185d0f431747a486e2c76619cf04
|
File details
Details for the file tumorvolumetrics-0.1.0-py3-none-any.whl.
File metadata
- Download URL: tumorvolumetrics-0.1.0-py3-none-any.whl
- Upload date:
- Size: 94.4 kB
- Tags: Python 3
- Uploaded using Trusted Publishing? No
- Uploaded via: twine/6.2.0 CPython/3.12.3
File hashes
| Algorithm | Hash digest | |
|---|---|---|
| SHA256 |
6dc38c7c6db5a4344c8af5120b3249738aac296b6fd216431173b8b0a3b0fd72
|
|
| MD5 |
10707edcb8f7d1eb54240958c99ec4fe
|
|
| BLAKE2b-256 |
bd6843237a851b4786f3183776b986e88ff1530b251fb7012d8d71ecda67583f
|


