

TunnelScope
Evidence-based MTU and packet-size diagnostics for Linux networks.
Status: v0.4.0 alpha. IPv4/IPv6 UDP delivery probes, Linux no-fragment mode, per-direction report combination, optional receiver observations and controlled MTU labs are available. Automatic path-MTU discovery and root-cause diagnosis are not implemented.
Quick start
Requires Python 3.10 or newer. In an empty working directory on Linux (or WSL2), install the published package in a virtual environment:
python3 -m venv .venv
source .venv/bin/activate
python -m pip install tunnelscope
tunnelscope --help
Open a second terminal and activate the same environment there with
source .venv/bin/activate. Run these commands in order on one machine; no
root access or network setup is needed for this loopback example.
Terminal 1 (receiver):
tunnelscope receive --max-packets 2 --output receiver.json
Wait for Listening on 127.0.0.1:9471, then run Terminal 2 (sender):
tunnelscope probe 127.0.0.1 --sizes 64,1200 --count 1 --output probe.json
The receiver exits after the two probes and saves receiver.json. Back in
either terminal, inspect the sender report and create a local HTML view:
tunnelscope show probe.json
tunnelscope html probe.json --output probe.html
Open probe.html in a browser. The receiver sends small acknowledgements, so
this example checks delivery in one direction only. A timeout is inconclusive;
it does not prove an MTU problem. For two machines, see the
two-endpoint workflow.
The problem
A connection can appear healthy while larger transfers fail. Small probes may succeed even when larger packets cannot traverse the path. Tunnel overhead, MTU configuration and blocked Path MTU Discovery feedback can contribute to this behavior. Other causes can produce similar symptoms.
TunnelScope aims to help network engineers, system administrators and learners investigate these failures through repeatable measurements and inspectable evidence.
Planned first version
- A Python command-line tool and a cooperating receiver for controlled Linux environments.
- Repeated, size-controlled IPv4 UDP probes with fragmentation disabled.
- Separate measurements for each direction, with timeouts and loss recorded explicitly.
- JSON reports containing probe sizes, outcomes, relevant interface information and test settings.
- A reproducible Linux lab demonstrating healthy delivery, explicit packet-too-large feedback and a possible PMTU black hole.
A failed probe alone will not be labeled as proof of an MTU problem. Reports separate observations, hypotheses and missing evidence. An observed working packet size is not presented as the exact path MTU.
Milestones
- M0 - Reproduce the problem: build a small Linux network-namespace lab and record a healthy baseline and a controlled MTU failure.
- M1 - Probe and receive: implement bounded, identifiable probes and acknowledgements between two endpoints.
- M2 - Explain the evidence: export JSON and distinguish successful delivery, explicit errors and inconclusive timeouts.
- M3 - Validate: check the tool against known lab configurations, document limitations and publish a short demo.
- M4 - Observe at the receiver: record which identified probes reached the cooperating receiver and correlate them with sender outcomes.
- M5 - Make evidence usable: validate receiver-observed timeouts in a controlled lab and provide a concise terminal view of reports.
The tunnel and pod workflows include a validated local VXLAN overlay and guidance for existing VPNs and Kubernetes pods. The VPN and pod workflows have not yet been validated on a real deployment. 5G user-plane tunnels remain outside the current scope.
For a quick walkthrough of both controlled failure modes, see the two-minute Linux demo. The two-VM validation record documents a successful bidirectional DF run between Ubuntu and Debian guests. The v0.1 scope lists what the installable prototype does and does not cover. The v0.2 receiver workflow explains how to capture and correlate receiver evidence. The two-VM correlation record documents the new workflow on independent Linux guests. The blocked ACK return lab validates a receiver-observed sender timeout.
Use tunnelscope show report.json for a short terminal table of a probe,
receiver observation, bidirectional comparison, correlation, or lab report.
JSON remains the machine-readable source of evidence.
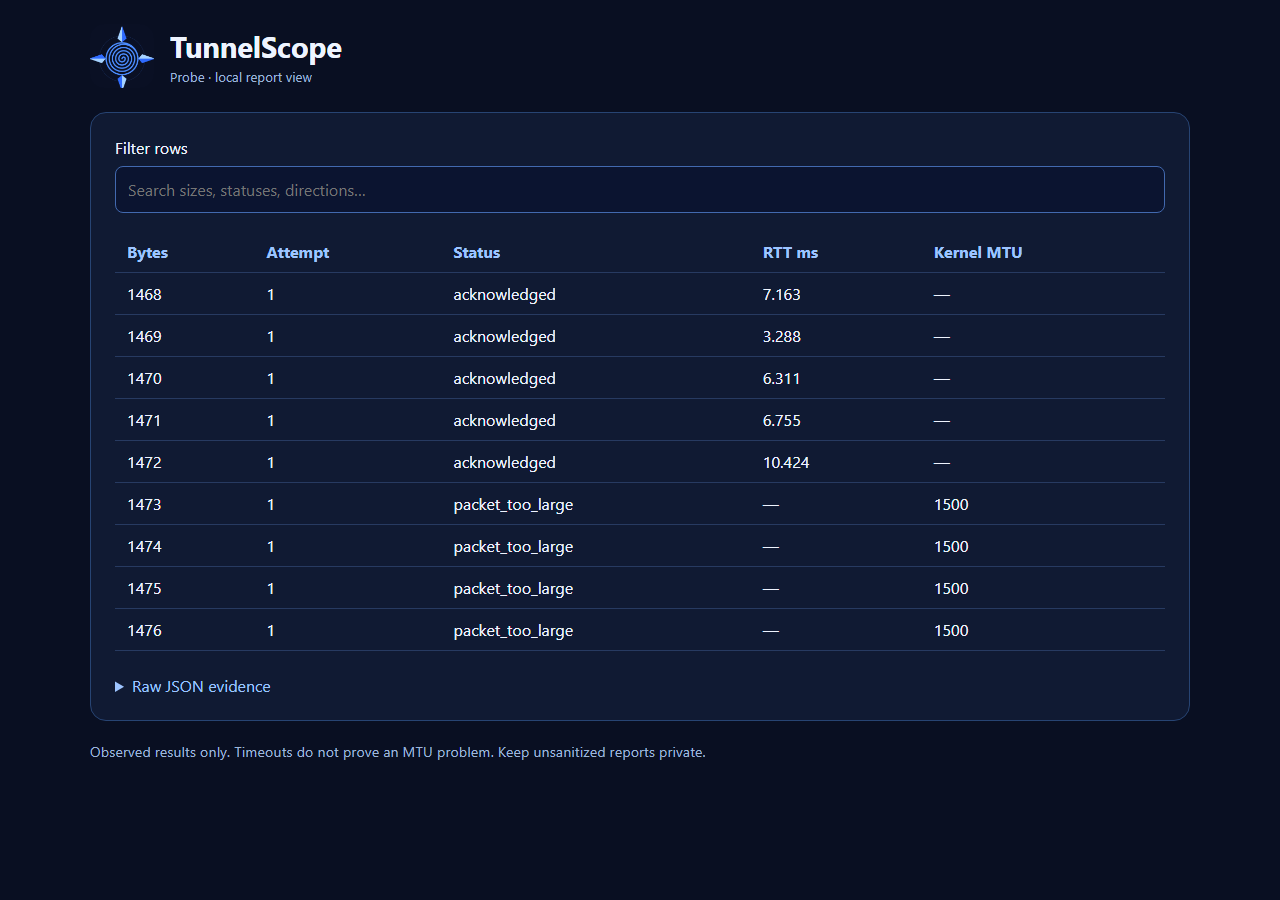
The CLI can also create a self-contained HTML report view that works offline:
tunnelscope html report.json --output report.html
Install from a source checkout
From the repository root, in a Python 3.10+ virtual environment:
python3 -m pip install .
tunnelscope --help
The package installs the tunnelscope command. It has no third-party runtime
dependencies. The laboratory scripts still run from a source checkout.
The CLI also supports --sweep START:STOP:STEP for a bounded
grid of UDP payload sizes. It includes the stop size even when the step does
not land on it. For example:
tunnelscope probe 192.0.2.2 --sweep 64:1400:100 --count 2 --dont-fragment --output sweep.json
The grid tests at most 16 sizes. The result records observations at those sizes; it is not an exact path-MTU measurement. See the size sweep guide.
Probe and report details
No third-party runtime packages are needed. The commands below also work from
a source checkout by replacing tunnelscope with python tunnelscope.py.
By default, the receiver exits after 100 datagrams or 30 seconds without a
datagram. Restart it if it has already exited. --max-packets and
--idle-timeout change these limits.
Probe sizes are UDP payload bytes, including TunnelScope's 24-byte header. They exclude IP and UDP headers. The receiver sends only a small acknowledgement, so this is not a same-sized round-trip test. Reverse endpoint roles to investigate delivery in the other direction.
Each probe report includes a source snapshot taken from the first connected sender socket. It records the local IPv4 or IPv6 address. On Linux, it also records the selected interface and its link MTU when discoverable, plus kernel_route_mtu_bytes when the kernel supplies it. The link MTU and kernel route MTU are different facts; neither is an independently measured end-to-end path MTU. A failed connection may leave source as null, and optional fields may be absent.
acknowledged means that the receiver got that payload and its acknowledgement returned. timeout means no matching acknowledgement arrived before the deadline; it does not prove an MTU issue. socket_error records a socket error. Without --dont-fragment, fragmentation follows OS defaults; the tool does not force it on or off. The CLI exits successfully when it produces a report; inspect per-probe statuses for delivery outcomes.
JSON reports also include summary.by_payload_size. Each entry counts acknowledged, packet_too_large, timeout and socket_error attempts separately. Its assessment is delivery_observed, kernel_rejected_df_payload, inconclusive, socket_error or mixed_observations. Repeated payload sizes share one entry, while individual attempts remain in results. The summary does not infer an exact path MTU or turn a timeout into a diagnosis.
The evidence section lists counted observations, tentative hypotheses and missing checks separately. A clean pattern where every acknowledged size is below every timed-out size suggests a possible size-related delivery problem; in DF mode it also lists a possible PMTU-feedback black hole. Filtering and ordinary loss remain alternative explanations. Mixed or reversed size patterns produce no such hypothesis. Missing evidence calls out same-sized reverse traffic, receiver/path observation for timeouts, ICMP feedback visibility in DF mode and fragmentation control when DF is off. These are prompts for investigation, not automatic root-cause findings.
To compare directions, run probe once from A to B and once from B to A, then combine the two JSON files:
tunnelscope combine a-to-b.json b-to-a.json --output bidirectional.json
The command preserves the two reports and aligns per-size assessments; it does not initiate a remote measurement. See the two-endpoint workflow for the receiver and sender steps. endpoint_check compares the recorded IPv4 addresses but cannot authenticate endpoints or account for address translation.
Linux no-fragment mode
tunnelscope probe 192.0.2.2 --sizes 64,1252,1253,1400 --count 1 --dont-fragment --output report.json
Use the address of your lab receiver; 192.0.2.2 is an example. For IPv4, this mode sets IP_MTU_DISCOVER=IP_PMTUDISC_DO on each sender socket. The kernel sets DF and rejects datagrams above its currently known path MTU. For IPv6, it sets Linux IPV6_DONTFRAG to prevent source fragmentation. It does not bypass cached PMTU information or search automatically for a boundary. The flag requires Linux, including WSL2. Other platforms reject it; socket-option errors stop the experiment rather than silently reverting to defaults. See the IPv6 workflow.
In DF mode, EMSGSIZE is reported as packet_too_large, with its numeric errno. When available, kernel_reported_mtu_bytes contains the connected socket's IP_MTU value. That value is kernel knowledge, not an independently measured end-to-end MTU. Timeouts remain inconclusive. The JSON schema version remains 1 with additive fields and the new packet_too_large status; consumers must handle it explicitly.
Reproduce a known MTU boundary
On Linux with root access and iproute2 installed:
sudo python3 labs/mtu_boundary.py > mtu-boundary.json
The lab creates two temporary network namespaces connected by a veth pair with MTU 1280. It probes both directions and checks that 1252-byte UDP payloads succeed while 1253-byte payloads fail in DF mode (20-byte IPv4 header + 8-byte UDP header). It changes no host interface MTU or host route and removes its namespaces on completion or ordinary interruption. As with any process, forced termination such as SIGKILL can prevent cleanup.
This validates a directly attached link boundary, not an unknown multi-hop bottleneck or a PMTU black hole. See the validation record and captured example report.
Reproduce blocked PMTU feedback
On Linux with root access, iproute2, iptables and sysctl installed:
sudo python3 labs/pmtu_blackhole.py > pmtu-blackhole.json
This lab creates a sender, router and receiver in temporary network namespaces. The sender-facing link has MTU 1500; the router's receiver-facing link has MTU 1280. The router drops only its outgoing ICMP fragmentation-needed messages. In DF mode, 64- and 1252-byte UDP payloads are acknowledged, while 1253- and 1400-byte payloads time out. The lab changes no host routes, interfaces or firewall rules and removes its namespaces on ordinary completion or interruption. Forced termination such as SIGKILL can prevent cleanup.
The known lab topology explains these timeouts; a timeout on an unknown network remains inconclusive. See the validation record and captured report. This lab demonstrates one controlled failure mode; it does not establish automatic black-hole detection.
The receiver binds to IPv4 loopback by default. For your own two-host lab, use --bind <receiver-lab-address> and probe that address. An IPv6 literal such as ::1 selects IPv6; --family ipv6 selects an AAAA record for a hostname. The experimental protocol is unencrypted and unauthenticated; use a controlled lab, not a public service.
Run checks:
python -m unittest discover -s tests -v
Privileged Linux integration check (also run by CI on Ubuntu):
sudo env TUNNELSCOPE_RUN_NETNS_TESTS=1 python3 -m unittest discover -s tests -v
Prior art and scope
Existing tools such as ping, tracepath and packet analyzers already provide important building blocks. TunnelScope will explore whether controlled two-endpoint tests and evidence-oriented reporting make this investigation easier. It is not a replacement for a full packet analyzer.
Contributing
Early feedback is welcome through GitHub Issues, especially reproducible examples where small traffic succeeds and larger transfers fail. Describe the environment, expected behavior and observed behavior. Use synthetic or sanitized examples; do not attach credentials or private packet captures.
1 maintainer

Metadata
1 maintainer
Release files for tunnelscope 0.4.0
For a detailed explanation of source distributions (sdists) and built distributions (wheels), please see the package formats documentation.
Source distribution (sdist)
| File | Size | Uploaded | Provenance | Actions |
|---|---|---|---|---|
| tunnelscope-0.4.0.tar.gz | 500.7 kB | With provenance | Details for tunnelscope-0.4.0.tar.gz |
Built distribution (wheel)
| File | Interpreter | ABI | Platform | Actions Reset |
|---|---|---|---|---|
| tunnelscope-0.4.0-py3-none-any.whl | Python 3 | none | any | Details for tunnelscope-0.4.0-py3-none-any.whl |
Total release size: 692.2 kB
Release files / tunnelscope-0.4.0.tar.gz
| Download URL | tunnelscope-0.4.0.tar.gz |
|---|---|
| Size | 500.7 kB |
| Tags | Source |
|
SHA-256 checksum How to use checksums |
c92656ba5c6b1268bb56da5eaa55c0ce88864746dfc67a27b25577f839d26459
|
|
BLAKE2b-256 checksum How to use checksums |
897f02c6bed507333d73b96f6dbbdbadbfdf3592ba8b5f3c17875fe742331374
|
| Upload date | |
|
Uploaded using Trusted Publishing? What is trusted publishing? |
Yes |
| Uploaded via |
twine/7.0.0 CPython/3.13.16
|
Provenance
Provenance describes where a file came from. On PyPI, provenance is shared via attestations, which provide a verifiable record of the build or publishing details. View details, limitations and caveats.


PyPI Publish Attestation
PyPI verified that this artifact, at this checksum, originated from the publisher listed below.
Signed by GitHub Actions, verified by PyPI on Oct 28, 2026.
Transparency logRelease files / tunnelscope-0.4.0-py3-none-any.whl
| Download URL | tunnelscope-0.4.0-py3-none-any.whl |
|---|---|
| Size | 191.5 kB |
| Tags | Python 3 |
|
SHA-256 checksum How to use checksums |
9725fa5c26b9cf8bcaa14f56c092f88ac99c7634c87a7ccab01e26ab0fc916c8
|
|
BLAKE2b-256 checksum How to use checksums |
c695c89271844b77b97fdbd5f93eb9e660ff00c96048dbca7939d40a194e8476
|
| Upload date | |
|
Uploaded using Trusted Publishing? What is trusted publishing? |
Yes |
| Uploaded via |
twine/7.0.0 CPython/3.13.16
|
Provenance
Provenance describes where a file came from. On PyPI, provenance is shared via attestations, which provide a verifiable record of the build or publishing details. View details, limitations and caveats.
PyPI Publish Attestation
PyPI verified that this artifact, at this checksum, originated from the publisher listed below.
Signed by GitHub Actions, verified by PyPI on Oct 28, 2026.
Transparency logSecurity for tunnelscope 0.4.0
Provenance
Provenance describes where a file came from. On PyPI, provenance is shared via attestations, which provide a verifiable record of the build or publishing details. View details, limitations and caveats.
Full provenance
All 2 files in this release have been uploaded with provenance metadata.
Attestation for tunnelscope-0.4.0.tar.gz
PyPI Publish Attestation
PyPI verified that this artifact, at this checksum, originated from the publisher listed below.
Signed by GitHub Actions, verified by PyPI on Oct 28, 2026.
Transparency logA note on package security
PyPI is a repository for distributing packages, not a service for auditing them. While third-party security researchers and our staff do their best to detect and remove malicious packages, PyPI cannot guarantee the quality, security or suitability of any given package.
To learn more about protecting yourself from malicious actors, visit our package security documentation.














