
UADAPy - Uncertainty-aware Data Analysis with Python

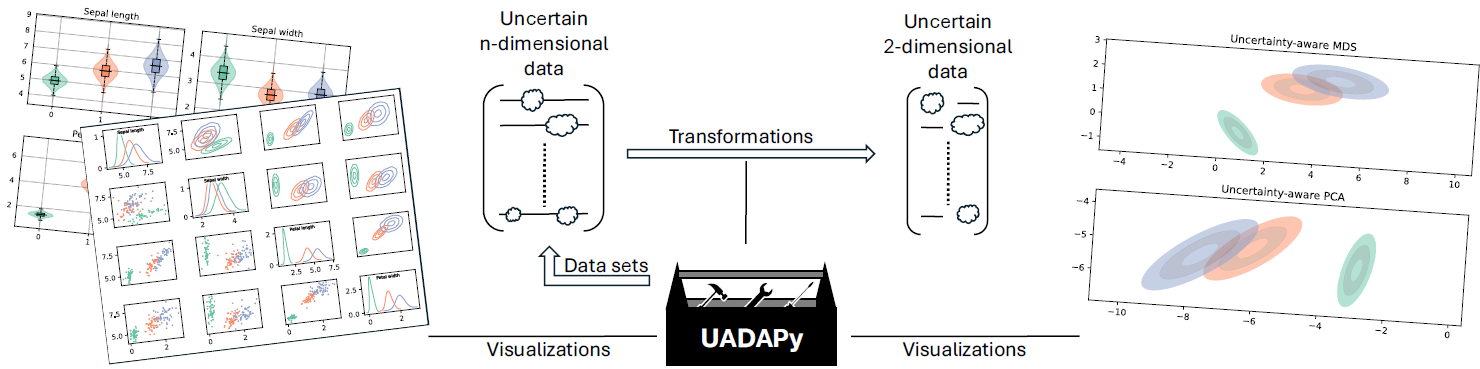
UADAPy is a Python package to support an easy analysis of uncertain data.
The library provides:
- a unified
Distributionclass that wraps around various other distribution types such asscipy.stats.<class> - a
TimeSeriesclass that models uncertain time series and builds on theDistributionclass - implementations of uncertainty-propagating visualization algorithms, e.g., UAPCA, UAMDS, UASTL
- simple plotting API that already contains all the boilerplate code to visualize distributions
- specializes in iso-contour plotting for distributions (determines probability densities that correspond to specific quantiles, automatic grid positioning, orientation, and sizing for density sampling)
- uncertain/distributional datasets, e.g. Student Grades dataset
Installation
The package is available through PyPI and can be installed via pip
pip install uadapy
To get bleeding edge features, you can also install it from git
pip install git+https://github.com/UniStuttgart-VISUS/uadapy@<ref>
Documentation
You can find the documentation here: https://unistuttgart-visus.github.io/uadapy/
It also contains an overview of all supported methods.
Usage Example
You bring your uncertain data, and UADAPy wraps it in Distributions.
from uadapy import Distribution
import numpy as np

X, y = my_labeled_samples()
unique_y = np.unique(y)
grouped_X = [X[np.where(y == label)[0]] for label in unique_y]
# KDE of the underlying distributions (default when passing samples)
distributions_kde = [Distribution(grouped_X[i]) for i in range(len(unique_y))]

# or wrap a scipy.stats distribution for example
from scipy.stats import multivariate_normal
means = [np.mean(grouped_X[i], axis=0) for i in range(len(unique_y))]
covs = [np.cov(grouped_X[i], rowvar=False) for i in range(len(unique_y))]
distributions_gauss = [
  Distribution(multivariate_normal(mean=means[i], cov=covs[i], allow_singular=True)) for i in range(len(unique_y))
]
Then transform your distributions, using dimensionality reduction for instance.
# UAPCA readily projects gaussians
from uadapy.dr.uapca import uapca
gaussians_projected = uapca(distributions_gauss, n_dims=2)

# if distributions are not gaussians, GMMs can be leveraged
from uadapy.dr.wgmm_uapca import wgmm_uapca
from uadapy.distributions import multivariate_gmm
# KDE to GMM
gmms = [Distribution(multivariate_gmm.gmm_from_kde(d.kde)) for d in distributions_kde]
kdes_projected = wgmm_uapca(gmms, n_dims=2)
Visualize your distributions.
import matplotlib.pyplot as plt
from uadapy.plotting import plots_2d
fig, axs = plt.subplots(1, 1+len(unique_y), figsize=(2*len(unique_y), 2), sharex=True, sharey=True)
# combined plot of all distributions
plots_2d.plot_contour(kdes_projected, axs=axs[0], fig=fig)
axs[0].set_aspect('equal', adjustable='box')
# individual plots per distribution
for i in range(len(unique_y)):
    plots_2d.plot_contour(kdes_projected[i], axs=axs[i+1], fig=fig, distrib_colors=['#ff0088'])
    axs[i+1].set_aspect('equal', adjustable='box')
plt.tight_layout()
plt.show()

More detailed examples covering the different visualizations and algorithms can be found here: https://unistuttgart-visus.github.io/uadapy/examples.html The examples refer to the most recent version of UADAPy. If you obtain errors, please make sure to install the most recent code version directly from GitHub.
Citation
If you use this software in your work, please cite it using the following metadata
@INPROCEEDINGS{UADAPy,
  author={Paetzold, Patrick and Hägele, David and Evers, Marina and Weiskopf, Daniel and Deussen, Oliver},
  booktitle={2024 IEEE Workshop on Uncertainty Visualization: Applications, Techniques, Software, and Decision Frameworks},
  title={UADAPy: An Uncertainty-Aware Visualization and Analysis Toolbox},
  year={2024},
  volume={},
  number={},
  pages={48-50},
  keywords={Uncertainty;Data analysis;Software packages;Conferences;Software algorithms;Pipelines;Data visualization;Python;Uncertainty visualization;software toolbox},
  doi={10.1109/UncertaintyVisualization63963.2024.00011}}
3 maintainers


Metadata
3 maintainers
Release files for uadapy 0.2.1
For a detailed explanation of source distributions (sdists) and built distributions (wheels), please see the package formats documentation.
Source distribution (sdist)
| File | Size | Uploaded | |
|---|---|---|---|
| uadapy-0.2.1.tar.gz | 103.1 kB | Details |
Built distribution (wheel)
| File | Interpreter | ABI | Platform | Reset |
|---|---|---|---|---|
| uadapy-0.2.1-py3-none-any.whl | Python 3 | none | any | Details |
Total release size: 210.6 kB
Release files / uadapy-0.2.1.tar.gz
| Download URL | uadapy-0.2.1.tar.gz |
|---|---|
| Size | 103.1 kB |
| Tags | Source |
|
SHA-256 checksum How to use checksums |
dd05ea10d5bacf6ee63bf8fd044e08018438094511c20452f2b327c7296aaa6d
|
|
BLAKE2b-256 checksum How to use checksums |
b87abc0245303e9ccf9edc2c7f3b03f4ee0c1ac1fd27e4b6d1ce25a6df952d04
|
| Upload date | |
|
Uploaded using Trusted Publishing? What is trusted publishing? |
No |
| Uploaded via |
twine/7.0.0 CPython/3.13.14
|
Release files / uadapy-0.2.1-py3-none-any.whl
| Download URL | uadapy-0.2.1-py3-none-any.whl |
|---|---|
| Size | 107.5 kB |
| Tags | Python 3 |
|
SHA-256 checksum How to use checksums |
d612762833cc51118cc2bdd67f4ec12afe5df5dac23833b5bcfced8771c299ec
|
|
BLAKE2b-256 checksum How to use checksums |
ef4d7abecb031faadde515d2a50d1fedd7e085d4f18eb3a068f145941577e424
|
| Upload date | |
|
Uploaded using Trusted Publishing? What is trusted publishing? |
No |
| Uploaded via |
twine/7.0.0 CPython/3.13.14
|














