





Type a country's name, get a table. undata is a Python package for the UN System Data Commons, which holds statistics from 26 UN System entities. It is written for colleagues who need numbers for a report, not a course in APIs.
Alpha. It works today; the API may still change before 1.0. Unofficial. A Nerd Lab experiment, not affiliated with or endorsed by the United Nations. The data belongs to the agencies that publish it.
Three lines to a spreadsheet
pip install undata
import undata as un

table = un.get("undata/sdg/SH_STA_MORT.SEX--F", ["Bangladesh", "Viet Nam"])
un.save(table, "maternal-mortality.xlsx")  # data on one sheet, citations on the next
In Google Colab, run !pip install undata in the first cell. For the latest unreleased
changes: pip install "git+https://github.com/nerd-factory/undata".
Don't know the indicator's id? un.search("maternal mortality") lists matching indicators
with their names. Copy the id from the first column.
Everything on one screen
| Function | What it does |
|---|---|
un.search("words") |
Find indicators by what they measure: UN collections, one row per indicator, with coverage. |
un.about(indicator) |
What an indicator is, whose it is, its unit, years, and its SDG metadata link. |
un.get(indicator, countries, years) |
The numbers: one row per country and year, with unit and source. by="sex" for a breakdown, wide=True for one column per indicator. |
un.latest(indicator, countries) |
Each country's most recent value. within=10 keeps only values from the past ten years and names the countries whose latest is older. |
un.coverage(table) |
How complete a table is: who has a value, who was too old, who has none, and which years. |
un.totals(indicator, ["World", "LDCs"]) |
The official figure for a region or group, as the agency published it. |
un.change(indicator, countries, 2015, 2023) |
Before, after, the difference and the percentage change. |
un.compare({"a": id1, "b": id2}, countries) |
Indicators side by side, with who has which spelled out. |
un.breakdowns(indicator) |
Every breakdown: by sex, age, wealth and so on. |
un.countries(region) · un.regions() |
The UN M49 list: countries and areas with their UN names, M49 regions, and the LDC, LLDC and SIDS groups. |
un.sdg.goals() · targets(16) · indicators("16.1") · series("16.1.2") |
Walk from an SDG goal down to indicators you can fetch. |
un.progress(indicator, countries, better="lower", target=70) |
On track for 2030? The UN Statistics Division's progress method, country by country. |
un.profile(country, indicators) |
One country beside its M49 region and the world, with its rank in the region. |
un.gap(indicator, countries, by="sex") |
The gap between two groups (women and men, rural and urban, poorest and richest) in the same year. |
un.trend(...) · un.benchmark(indicator) · un.availability(...) |
Change since 2015; UN groups side by side; which countries report what, and how recently. |
un.describe(table) |
Plain-English sentences about a table, worked out from its numbers. |
un.chart(table) |
A publication-ready chart picked to fit the table, with its source underneath. interactive=True for hover and zoom. Needs pip install "undata[charts]". |
un.style() · un.palette() |
Give your own matplotlib and seaborn charts the same look. |
un.save(table, "file.xlsx") · un.cite(table) |
Excel or CSV with sources; citations for a report. |
un.for_ai(table, task="brief") |
The table with its sources, caveats and a task, to paste into an AI assistant. |
un.ai_pack(table, "pack.zip") |
The data, a data dictionary and a prompt, to upload to an AI assistant. |
un.powerquery(indicator, countries) |
Power Query code that fetches the same data in Power BI or Excel. |
un.ask("a question") |
What data.un.org's search box decided, including whether it guessed the place. |
un.configure(cache=True) |
Keep responses on disk, for slow connections and notebooks that run again. |
Wherever a function asks for countries you can write names the way you would in an email
("Viet Nam", "Vietnam", "VNM"), a list of them, a region such as "Southern Asia"
or "Africa", or a UN group: "LDCs", "LLDCs", "SIDS". Wherever it asks for an
indicator, an SDG number such as "3.1.1" works when one series reports it. Every
function explains itself: help(un.get).
From a terminal
The same, without writing Python:
undata search "maternal mortality"
undata totals 3.1.1 World LDCs SIDS --latest
undata change 3.1.1 "Southern Asia" --start 2015 --end 2023 --describe
undata get 3.1.1 LDCs --years 2015-2023 --to maternal-mortality.xlsx
undata powerquery 3.1.1 "Southern Asia" > query.m
Every table has the same columns:
country iso3 year value unit indicator_name indicator source source_url
The country list is the UN's own
Countries, regions and groups come from UN M49, the UN Statistics Division's
standard, shipped with the package and checked against the UN's current table every
night. Tables use official UN names, regions follow M49, and the LDC, LLDC and SIDS
groups are the current UN lists (44, 32 and 53 countries), not the platform's older
copies. Places the platform holds outside M49 are left out of every list, region and
group; they can still be asked for by platform code, such as country/XKS.
The analyses UN reports run most
table = un.progress("3.1.1", "LDCs", better="lower", target=70)
un.chart(table, "ldc-progress.png")
print(un.describe(table))
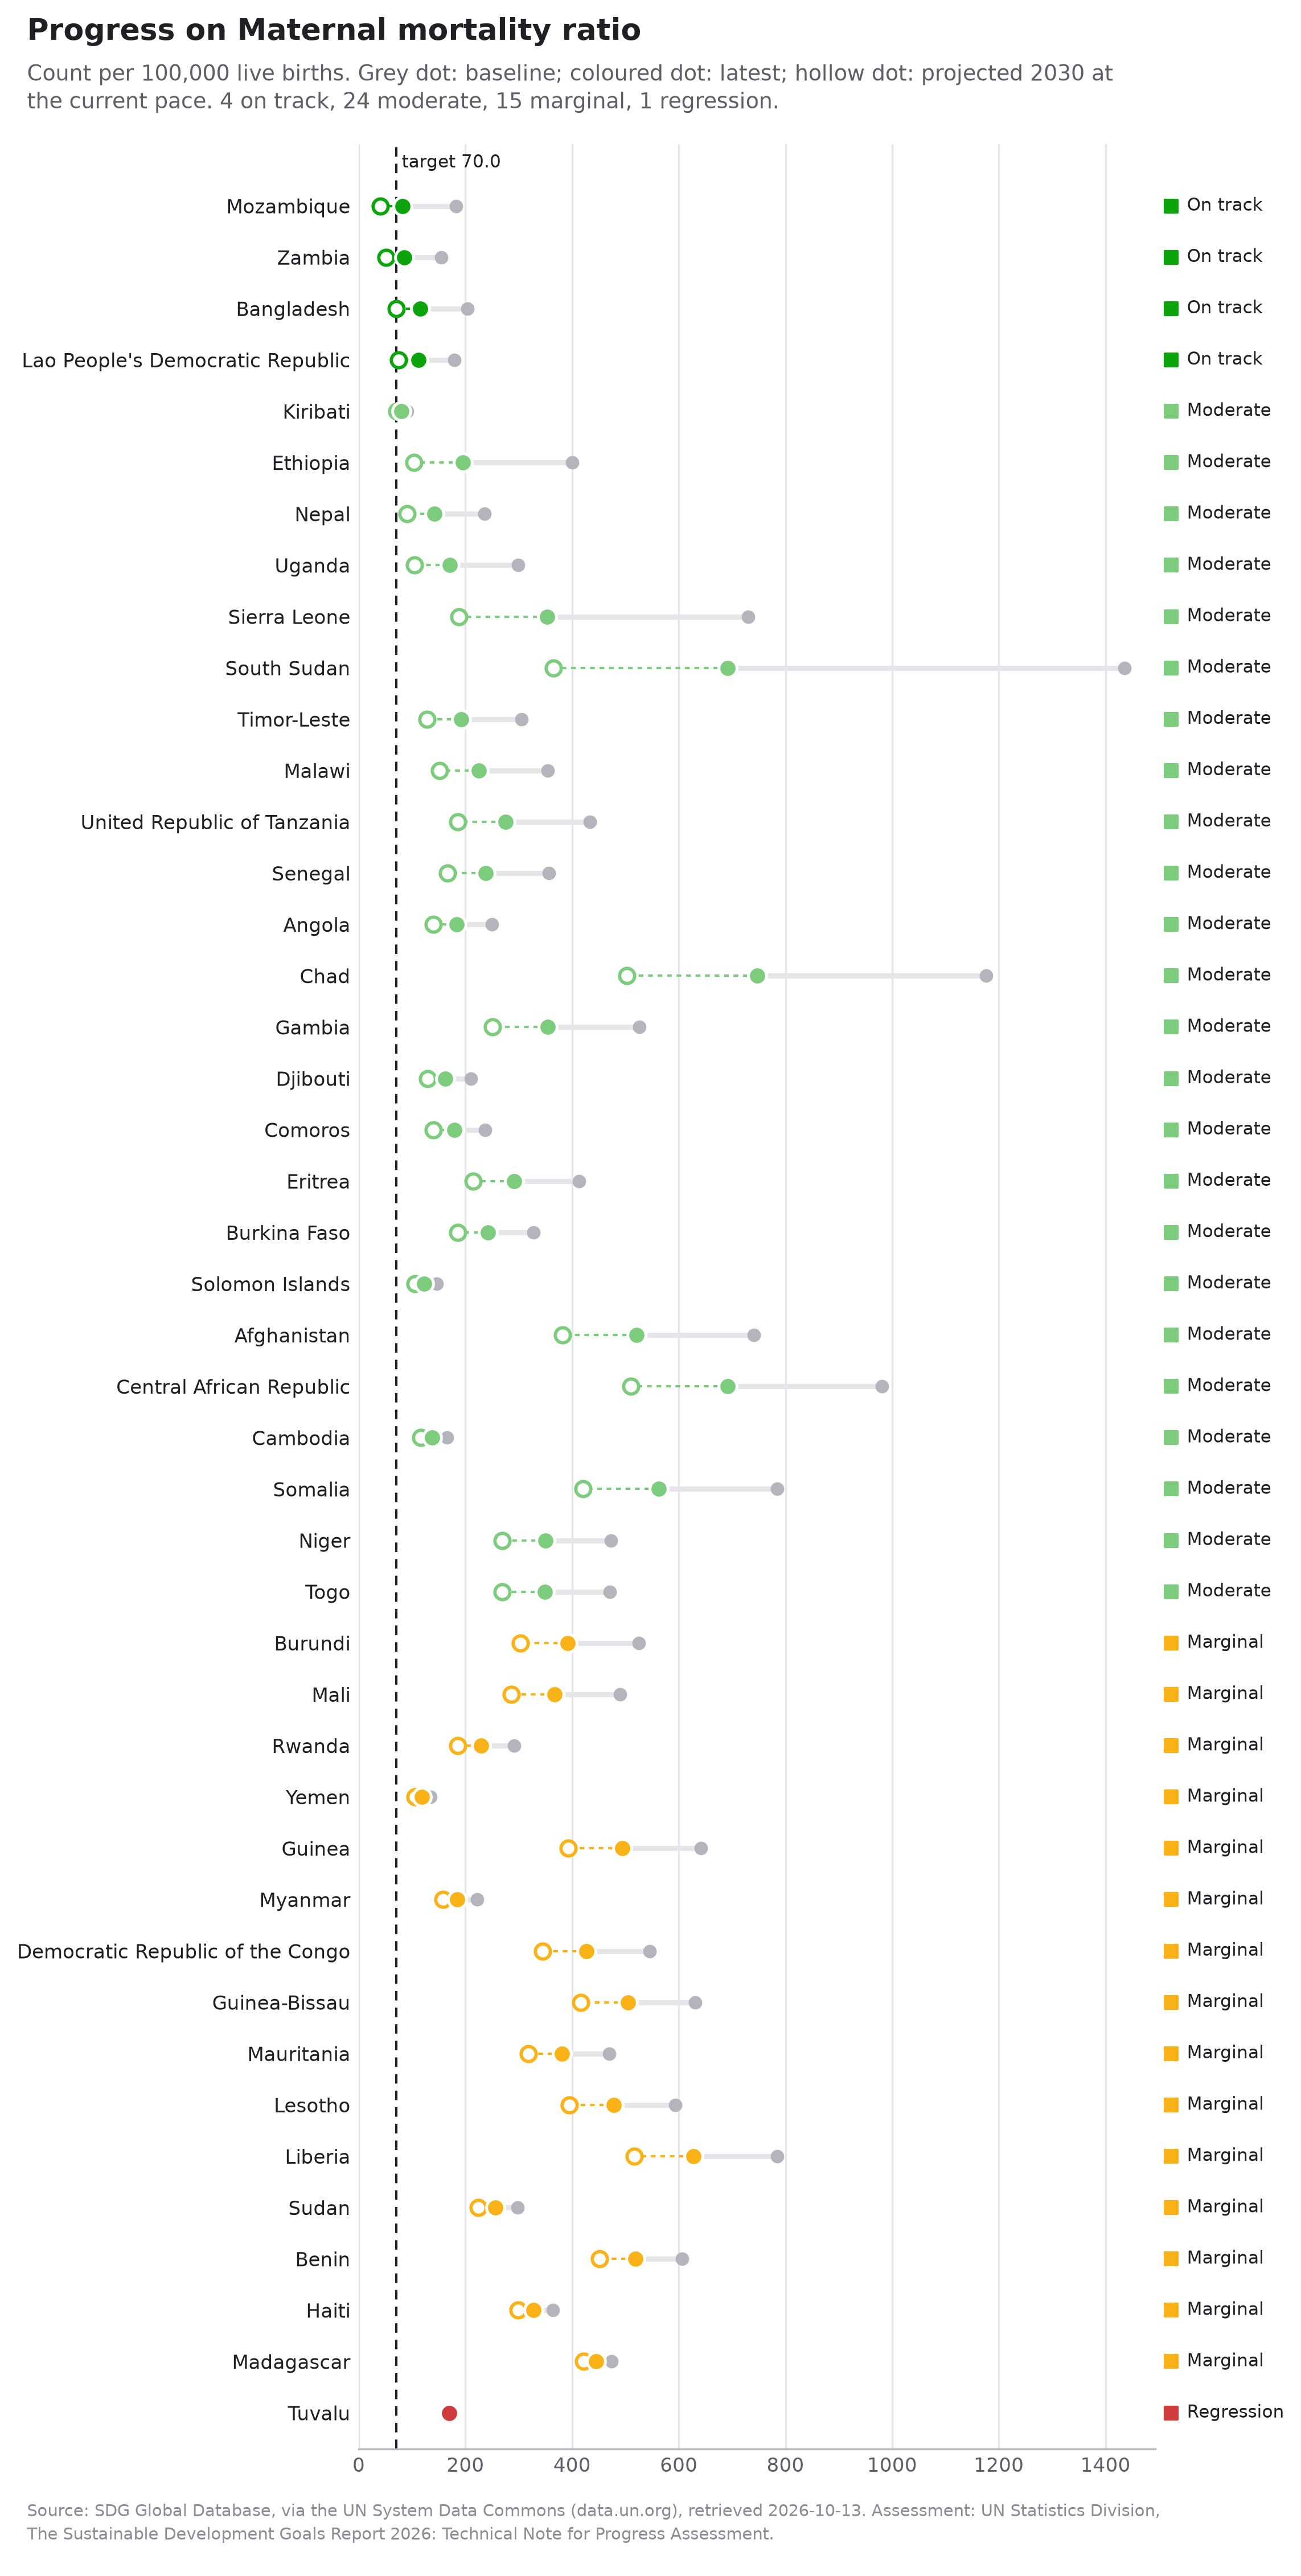
un.progress follows the UN Statistics Division's Technical Note for Progress
Assessment step by step. It takes each country's growth rate since 2015 and projects it
to 2030. With a target, it compares the projected change with the change the target
needs; without one, it scores the growth rate. Each country then lands in the five
categories the SDG Report uses, from "on track" to "regression", with the method
cited in the table. un.profile, un.gap, un.trend, un.benchmark and
un.availability cover the other questions that come up in every country analysis and
progress report, and each has a chart made for it.
Charts ready for a publication
un.chart(table) looks at the table and picks the chart: ranked bars, lines, small
multiples when there are too many lines, before-and-after dot plots, a scatter for two
indicators, a heatmap of who reports what, a tile map with one equal square per
country, or the progress, profile and gap charts above. Every chart carries its title,
unit and source line, labels its marks directly, and uses palettes checked for colour
blindness. PNG at 300 dpi, or SVG and PDF with text left editable. context="slides"
sizes it for a presentation, interactive=True returns a Plotly chart with hover
(pip install "undata[interactive]"), and un.style() gives your own matplotlib and
seaborn charts the same look. Tile maps avoid drawing borders, so they take no position
on disputed boundaries.
In Claude, as a connector
undata is also an MCP connector, so an AI assistant such as Claude can search UN indicators, fetch data and run the analyses itself, with the sources, years and gaps in every answer. Ask it "Which least developed countries are on track to bring maternal mortality below 70 by 2030? Show me a chart." and it calls the same functions you would.
It needs uv, which fetches Python and the package on first use. In Claude Desktop, open Settings → Developer → Edit Config and add:
{
  "mcpServers": {
    "undata": {
      "command": "uvx",
      "args": ["--from", "undata[mcp]", "undata-mcp"]
    }
  }
}
In Claude Code: claude mcp add undata -- uvx --from "undata[mcp]" undata-mcp. Any
other MCP client can run undata-mcp (after pip install "undata[mcp]") over stdio, or
undata-mcp --http for Streamable HTTP on http://127.0.0.1:8000/mcp.
| Tool | What the assistant can do |
|---|---|
undata_search_indicators · undata_describe_indicator · undata_browse_sdg |
Find an indicator by words or by SDG goal, target and number; read its unit, source, years and breakdowns. |
undata_list_places |
List countries in an M49 region or UN group, or the regions and groups themselves. |
undata_get_data · undata_latest_values · undata_group_totals |
Values by year (paged), each country's latest, and the official totals for regions, groups and the world. |
undata_change_over_time · undata_compare_indicators · undata_check_availability |
Change between two years, indicators side by side, and who reports what and how recently. |
undata_assess_progress · undata_country_profile · undata_group_gap · undata_benchmark_groups |
The analyses: on track for 2030 by the UN Statistics Division's method, a country beside its region and the world, the gap between two groups, UN groups side by side. |
Every tool only reads, needs no account or key, and answers with a table, a summary sentence, the data-quality notes and the sources. The analysis tools can also return their chart as an image.
Taking it to an AI assistant without a connector
table = un.latest("3.1.1", "LDCs", within=10)
un.ai_pack(table, "maternal-mortality.zip")  # upload, then paste prompt.md
print(un.for_ai(table, task="brief"))  # or paste this as one message
The pack holds data.csv, metadata.md (what each column means; each indicator's
unit, source and citation; how complete the data is; the caveats) and prompt.md
(rules that keep the assistant to these numbers, and a task). Tasks: explain,
brief, trends, gaps, chart.
The careful parts are built in
- It never guesses a place. data.un.org's search box answers a question about "Bengal" with figures for the United States. undata stops and says it does not know "Bengal".
- Gaps are named, never zero. Countries without data are left out of the table and listed
in a
MissingDataWarning, so a chart cannot show them as zeros. - UN names in, UN names out. Tables say Türkiye, Viet Nam and Côte d'Ivoire, whatever spelling you typed.
- The source is on every row. The same statistic can come from several agencies with different numbers.
- Mixed years are flagged. "Latest" means each country's own latest year; a
MixedYearsWarningsays when those differ. - It works where other clients fail. The platform's firewall blocks Google's official
datacommons-client(any POST body containing"select") and any GET request that mentions Western Sahara, Greece or Slovenia (ESH,GRC,SVN, mistaken for command names). undata routes around all of them.
Each behaviour is pinned by a test in tests/live/ that runs against the real platform every night and opens an issue if the platform changes. Most of them were found while writing the UN Data Commons Field Guide.
Use cases
Twelve requests as they arrive in UN work, each a runnable script in examples/ that ends with a sentence ready for the report:
| # | Who | What |
|---|---|---|
| 01 | Resident Coordinator's Office | A briefing note: Chad against its Sahel neighbours |
| 02 | SDG reporting | Maternal mortality in Southern Asia since 2015, against the Target 3.1 level |
| 03 | Gender focal point | Women in parliament in Eastern Africa: who has passed 30%, who reached parity |
| 04 | Humanitarian coordination | Refugees by country of origin, in number and per person |
| 05 | Peace and security | Conflict deaths against homicide, and who reports at all |
| 06 | Statistics focal point | One statistic, three agencies, two numbers: what to cite |
| 07 | Publications team | A regional data pack in Excel, with citations and gaps on their own sheets |
| 08 | Monitoring and evaluation | A dashboard file that refreshes itself on a schedule |
| 09 | Communications | Checking what data.un.org's search box decided before sharing its chart |
| 10 | SDG reporting | Which least developed countries are on track for 2030, by the UN's own method |
| 11 | Country team | Chad against Middle Africa and the world, on one chart |
| 12 | Leave no one behind | The rural-urban gap in finishing primary school |
They run against the live platform every night. The use-cases page shows each with its code, a chart, the real output and the sentence.
For developers
The friendly functions sit on three layers you can use directly: undata.Transport (the
only code that touches the network), undata._endpoints (one thin wrapper per API route),
and undata.dcid (the identifier grammar). PLAN.md covers the design and the
road to 1.0.
git clone https://github.com/nerd-factory/undata && cd undata
uv sync                     # Python 3.11+, installs dev tools
uv run pytest               # unit tests and doctests, offline
uv run pytest -m live       # pins the live platform's behaviour (network)
uv run ruff check . && uv run ruff format --check . && uv run mypy
See CONTRIBUTING.md. Questions that feel too basic are welcome in Nerd Lab Discussions; they are not too basic.
Licence
Code: MIT. Data fetched with it is governed by the UN Data Commons terms of use and by each contributing agency's own terms.
1 maintainer

Metadata
1 maintainer
Release files for undata 0.4.0
For a detailed explanation of source distributions (sdists) and built distributions (wheels), please see the package formats documentation.
Source distribution (sdist)
| File | Size | Uploaded | |
|---|---|---|---|
| undata-0.4.0.tar.gz | 126.7 kB | Details |
Built distribution (wheel)
| File | Interpreter | ABI | Platform | Reset |
|---|---|---|---|---|
| undata-0.4.0-py3-none-any.whl | Python 3 | none | any | Details |
Total release size: 229.5 kB
Release files / undata-0.4.0.tar.gz
| Download URL | undata-0.4.0.tar.gz |
|---|---|
| Size | 126.7 kB |
| Tags | Source |
|
SHA-256 checksum How to use checksums |
c124624ab4c76836cff976f240696fd93b3558b9008bf465208de0a58ef2e66c
|
|
BLAKE2b-256 checksum How to use checksums |
502fd2b41865caa4ba00e36e1adc44c8ddf3ea1667eb5838512c0006965b783f
|
| Upload date | |
|
Uploaded using Trusted Publishing? What is trusted publishing? |
Yes |
| Uploaded via |
twine/7.0.0 CPython/3.13.14
|
Provenance
Provenance describes where a file came from. On PyPI, provenance is shared via attestations, which provide a verifiable record of the build or publishing details. View details, limitations and caveats.


PyPI Publish Attestation
PyPI verified that this artifact, at this checksum, originated from the publisher listed below.
Signed by GitHub Actions, verified by PyPI on Oct 13, 2026.
Transparency logRelease files / undata-0.4.0-py3-none-any.whl
| Download URL | undata-0.4.0-py3-none-any.whl |
|---|---|
| Size | 102.8 kB |
| Tags | Python 3 |
|
SHA-256 checksum How to use checksums |
1700de83ebd5505a64ea0f6ddd1fe3186f805bf5ba2854a2a36b5df1b3463f3e
|
|
BLAKE2b-256 checksum How to use checksums |
3e40fecc6f6fca180b6aba5d25e3a5ec734483208c973f81662728375aaf2e91
|
| Upload date | |
|
Uploaded using Trusted Publishing? What is trusted publishing? |
Yes |
| Uploaded via |
twine/7.0.0 CPython/3.13.14
|
Provenance
Provenance describes where a file came from. On PyPI, provenance is shared via attestations, which provide a verifiable record of the build or publishing details. View details, limitations and caveats.
PyPI Publish Attestation
PyPI verified that this artifact, at this checksum, originated from the publisher listed below.
Signed by GitHub Actions, verified by PyPI on Oct 13, 2026.
Transparency log













