Python library for downloading UNICEF indicators via SDMX API

Project description
unicefData - Python Package


Python component of the trilingual unicefData library for downloading UNICEF SDG indicators via SDMX API
This is the Python implementation of the unicefData package. For other implementations, see the links below.
Other languages: R | Stata | Main README
Installation
pip install unicefdata
For development:
git clone https://github.com/unicef-drp/unicefData.git
cd unicefData/python
pip install -e ".[dev]"
Verify Installation
import unicefdata
print(unicefdata.__version__)
2.2.2
What's New in 2.4.0
- Query status codes: Empty results now tell you why via
df.attrs["query_status"]:year_not_found— country has data, but not for the requested year (gap in time series)year_beyond_range— requested year is before the earliest or after the latest data pointcountry_not_found— indicator exists but not for this country (includesavailable_countries)indicator_not_found— indicator doesn't exist in any dataflow
- Client-side year filtering: Fixes 6 survey-based indicators (NUTRITION, MNCH, EDUCATION) that failed with year filters due to an SDMX API quirk
- Smarter fallback logic: No longer wastes API calls trying non-existent fallback dataflows when data simply doesn't exist for the requested country/year
df = unicefData("MNCH_CSEC", countries=["BRA"], year=2020)
# len(df) == 0
print(df.attrs["query_status"])     # "year_not_found"
print(df.attrs["available_years"])  # [2000, 2001, ..., 2019]
print(df.attrs["nearest_year"])     # 2019
What's New in 2.2.2
UNICEFSDMXClientdataflow resolution fixed:fetch_indicator()now auto-detects the correct dataflow from metadata instead of always defaulting toGLOBAL_DATAFLOW, consistent withunicefData()
What's New in 2.2.1
- Bundled metadata paths corrected: Startup warnings about missing fallback sequences and indicators metadata are resolved
- Codelists filename fixed:
MetadataManagernow correctly loads_unicefdata_codelists.yaml - Category lookup fixed:
list_categories()andsearch_indicators(category=...)now return correct results instead of allUNKNOWN
See CHANGELOG.md for complete details.
What's New in 2.2.0
- 328+ automated tests across 11 test families with deterministic fixtures
- Full CI matrix: Python 3.9–3.12 on Ubuntu / macOS / Windows
- Bug fixes: Sex filter for full-dataflow, None indicator handling, retry logic
- Input validation: Filters empty/whitespace indicators with helpful error messages
Quick Start
Search for Indicators
from unicefdata import search_indicators, list_categories

# List all categories
list_categories()
==================================================
  Available Indicator Categories
==================================================

  CATEGORY                       COUNT
--------------------------------------------------
  NUTRITION                        112
  CAUSE_OF_DEATH                    83
  CHILD_RELATED_SDG                 77
  WASH_HOUSEHOLDS                   64
  EDUCATION_UIS_SDG                 62
  PT                                52
  GLOBAL_DATAFLOW                   50
  CHLD_PVTY                         43
  CME                               39
  HIV_AIDS                          38
  MNCH                              38
  DM                                31
  MG                                26
  IMMUNISATION                      18
  GENDER                            16
  ECON                              13
  FUNCTIONAL_DIFF                   12
  SOC_PROTECTION                    10
  ECD                                8
--------------------------------------------------
  TOTAL                            792

  Use search_indicators(category='CATEGORY_NAME') to see indicators
# Search by keyword
search_indicators("mortality")
====================================================================================================
  UNICEF Indicators matching 'mortality'
====================================================================================================

  Found 24 indicator(s)
----------------------------------------------------------------------------------------------------
  CODE                  CATEGORY           NAME                                 DESCRIPTION
----------------------------------------------------------------------------------------------------
  CME_MRM0              CME                Neonatal mortality rate              Probability of d..
  CME_MRY0              CME                Infant mortality rate                Probability of d..
  CME_MRY0T4            CME                Under-five mortality rate            Probability of d..
  CME_MRY5T14           CME                Mortality rate (children aged 5 t..  Probability of d..
  MNCH_MMR              MNCH               Maternal mortality ratio (number ..  Maternal mortali..
  ...
----------------------------------------------------------------------------------------------------
  Usage tips:
  - unicefData(indicator='CODE') to fetch data for an indicator
  - search_indicators(category='CME') to browse by category
# Search within a category
search_indicators(category="CME")
search_indicators("rate", category="CME")
Download Data
from unicefdata import unicefData

# Fetch under-5 mortality rate (dataflow auto-detected)
df = unicefData(
    indicator="CME_MRY0T4",
    countries=["ALB", "USA", "BRA"],
    year="2015:2023"   # range, single year, or list
)

print(df.shape)
print(df[["iso3", "country", "period", "indicator", "value"]].to_string(index=False))
(27, 21)

iso3       country  period  indicator      value
 ALB       Albania  2015.0 CME_MRY0T4   9.586263
 ALB       Albania  2016.0 CME_MRY0T4   9.400753
 ALB       Albania  2017.0 CME_MRY0T4   9.336307
 ALB       Albania  2018.0 CME_MRY0T4   9.344314
 ALB       Albania  2019.0 CME_MRY0T4   9.386670
 ALB       Albania  2020.0 CME_MRY0T4   9.435272
 ALB       Albania  2021.0 CME_MRY0T4   9.456832
 ALB       Albania  2022.0 CME_MRY0T4   9.436385
 ALB       Albania  2023.0 CME_MRY0T4   9.357239
 BRA        Brazil  2015.0 CME_MRY0T4  15.963330
 BRA        Brazil  2016.0 CME_MRY0T4  16.771457
 ...
 USA United States  2023.0 CME_MRY0T4   6.482592
# Summary statistics
print(df["value"].describe().round(2))
count    27.00
mean     10.40
std       3.70
min       6.46
25%       6.64
50%       9.40
75%      14.66
max      16.77
Name: value, dtype: float64
# Cross-country pivot table (countries × years)
print(df.groupby(["iso3", "period"])["value"].first().unstack().round(1))
period  2015.0  2016.0  2017.0  2018.0  2019.0  2020.0  2021.0  2022.0  2023.0
iso3
ALB        9.6     9.4     9.3     9.3     9.4     9.4     9.5     9.4     9.4
BRA       16.0    16.8    15.4    15.2    15.0    14.9    14.7    14.6    14.4
USA        6.8     6.7     6.6     6.5     6.5     6.5     6.5     6.5     6.5
View Dataflow Schema
from unicefdata import dataflow_schema, print_dataflow_schema

print_dataflow_schema(dataflow_schema("CME"))
----------------------------------------------------------------------
Dataflow Schema: CME
----------------------------------------------------------------------

Name: Child Mortality
Version: 1.0
Agency: UNICEF

Dimensions (4):
  REF_AREA
  INDICATOR
  SEX
  WEALTH_QUINTILE

Attributes (7):
  DATA_SOURCE
  COUNTRY_NOTES
  REF_PERIOD
  UNIT_MEASURE
  LOWER_BOUND
  UPPER_BOUND
  OBS_STATUS
----------------------------------------------------------------------
Post-Production Options
Output Formats
# Long format (default) — one row per country × year
df = unicefData(indicator="CME_MRY0T4", countries=["ALB", "USA", "BRA"],
                year="2020:2022", format="long")
print(df[["iso3", "country", "period", "value"]].to_string(index=False))
iso3       country  period      value
 ALB       Albania  2020.0   9.435272
 ALB       Albania  2021.0   9.456832
 ALB       Albania  2022.0   9.436385
 BRA        Brazil  2020.0  14.873612
 BRA        Brazil  2021.0  14.723535
 BRA        Brazil  2022.0  14.588250
 USA United States  2020.0   6.469871
 USA United States  2021.0   6.464968
 USA United States  2022.0   6.473319
# Wide format — years as columns
df = unicefData(indicator="CME_MRY0T4", countries=["ALB", "USA", "BRA"],
                year="2020:2022", format="wide")
print(df[["iso3", "country", 2020.0, 2021.0, 2022.0]].to_string(index=False))
iso3       country    2020.0    2021.0    2022.0
 ALB       Albania  9.435272  9.456832  9.436385
 BRA        Brazil 14.873612 14.723535 14.588250
 USA United States  6.469871  6.464968  6.473319
# Wide indicators — indicators as columns
df = unicefData(
    indicator=["CME_MRY0T4", "CME_MRM0"],
    countries=["ALB", "USA", "BRA"],
    year="2020:2022",
    format="wide_indicators"
)
print(df[["iso3", "country", "period", "CME_MRY0T4", "CME_MRM0"]].to_string(index=False))
iso3       country  period  CME_MRY0T4  CME_MRM0
 ALB       Albania  2020.0    9.435272  7.185830
 ALB       Albania  2021.0    9.456832  7.125219
 ALB       Albania  2022.0    9.436385  6.998704
 BRA        Brazil  2020.0   14.873612  9.163120
 BRA        Brazil  2021.0   14.723535  8.893245
 BRA        Brazil  2022.0   14.588250  8.281859
 USA United States  2020.0    6.469871  3.642096
 USA United States  2021.0    6.464968  3.520667
 USA United States  2022.0    6.473319  3.477007
Latest Value Per Country
df = unicefData(
    indicator="CME_MRY0T4",
    countries=["ALB", "BRA", "DEU", "IND", "USA"],
    latest=True
)
print(df[["iso3", "country", "period", "value"]].to_string(index=False))
iso3       country  period      value
 ALB       Albania  2024.0   9.227080
 BRA        Brazil  2024.0  14.216972
 DEU       Germany  2024.0   3.711222
 IND         India  2024.0  26.579900
 USA United States  2024.0   6.472463
Most Recent Values (MRV)
df = unicefData(indicator="CME_MRY0T4", countries=["ALB", "USA", "BRA"], mrv=3)
print(df[["iso3", "country", "period", "value"]].sort_values(["iso3", "period"]).to_string(index=False))
iso3       country  period      value
 ALB       Albania  2022.0   9.436385
 ALB       Albania  2023.0   9.357239
 ALB       Albania  2024.0   9.227080
 BRA        Brazil  2022.0  14.588250
 BRA        Brazil  2023.0  14.424723
 BRA        Brazil  2024.0  14.216972
 USA United States  2022.0   6.473319
 USA United States  2023.0   6.482592
 USA United States  2024.0   6.472463
Circa (Nearest Year)
# Returns the closest available observation to the target year
df = unicefData(
    indicator="CME_MRY0T4",
    countries=["ALB", "USA", "BRA"],
    year=2015,
    circa=True
)
print(df[["iso3", "country", "period", "value"]].to_string(index=False))
iso3       country  period     value
 ALB       Albania  2015.0  9.586263
 BRA        Brazil  2015.0 15.963330
 USA United States  2015.0  6.752855
Add Metadata
df = unicefData(
    indicator="CME_MRY0T4",
    countries=["ALB", "BRA", "IND", "NGA", "USA"],
    latest=True,
    add_metadata=["region", "income_group"]
)
print(df[["iso3", "country", "period", "value", "region", "income_group"]].to_string(index=False))
iso3       country  period      value                      region        income_group
 ALB       Albania  2024.0   9.227080     Europe and Central Asia Upper middle income
 BRA        Brazil  2024.0  14.216972 Latin America and Caribbean Upper middle income
 IND         India  2024.0  26.579900                  South Asia Lower middle income
 NGA       Nigeria  2024.0 115.649434          Sub-Saharan Africa Lower middle income
 USA United States  2024.0   6.472463               North America         High income
# Frequency table by income group
print(df.groupby("income_group")["value"].agg(["count", "mean", "min", "max"]).round(2))
                    count    mean     min      max
income_group
High income             1    6.47    6.47     6.47
Lower middle income     2   71.11   26.58   115.65
Upper middle income     2   11.72    9.23    14.22
Combining Options
df = unicefData(
    indicator=["CME_MRY0T4", "CME_MRM0"],
    countries=["ALB", "BRA", "IND", "NGA", "USA"],
    format="wide_indicators",
    latest=True,
    add_metadata=["region", "income_group"],
    dropna=True
)
print(df[["iso3", "country", "CME_MRY0T4", "CME_MRM0", "region", "income_group"]].to_string(index=False))
iso3       country  CME_MRY0T4  CME_MRM0                      region        income_group
 ALB       Albania    9.227080  6.735194     Europe and Central Asia Upper middle income
 BRA        Brazil   14.216972  7.124973 Latin America and Caribbean Upper middle income
 IND         India   26.579900 16.659252                  South Asia Lower middle income
 NGA       Nigeria  115.649434 39.045723          Sub-Saharan Africa Lower middle income
 USA United States    6.472463  3.652385               North America         High income
Visualizations
The following examples use matplotlib, which is not a required dependency but is commonly available. Install with pip install matplotlib if needed.
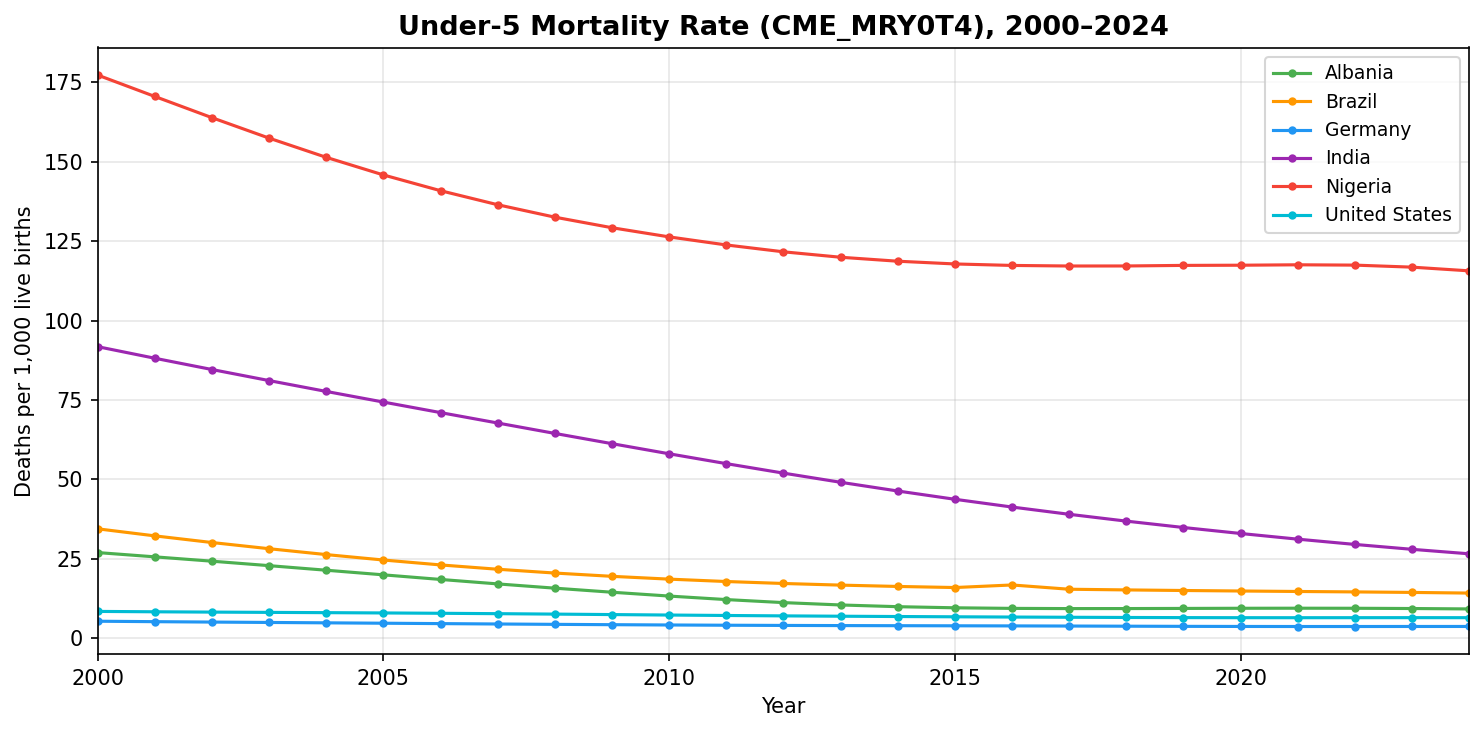
Time-Series Line Chart
import matplotlib.pyplot as plt
from unicefdata import unicefData

df = unicefData(
    indicator="CME_MRY0T4",
    countries=["ALB", "BRA", "DEU", "IND", "NGA", "USA"],
    year="2000:2024"
)

country_colors = {
    "ALB": "#4CAF50", "BRA": "#FF9800", "DEU": "#2196F3",
    "IND": "#9C27B0", "NGA": "#F44336", "USA": "#00BCD4"
}

fig, ax = plt.subplots(figsize=(10, 5))
for iso3, grp in df.groupby("iso3"):
    grp_sorted = grp.sort_values("period")
    ax.plot(grp_sorted["period"], grp_sorted["value"],
            marker="o", markersize=3,
            color=country_colors.get(iso3, "#999"),
            label=grp_sorted["country"].iloc[0])

ax.set_title("Under-5 Mortality Rate (CME_MRY0T4), 2000–2024", fontweight="bold")
ax.set_xlabel("Year")
ax.set_ylabel("Deaths per 1,000 live births")
ax.legend(loc="upper right", fontsize=9)
ax.grid(True, alpha=0.3)
plt.tight_layout()
plt.show()
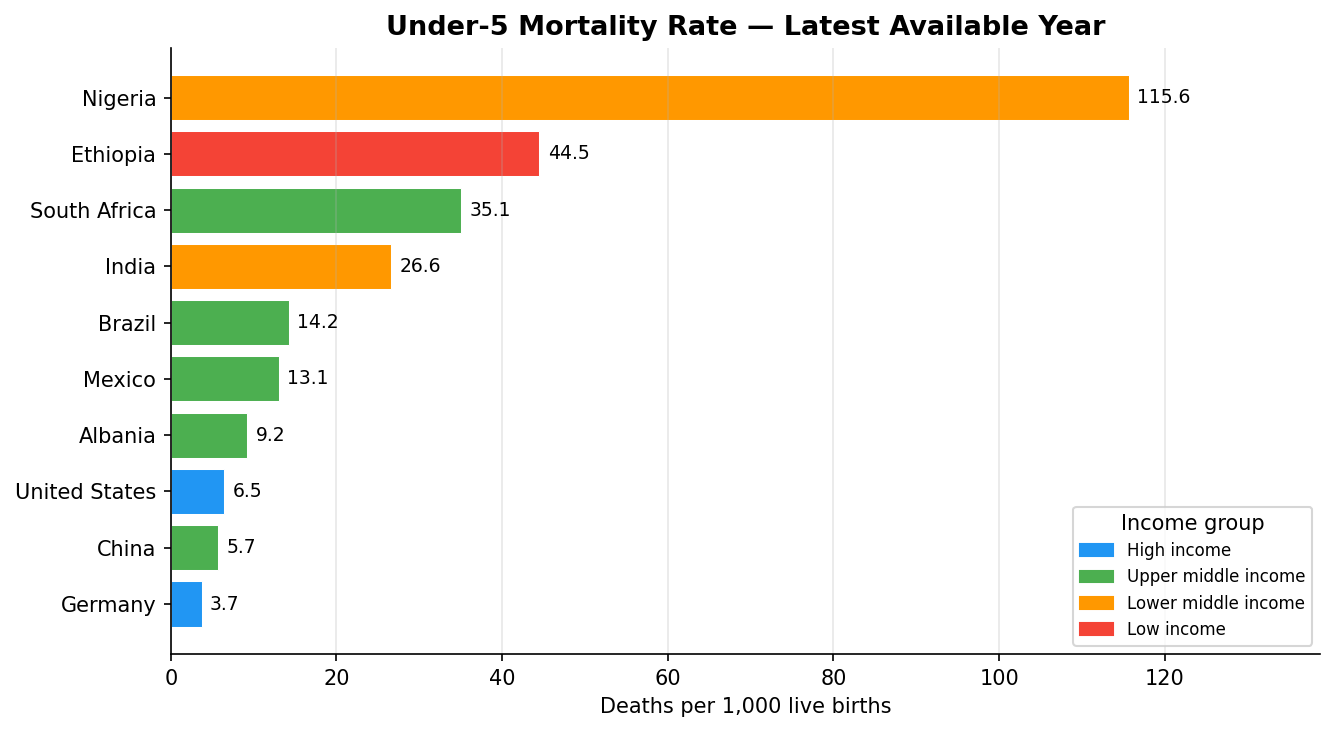
Cross-Country Bar Chart (Latest Values)
import matplotlib.pyplot as plt
from matplotlib.patches import Patch
from unicefdata import unicefData

df = unicefData(
    indicator="CME_MRY0T4",
    countries=["ALB", "BRA", "CHN", "DEU", "ETH", "IND", "MEX", "NGA", "USA", "ZAF"],
    latest=True,
    add_metadata=["income_group"]
)
df_sorted = df.sort_values("value", ascending=True)

income_colors = {
    "High income":          "#2196F3",
    "Upper middle income":  "#4CAF50",
    "Lower middle income":  "#FF9800",
    "Low income":           "#F44336"
}

fig, ax = plt.subplots(figsize=(9, 5))
bars = ax.barh(
    df_sorted["country"],
    df_sorted["value"],
    color=[income_colors.get(ig, "#999") for ig in df_sorted["income_group"]]
)
ax.bar_label(bars, fmt="%.1f", padding=4, fontsize=9)
handles = [Patch(color=c, label=l) for l, c in income_colors.items()
           if l in df_sorted["income_group"].values]
ax.legend(handles=handles, title="Income group", fontsize=8)
ax.set_title("Under-5 Mortality Rate — Latest Available Year", fontweight="bold")
ax.set_xlabel("Deaths per 1,000 live births")
ax.grid(axis="x", alpha=0.3)
plt.tight_layout()
plt.show()
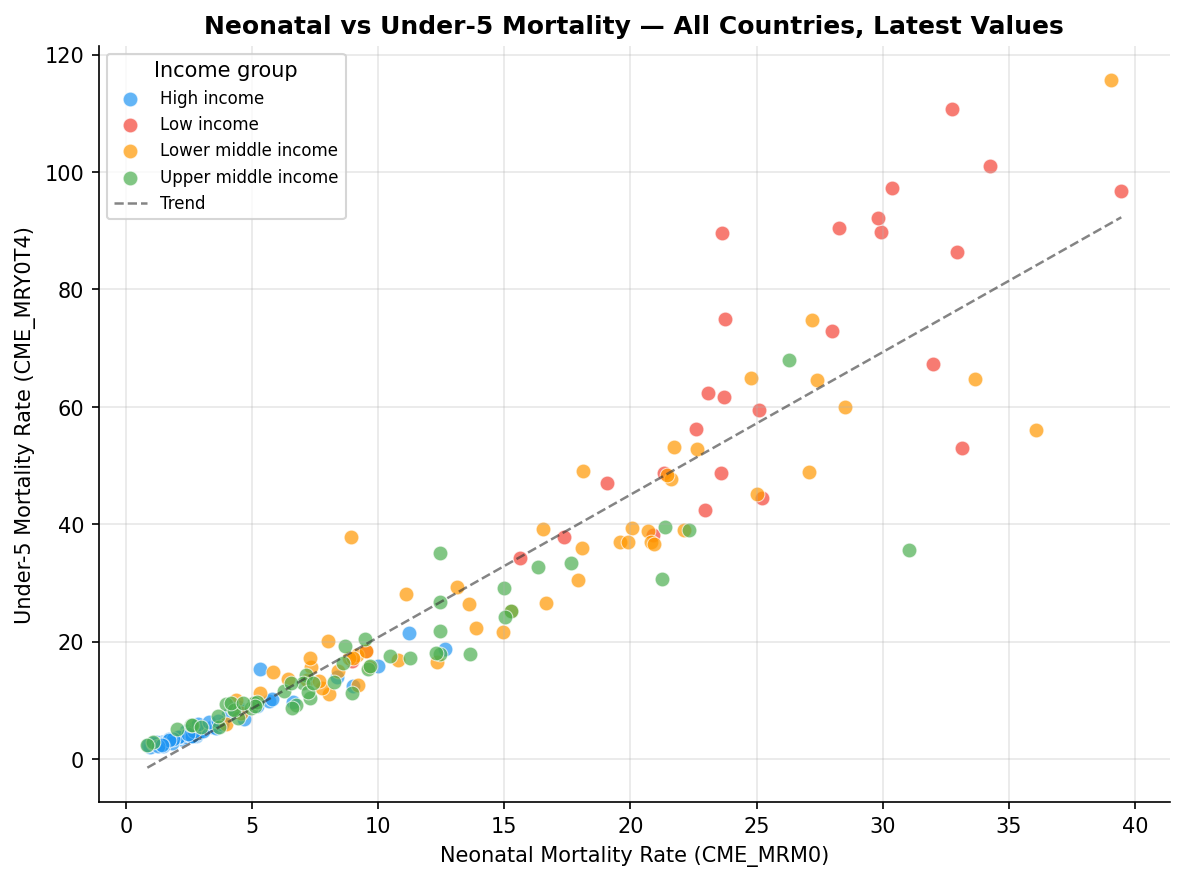
Scatter Plot: Two Indicators by Country
import numpy as np
import matplotlib.pyplot as plt
from unicefdata import unicefData

df = unicefData(
    indicator=["CME_MRY0T4", "CME_MRM0"],
    format="wide_indicators",
    latest=True,
    add_metadata=["income_group"],
    dropna=True
)

income_colors = {
    "High income":          "#2196F3",
    "Upper middle income":  "#4CAF50",
    "Lower middle income":  "#FF9800",
    "Low income":           "#F44336"
}

fig, ax = plt.subplots(figsize=(8, 6))
for ig, grp in df.groupby("income_group"):
    ax.scatter(grp["CME_MRM0"], grp["CME_MRY0T4"],
               color=income_colors.get(ig, "#999"), label=ig, alpha=0.7, s=50)

x, y = df["CME_MRM0"].values, df["CME_MRY0T4"].values
m, b = np.polyfit(x, y, 1)
xline = np.linspace(x.min(), x.max(), 100)
ax.plot(xline, m * xline + b, color="#333", linewidth=1.2, linestyle="--", alpha=0.6, label="Trend")

ax.set_xlabel("Neonatal Mortality Rate (CME_MRM0)")
ax.set_ylabel("Under-5 Mortality Rate (CME_MRY0T4)")
ax.set_title("Neonatal vs Under-5 Mortality — All Countries, Latest Values", fontweight="bold")
ax.legend(title="Income group", fontsize=8)
ax.grid(True, alpha=0.3)
plt.tight_layout()
plt.show()
Advanced: UNICEFSDMXClient
For lower-level access, use UNICEFSDMXClient directly.
from unicefdata import UNICEFSDMXClient

client = UNICEFSDMXClient()

# Fetch a single indicator
df = client.fetch_indicator(
    "CME_MRY0T4",
    countries=["ALB", "USA"],
    start_year=2020,
    end_year=2023
)
print(df[["iso3", "country", "period", "indicator", "value"]].to_string(index=False))
iso3       country  period  indicator     value
 ALB       Albania  2020.0 CME_MRY0T4  9.435272
 ALB       Albania  2021.0 CME_MRY0T4  9.456832
 ALB       Albania  2022.0 CME_MRY0T4  9.436385
 ALB       Albania  2023.0 CME_MRY0T4  9.357239
 USA United States  2020.0 CME_MRY0T4  6.469871
 USA United States  2021.0 CME_MRY0T4  6.464968
 USA United States  2022.0 CME_MRY0T4  6.473319
 USA United States  2023.0 CME_MRY0T4  6.482592
# Fetch multiple indicators combined into one DataFrame
df = client.fetch_multiple_indicators(
    ["CME_MRY0T4", "CME_MRM0"],
    countries=["ALB", "USA"],
    combine=True
)
print(f"Shape: {df.shape}")
print(df.groupby(["iso3", "indicator"])["value"].agg(["count", "mean"]).round(2))
Shape: (226, 21)

                        count    mean
iso3 indicator
ALB  CME_MRM0            72.0  12.89
     CME_MRY0T4          72.0  18.79
USA  CME_MRM0            41.0   5.48
     CME_MRY0T4          41.0   9.15
# Configurable timeout
client = UNICEFSDMXClient(timeout=120)
API Reference
unicefData()
Main function for fetching UNICEF indicator data.
| Parameter | Type | Default | Description |
|---|---|---|---|
indicator |
str/list | required | Indicator code(s) |
dataflow |
str | auto-detect | SDMX dataflow ID |
countries |
list | None (all) | ISO3 country codes |
year |
int/str/list | None (all) | Year(s) |
circa |
bool | False | Find closest year |
sex |
str | "_T" |
Sex filter |
max_retries |
int | 3 | Retry attempts |
Post-Production Parameters
| Parameter | Type | Default | Description |
|---|---|---|---|
format |
str | "long" |
"long", "wide", "wide_indicators" |
latest |
bool | False | Keep only latest per country |
mrv |
int | None | Keep N most recent values |
add_metadata |
list | None | Metadata to add |
dropna |
bool | False | Remove missing values |
simplify |
bool | False | Keep only essential columns |
Other Functions
| Function | Description |
|---|---|
search_indicators(query, category, limit) |
Search indicators |
list_categories() |
List all categories |
list_dataflows() |
List available dataflows |
dataflow_schema(dataflow) |
Get dataflow schema |
clear_cache() |
Clear all 5 cache layers |
Time Period Handling
Monthly periods are converted to decimal years:
| Original | Decimal | Calculation |
|---|---|---|
2020 |
2020.0 |
Integer year |
2020-01 |
2020.0833 |
2020 + 1/12 |
2020-06 |
2020.5000 |
2020 + 6/12 |
Common Indicators
Child Mortality (SDG 3.2)
CME_MRM0- Neonatal mortality rateCME_MRY0T4- Under-5 mortality rate
Nutrition (SDG 2.2)
NT_ANT_HAZ_NE2_MOD- Stunting prevalenceNT_ANT_WHZ_NE2- Wasting prevalence
Immunization (SDG 3.b)
IM_DTP3- DTP3 coverageIM_MCV1- Measles coverage
WASH (SDG 6)
WS_PPL_W-SM- Safely managed waterWS_PPL_S-SM- Safely managed sanitation
Child Protection
PT_CHLD_Y0T4_REG- Birth registrationPT_F_20-24_MRD_U18_TND- Child marriage
Error Handling
from unicefdata import SDMXNotFoundError, SDMXBadRequestError, SDMXTimeoutError

try:
    df = unicefData(indicator="INVALID_CODE")
except SDMXNotFoundError as e:
    print(f"Indicator not found: {e}")
except SDMXBadRequestError as e:
    print(f"Invalid request: {e}")
except SDMXTimeoutError as e:
    print(f"Request timed out: {e}")
Troubleshooting
Connection Errors
# Increase retry attempts
df = unicefData(indicator="CME_MRY0T4", max_retries=5)
Stale Cache
from unicefdata import clear_cache
clear_cache()  # Clears all 5 cache layers
Examples
See examples/ folder:
00_quick_start.py- Basic usage01_indicator_discovery.py- Finding indicators02_sdg_indicators.py- SDG queries03_data_formats.py- Output formats04_metadata_options.py- Metadata enrichment05_advanced_features.py- Advanced options
Version History
See CHANGELOG.md for complete changelog.
Dependencies
- pandas
- requests
- pyyaml
Optional: pip install "unicefdata[excel]" for Excel export support.
Acknowledgments
This package was developed at the UNICEF Data and Analytics Section. The author gratefully acknowledges the collaboration of Lucas Rodrigues, Yang Liu, and Karen Avanesian, whose technical contributions and feedback were instrumental in the development of this Python package.
Special thanks to Yves Jaques, Alberto Sibileau, and Daniele Olivotti for designing and maintaining the UNICEF SDMX data warehouse infrastructure that makes this package possible.
The author also acknowledges the UNICEF database managers and technical teams who ensure data quality, as well as the country office staff and National Statistical Offices whose data collection efforts make this work possible.
Development of this package was supported by UNICEF institutional funding for data infrastructure and statistical capacity building. The author also acknowledges UNICEF colleagues who provided testing and feedback during development, as well as the broader open-source Python community.
Development was assisted by AI coding tools (GitHub Copilot, Claude). All code has been reviewed, tested, and validated by the package maintainers.
Disclaimer
This package is provided for research and analytical purposes.
The unicefData package provides programmatic access to UNICEF's public data warehouse. While the author is affiliated with UNICEF, this package is not an official UNICEF product and the statements in this documentation are the views of the author and do not necessarily reflect the policies or views of UNICEF.
Data accessed through this package comes from the UNICEF Data Warehouse. Users should verify critical data points against official UNICEF publications at data.unicef.org.
This software is provided "as is", without warranty of any kind, express or implied, including but not limited to the warranties of merchantability, fitness for a particular purpose and noninfringement. In no event shall the authors or UNICEF be liable for any claim, damages or other liability arising from the use of this software.
The designations employed and the presentation of material in this package do not imply the expression of any opinion whatsoever on the part of UNICEF concerning the legal status of any country, territory, city or area or of its authorities, or concerning the delimitation of its frontiers or boundaries.
Data Citation and Provenance
Important Note on Data Vintages
Official statistics are subject to revisions as new information becomes available and estimation methodologies improve. UNICEF indicators are regularly updated based on new surveys, censuses, and improved modeling techniques. Historical values may be revised retroactively to reflect better information or methodological improvements.
For reproducible research and proper data attribution, users should:
- Document the indicator code - Specify the exact SDMX indicator code(s) used (e.g.,
CME_MRY0T4) - Record the download date - Note when data was accessed (e.g., "Data downloaded: 2026-03-20")
- Cite the data source - Reference both the package and the UNICEF Data Warehouse
- Archive your dataset - Save a copy of the exact data used in your analysis
Example citation for data used in research:
Under-5 mortality data (indicator: CME_MRY0T4) accessed from UNICEF Data Warehouse via unicefData Python package (v2.2.2) on 2026-03-20. Data available at: https://sdmx.data.unicef.org/
This practice ensures that others can verify your results and understand any differences that may arise from data updates. For official UNICEF statistics in publications, always cross-reference with the current version at data.unicef.org.
Citation
If you use this package, please cite:
Azevedo, Joao Pedro (2026). "unicefdata: Unified access to UNICEF indicators across R, Python, and Stata." Mimeo, UNICEF Chief Statistician Office.
Development
Development assisted by AI coding tools (GitHub Copilot, Claude). All code reviewed and validated by maintainers.
Author
Joao Pedro Azevedo (@jpazvd) Chief Statistician, UNICEF Data and Analytics Section Email: jpazevedo@unicef.org Website: jpazvd.github.io
License
MIT License - See LICENSE
Contributing
See CONTRIBUTING.md for detailed guidelines.
Release history Release notifications | RSS feed


Download files
Download the file for your platform. If you're not sure which to choose, learn more about installing packages.
Source Distribution
Built Distribution
Filter files by name, interpreter, ABI, and platform.
If you're not sure about the file name format, learn more about wheel file names.
Copy a direct link to the current filters
File details
Details for the file unicefdata-2.4.1.tar.gz.
File metadata
- Download URL: unicefdata-2.4.1.tar.gz
- Upload date:
- Size: 381.4 kB
- Tags: Source
- Uploaded using Trusted Publishing? No
- Uploaded via: twine/6.2.0 CPython/3.13.5
File hashes
| Algorithm | Hash digest | |
|---|---|---|
| SHA256 |
c41516063081fd5540968c0f5bffee7e4d868868f21b7ed58beea787580b184d
|
|
| MD5 |
9ec8d9234b4d67e49cd941e2c34c7452
|
|
| BLAKE2b-256 |
961b44a2128e0dbda31688778a08128aaa89e28acbdf95d996fec31501cbaa83
|
File details
Details for the file unicefdata-2.4.1-py3-none-any.whl.
File metadata
- Download URL: unicefdata-2.4.1-py3-none-any.whl
- Upload date:
- Size: 422.1 kB
- Tags: Python 3
- Uploaded using Trusted Publishing? No
- Uploaded via: twine/6.2.0 CPython/3.13.5
File hashes
| Algorithm | Hash digest | |
|---|---|---|
| SHA256 |
66b0744e7345595d3d680d84c70ba7c55eea60d592383588de2d703477310d14
|
|
| MD5 |
1e22161815fa7fefcdfb478a24f3a716
|
|
| BLAKE2b-256 |
9e65a5bc9fe3fd22ea1dbb6a653d64c7081e192257159de6f4f0526c7ddd35ce
|


