Unified API and style for Python plotting libraries

Project description


Unified API and style for Python plotting libraries.
Usage
| plotly | matplotlib |
import numpy as np
import uplt
x = np.linspace(0, np.pi*4, num=100)
phi = np.pi/4
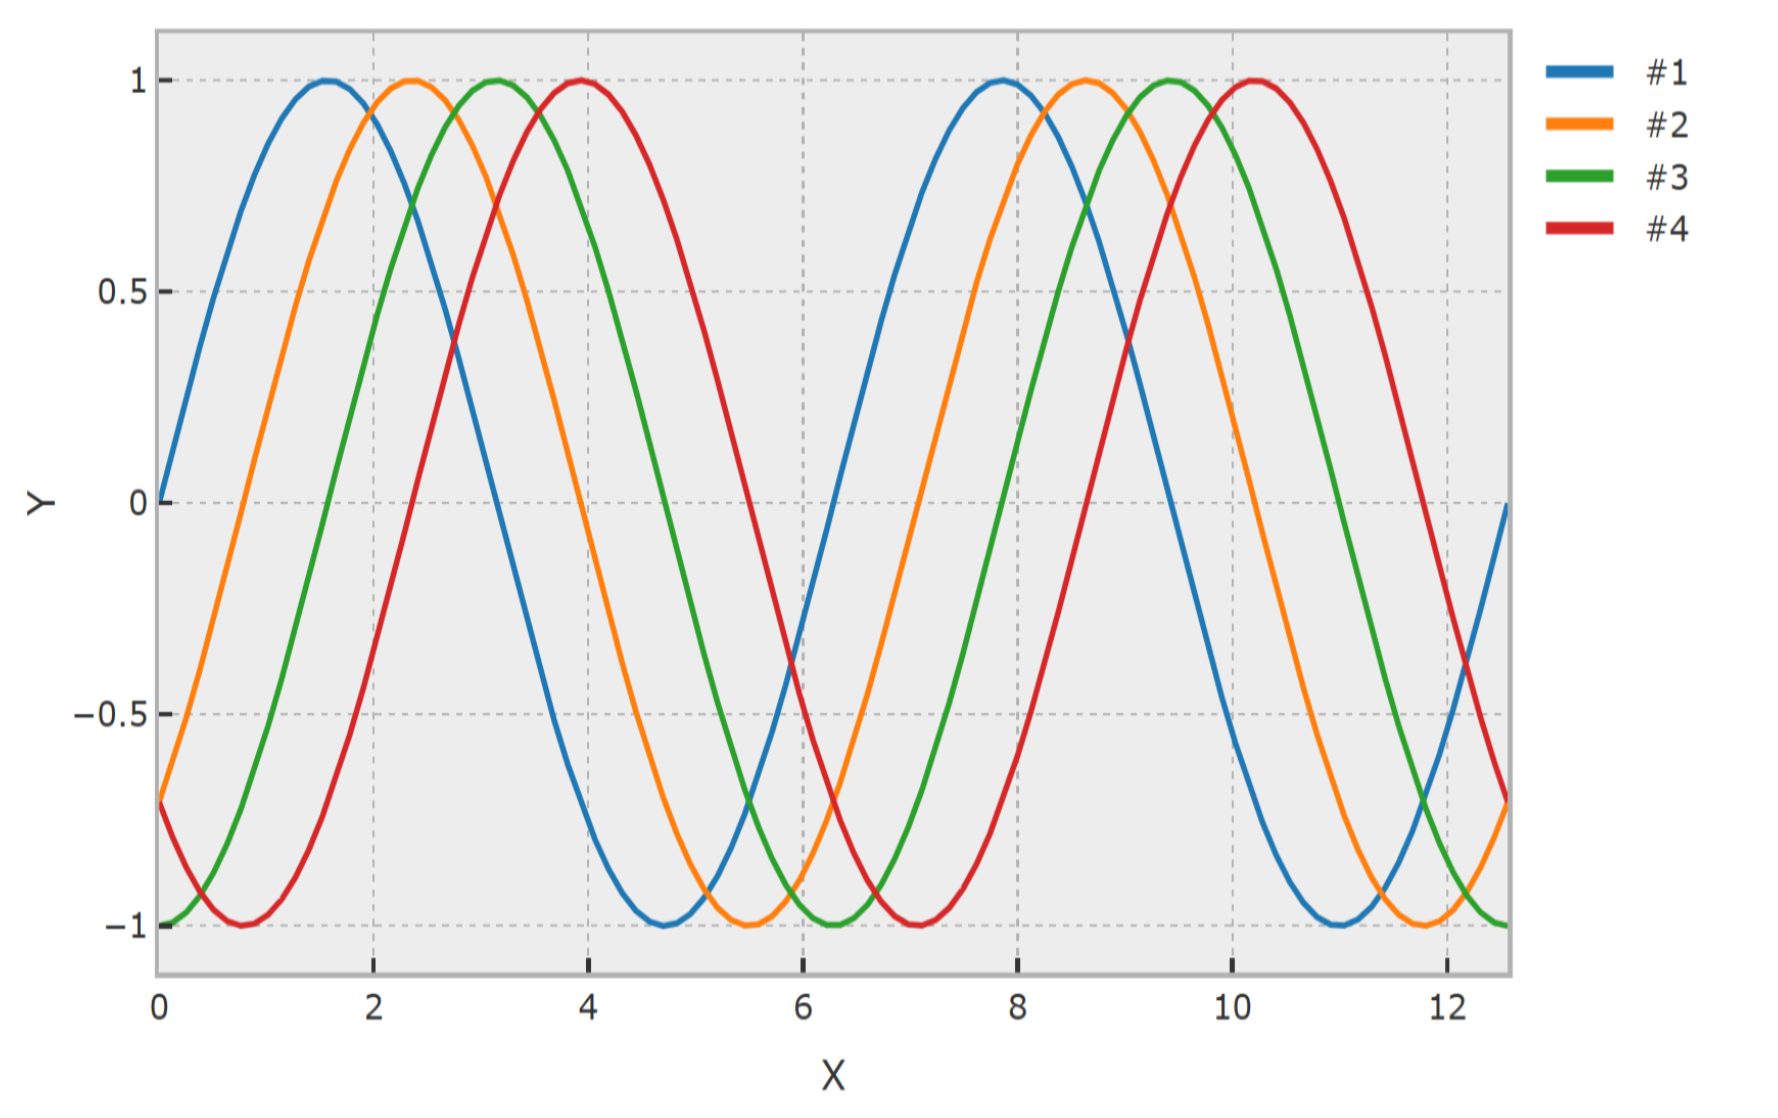
fig = uplt.figure('plotly')
fig.plot(x, np.sin(x - 0*phi), name='#1')
fig.plot(x, np.sin(x - 1*phi), name='#2')
fig.plot(x, np.sin(x - 2*phi), name='#3')
fig.plot(x, np.sin(x - 3*phi), name='#4')
fig.xlabel('X').ylabel('Y')
fig.legend().show()
|
import numpy as np
import uplt
x = np.linspace(0, np.pi*4, num=100)
phi = np.pi/4
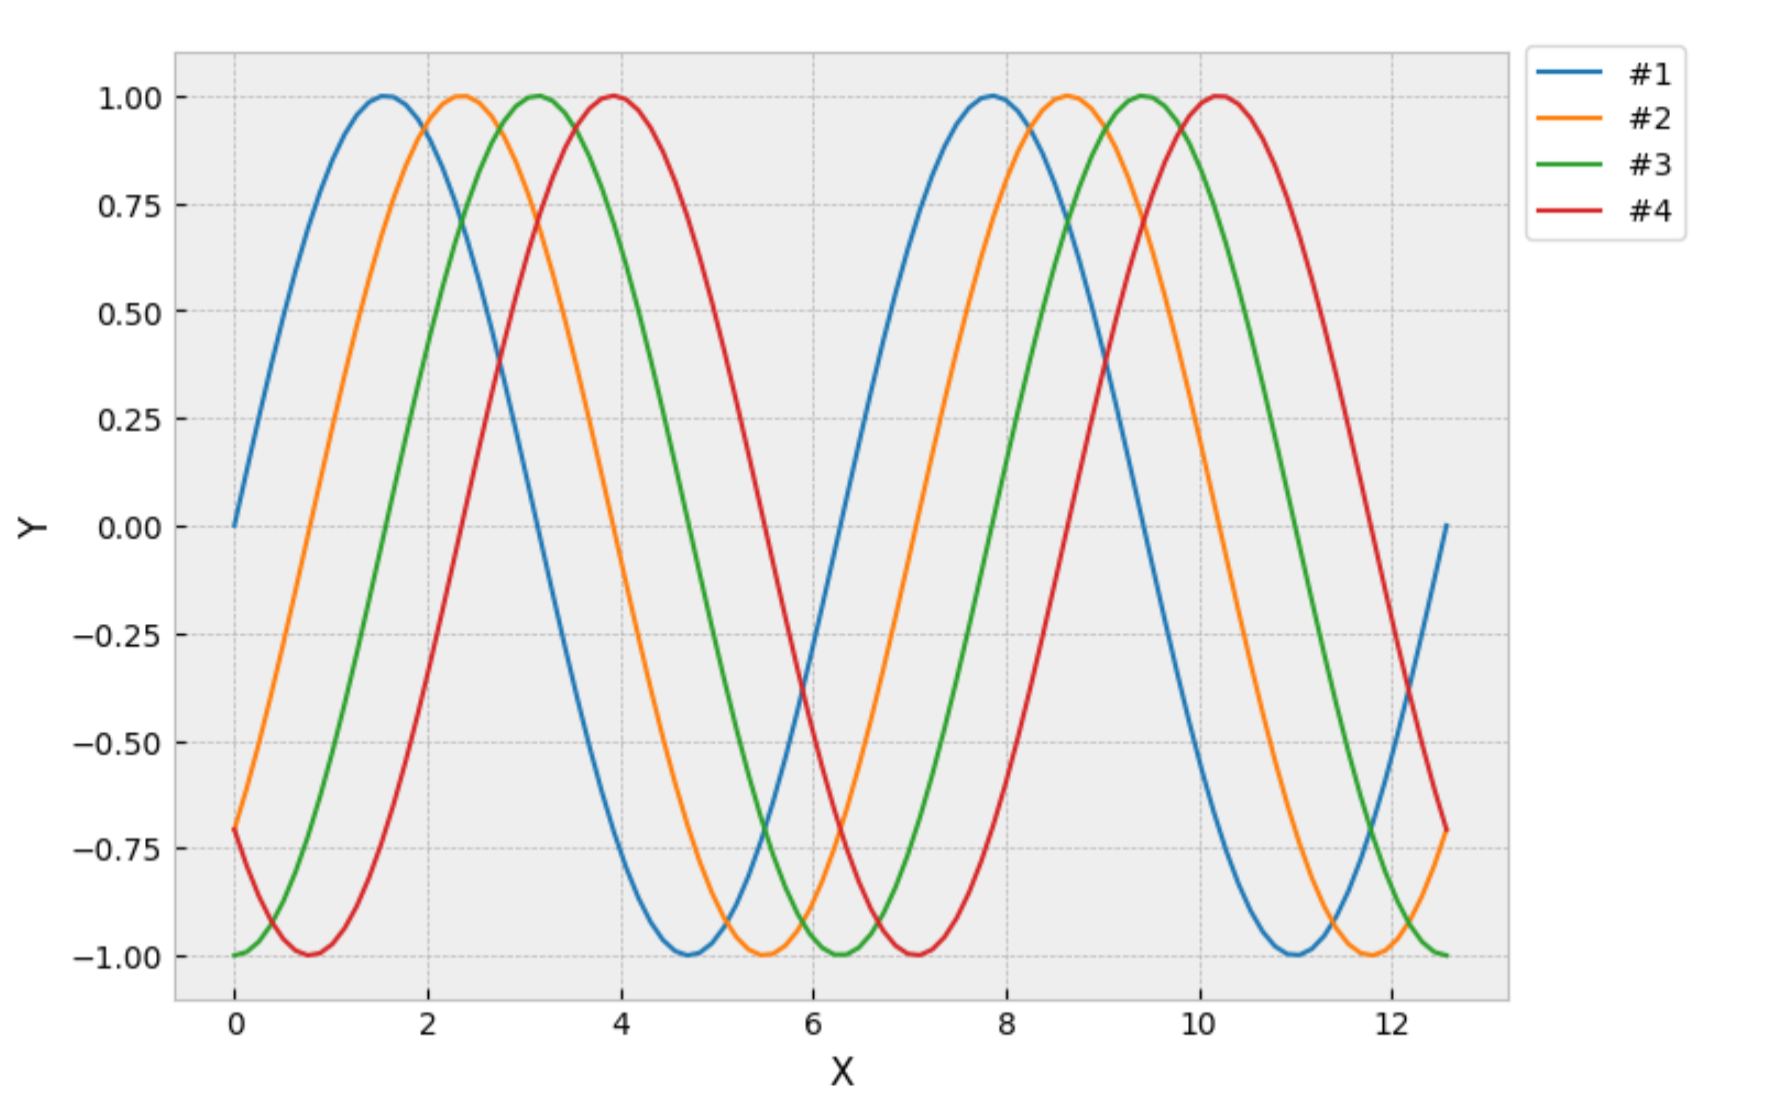
fig = uplt.figure('matplot')
fig.plot(x, np.sin(x - 0*phi), name='#1')
fig.plot(x, np.sin(x - 1*phi), name='#2')
fig.plot(x, np.sin(x - 2*phi), name='#3')
fig.plot(x, np.sin(x - 3*phi), name='#4')
fig.xlabel('X').ylabel('Y')
fig.legend().show()
|
|
|
[!TIP] See gallery for more examples.
Install
Recent stable version (without any plotting library):
pip install uplt-py
To automatically install all optional dependencies (matplotlib, plotly, ...):
pip install "uplt-py[all]"
If you need only matplotlib support:
pip install "uplt-py[matplot]"
[!TIP] Replace
[matplot]with[plotly]for plotly-only installation
Plotting Libs - Pros & Cons
Matplotlib
🟢 Highly configurable.
🟢 Good documentation and a lot of ready-to-use recipes (e.g. on StackOverflow).
🟡 Common API (MATLAB legacy).
🔴 Limited interactivity (especially for Jupyter).
🔴 API, behavior and parameter names are inconsistent (e.g. plt.xlim and axis.set_xlim).
🔴 Slow and limited 3D rendering.
Plotly
🟢 Very good interactivity.
🟢 Native compatibility with Jupyter.
🟢 Possibility to save interactive plot (html-file).
🟢 Fast and interactive 3D plot.
🔴 Not well documented (a lot of parameters, small amount of examples).
🔴 High memory consumption (limited number of plots in Jupyter).
🔴 Some expected API functions are missing (e.g. imshow).
🔴 3D and 2D axis parameters are not unified (e.g. layout.xaxis doesn't work for 3D).
Functions
| Function | Description |
|---|---|
plot(x, y, z) plot(obj) |
Plot 2D or 3D line. Line plot for custom class (supported by a plugin). |
scatter(x, y, z) scatter(obj) |
Scatter plot for 2D or 3D data points. Scatter plot for custom class (supported by a plugin). |
surface3d(x, y, z) |
Plot a surface in 3D space where the color scale corresponds to the z-values. |
bar(x, y) |
Create a bar plot. |
imshow(image) |
Display an image. |
heatmap(data) |
Display 2D heatmap with colorbar. |
hline(y) vline(x) |
Plot horizontal or vertical line. 2D only |
title(text) |
Set the title of the figure. |
legend(show) |
Show or hide the legend on the figure. |
grid(show) |
Show or hide the grid on the figure. |
xlabel(text) ylabel(text) zlabel(text) |
Set the label for the x, y, z-axis. |
xlim(min, max) ylim(min, max) zlim(min, max) |
Set limits for the x, y, z-axis. |
xscale() yscale() |
Set scale for the x, y-axis: 'linear' or 'log'. |
current_color() scroll_color(count) reset_color() |
Get the color which will be used for the next plot. Scroll a list of predefined colors for plots. Set the current color to the start of the list. |
axis_aspect(mode) |
Set the aspect ratio of the axis. |
as_image() |
Get the figure as a NumPy array. |
save(filename) |
Save the figure to a file. |
close() |
Close the figure. Free allocated resources. |
show(block) |
Display the figure. |
Plugin System
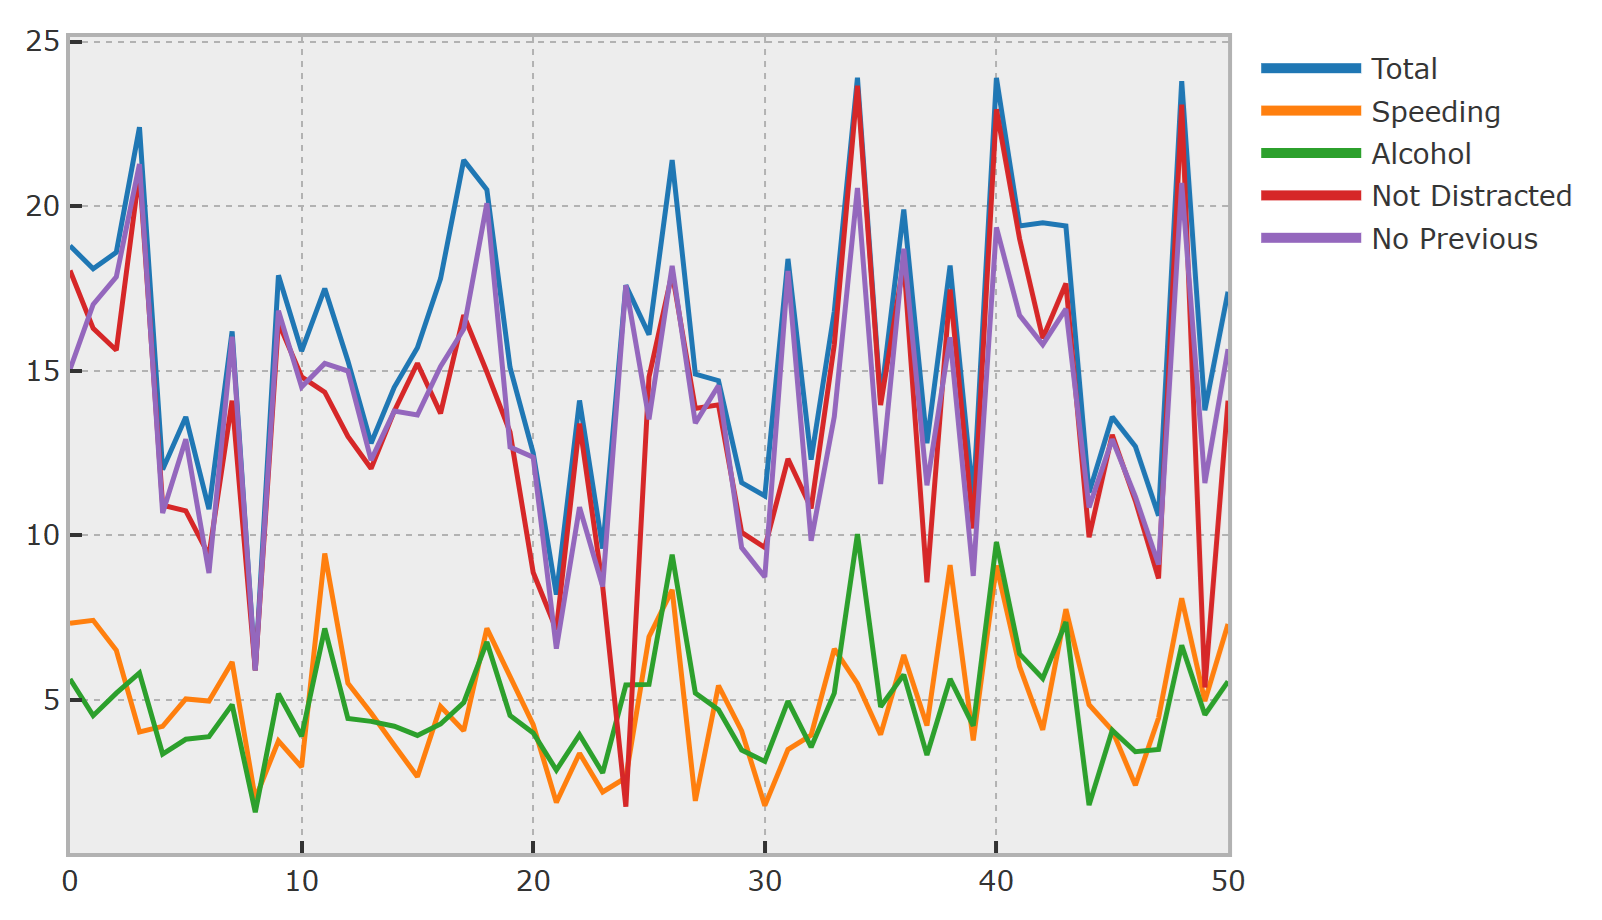
uplt is designed to be extensible. You can register plugins to visualize custom objects via plot() or scatter() functions.
E.g. if plugin for pd.DataFrame is registered, you can plot DataFrame columns directly:
import uplt
import pandas as pd

df = pd.read_csv('https://raw.githubusercontent.com/mwaskom/seaborn-data/master/car_crashes.csv')

fig = uplt.figure()
fig.plot(df[['total', 'speeding', 'alcohol']])
fig.show()
[!TIP] For detailed instructions on creating plugins, please see PLUGIN.md.
Dependencies
Python≥ 3.10NumPy≥ 1.21v2.0 supportedpillow≥ 10.3
Optional
matplotlib≥ 3.7plotly≥ 5.17
License
This software is licensed under the BSD-3-Clause license.
See the LICENSE file for details.


Download files
Download the file for your platform. If you're not sure which to choose, learn more about installing packages.
Source Distribution
Built Distribution
Filter files by name, interpreter, ABI, and platform.
If you're not sure about the file name format, learn more about wheel file names.
Copy a direct link to the current filters
File details
Details for the file uplt_py-0.9.1.tar.gz.
File metadata
- Download URL: uplt_py-0.9.1.tar.gz
- Upload date:
- Size: 3.0 MB
- Tags: Source
- Uploaded using Trusted Publishing? No
- Uploaded via: uv/0.6.13
File hashes
| Algorithm | Hash digest | |
|---|---|---|
| SHA256 |
3a3425bd8e2dcd91ae0e992d11bbe4b03c94ac0eae0469fcdf00809ac7cb474e
|
|
| MD5 |
953b6d0b3a1a1cf890a38da5804bae61
|
|
| BLAKE2b-256 |
c36a95972bf5fe7f0f3067587cfd4a18c16c600c205b349bb23036e192d1bc76
|
File details
Details for the file uplt_py-0.9.1-py3-none-any.whl.
File metadata
- Download URL: uplt_py-0.9.1-py3-none-any.whl
- Upload date:
- Size: 35.5 kB
- Tags: Python 3
- Uploaded using Trusted Publishing? No
- Uploaded via: uv/0.6.13
File hashes
| Algorithm | Hash digest | |
|---|---|---|
| SHA256 |
6d1721c318956fa30fecfb7d47896615e69ed220a61051e6bde6d53a9f7c3078
|
|
| MD5 |
6ceba8d758c18d6dfc7003bca4435269
|
|
| BLAKE2b-256 |
0c46141545b04929724f458cb42c4707516272e75464edc4cd3137d5e703722f
|


