
Upstrace



When a data quality check fails, trace it upstream to the change that caused it.
Upstrace profiles every column of a dbt project on every run, compares each day against its own history, walks the lineage graph to name the one node where a problem started, and asks an LLM to explain it in a sentence a human can act on.
Contents
- The problem it exists for
- How it works
- Tech stack
- Quick start — the demo, from zero
- Command reference
- Two ways to judge a value
- What the metrics mean
- The dashboard
- Run it on your own dbt project
- Configuration reference
- Slack alerts
- Environment variables
- How well does it work
- What it does not do
- Repo layout
The problem it exists for
A pipeline that crashes is not the expensive kind. The expensive kind is the one that succeeds.
An upstream vendor starts sending trip_distance in kilometres instead of miles.
Nothing is null. Nothing violates a constraint. Every dbt test passes, every
model builds green, and the number flows into three downstream marts, a
dashboard, and whatever decision someone makes on Monday morning. The failure is
silent, and by the time anyone notices, the question is not what broke but
where did this start — a question usually answered by an analyst reading SQL
for two hours.
Upstrace answers that question mechanically.
How it works
  dbt project
      │
      │  manifest.json  ────────────────┐
      ▼                                 │
  ┌────────────┐                        ▼
  │  profile   │  every column, whole-table AND per-day
  └─────┬──────┘  → upstrace_meta.column_profiles
        │           upstrace_meta.partition_profiles
        ▼
  ┌────────────┐
  │   drift    │  this run vs the previous run, per metric, per day
  └─────┬──────┘  → upstrace_meta.drift_signals
        │
        ▼
  ┌────────────┐
  │    rca     │  a node is a ROOT if it drifted and no ancestor drifted
  └─────┬──────┘  → incidents, each with evidence and blast radius
        │
        ▼
  ┌────────────┐
  │  explain   │  numbers + lineage → LLM → ranked hypothesis
  └────────────┘  (never the rows; cached by prompt hash)
Four steps, each doing one thing:
- Profile. For every column in every dbt node, record row count, null rate, distinct count, min, max and mean — both for the table as a whole and once per day. The per-day part is the difference between working and not; see the numbers below.
- Detect drift. Compare this run's profile to the previous one. A metric that moves more than its threshold becomes a signal, with severity scaled by how far past the threshold it went.
- Find the root. Read the dbt
manifest.json, build the lineage graph, and apply one rule: a node is a root cause if it drifted and none of its upstream nodes drifted. Everything downstream of a root is collateral. - Explain. Send the numbers and the lineage — never the rows — to an LLM and get back a ranked hypothesis with its reasoning and blast radius.
Tech stack
| Layer | Choice | Why |
|---|---|---|
| Warehouse | DuckDB or PostgreSQL | DuckDB is one file on disk, no server, no cost, fast enough to profile millions of rows in seconds. Postgres is the second dialect. Both run in CI on every push |
| Transformation | dbt (dbt-core 1.10, dbt-duckdb 1.9 / dbt-postgres 1.9) |
The lineage graph comes free inmanifest.json — that graph is what makes root-cause analysis possible at all |
| Profiling / detection | Python 3.10+, pandas, one dialect class per warehouse |
Profiles written as oneGROUP BY per column, inserted in bulk from a DataFrame |
| CLI | Typer + Rich | Subcommands,--help, formatted tables |
| Config | PyYAML (upstrace.yml) |
Nothing project-specific lives in Python |
| API | FastAPI + Uvicorn | One process serves JSON and the built SPA |
| Dashboard | React 18 + Vite | Hand-written SVG charts and lineage graph, no chart library |
| Alerting | Slack incoming webhooks (stdlib urllib) |
Root-cause summary in a channel, with no HTTP dependency added |
| LLM | Groq (qwen/qwen3.8-27b), with Gemini, Ollama and a mock provider |
Free tier, structured JSON output, responses cached by prompt hash and committed |
| Packaging | Hatchling, PyPI, Docker (two build targets) | pip install upstrace, or docker build --target runtime |
| Dataset | NYC TLC yellow taxi, Jan–Mar 2024 (9.5M rows) | Public, messy, and has real date grain |
Everything in this project runs on free tiers or on your own machine. There is no paid dependency anywhere.
Quick start — the demo, from zero
Prerequisites
- Python 3.10 or newer
- Node 18 or newer (only for the dashboard)
- git
- About 1.5 GB of free disk for the full dataset
1. Install
pip install upstrace
That is all you need to run Upstrace against your own dbt project — skip to Run it on your own dbt project.
The demo below needs this repo as well, because the demo pipeline and its data live here:
git clone https://github.com/ashg2099/upstrace
cd upstrace

python -m venv .venv
source .venv/bin/activate          # Windows: .venv\Scripts\activate

pip install -e .
pip install "dbt-core==1.10.*" "dbt-duckdb==1.9.*"
pip install -e . installs the package from your clone instead of PyPI, so your
edits take effect immediately. Check the command is on your PATH:
upstrace --help
2. Add an API key (optional)
Only needed for upstrace explain. Everything else works without it.
cp .env.example .env
Open .env and paste a free Groq key:
GROQ_API_KEY=gsk_...
UPSTRACE_LLM_PROVIDER=groq
UPSTRACE_LLM_MODEL=qwen/qwen3.8-27b
No key? Set UPSTRACE_LLM_PROVIDER=mock. The explanations already committed in
cache/llm/ still replay, because responses are cached by prompt hash.
3. Get the data
python scripts/download_data.py
Downloads three months of NYC taxi parquet files (~150 MB) into data/. Want a
different range:
python scripts/download_data.py 2024-04 2024-05
4. Load it into DuckDB
python scripts/load_duckdb.py
Creates warehouse/upstrace.duckdb with raw.yellow_trips — 9,554,778 rows —
and prints a hand-written data quality report. That report is the manual work
Upstrace automates; it is worth reading once to see how dirty the data already
is before anything is injected.
5. Build the dbt models
cd transform
dbt run --profiles-dir .
dbt test --profiles-dir .
cd ..
This builds four nodes on top of the source:
yellow_trips (source) → stg_trips (view) → fct_trips (table) → agg_daily_revenue
                                                             → agg_daily_quality
dbt run also writes transform/target/manifest.json, which is where Upstrace
reads the lineage from. Nothing works before this step.
Two dbt test failures are expected — they are real problems in the raw data,
kept rather than filtered.
6. Take a baseline
upstrace models        # what Upstrace can see
upstrace profile       # baseline
upstrace profile       # current
upstrace drift         # should say: nothing moved
Drift always compares the two most recent profile runs, so you need at least two. Two runs over unchanged data must produce zero signals — if they do not, something is non-deterministic, which is exactly the bug the negative controls later caught.
7. Break something on purpose
upstrace fault unit-change
trip_distance silently switches from miles to kilometres in the source, and the
whole pipeline is rebuilt. dbt reports success. That is the point.
upstrace profile
upstrace drift
upstrace rca
upstrace explain
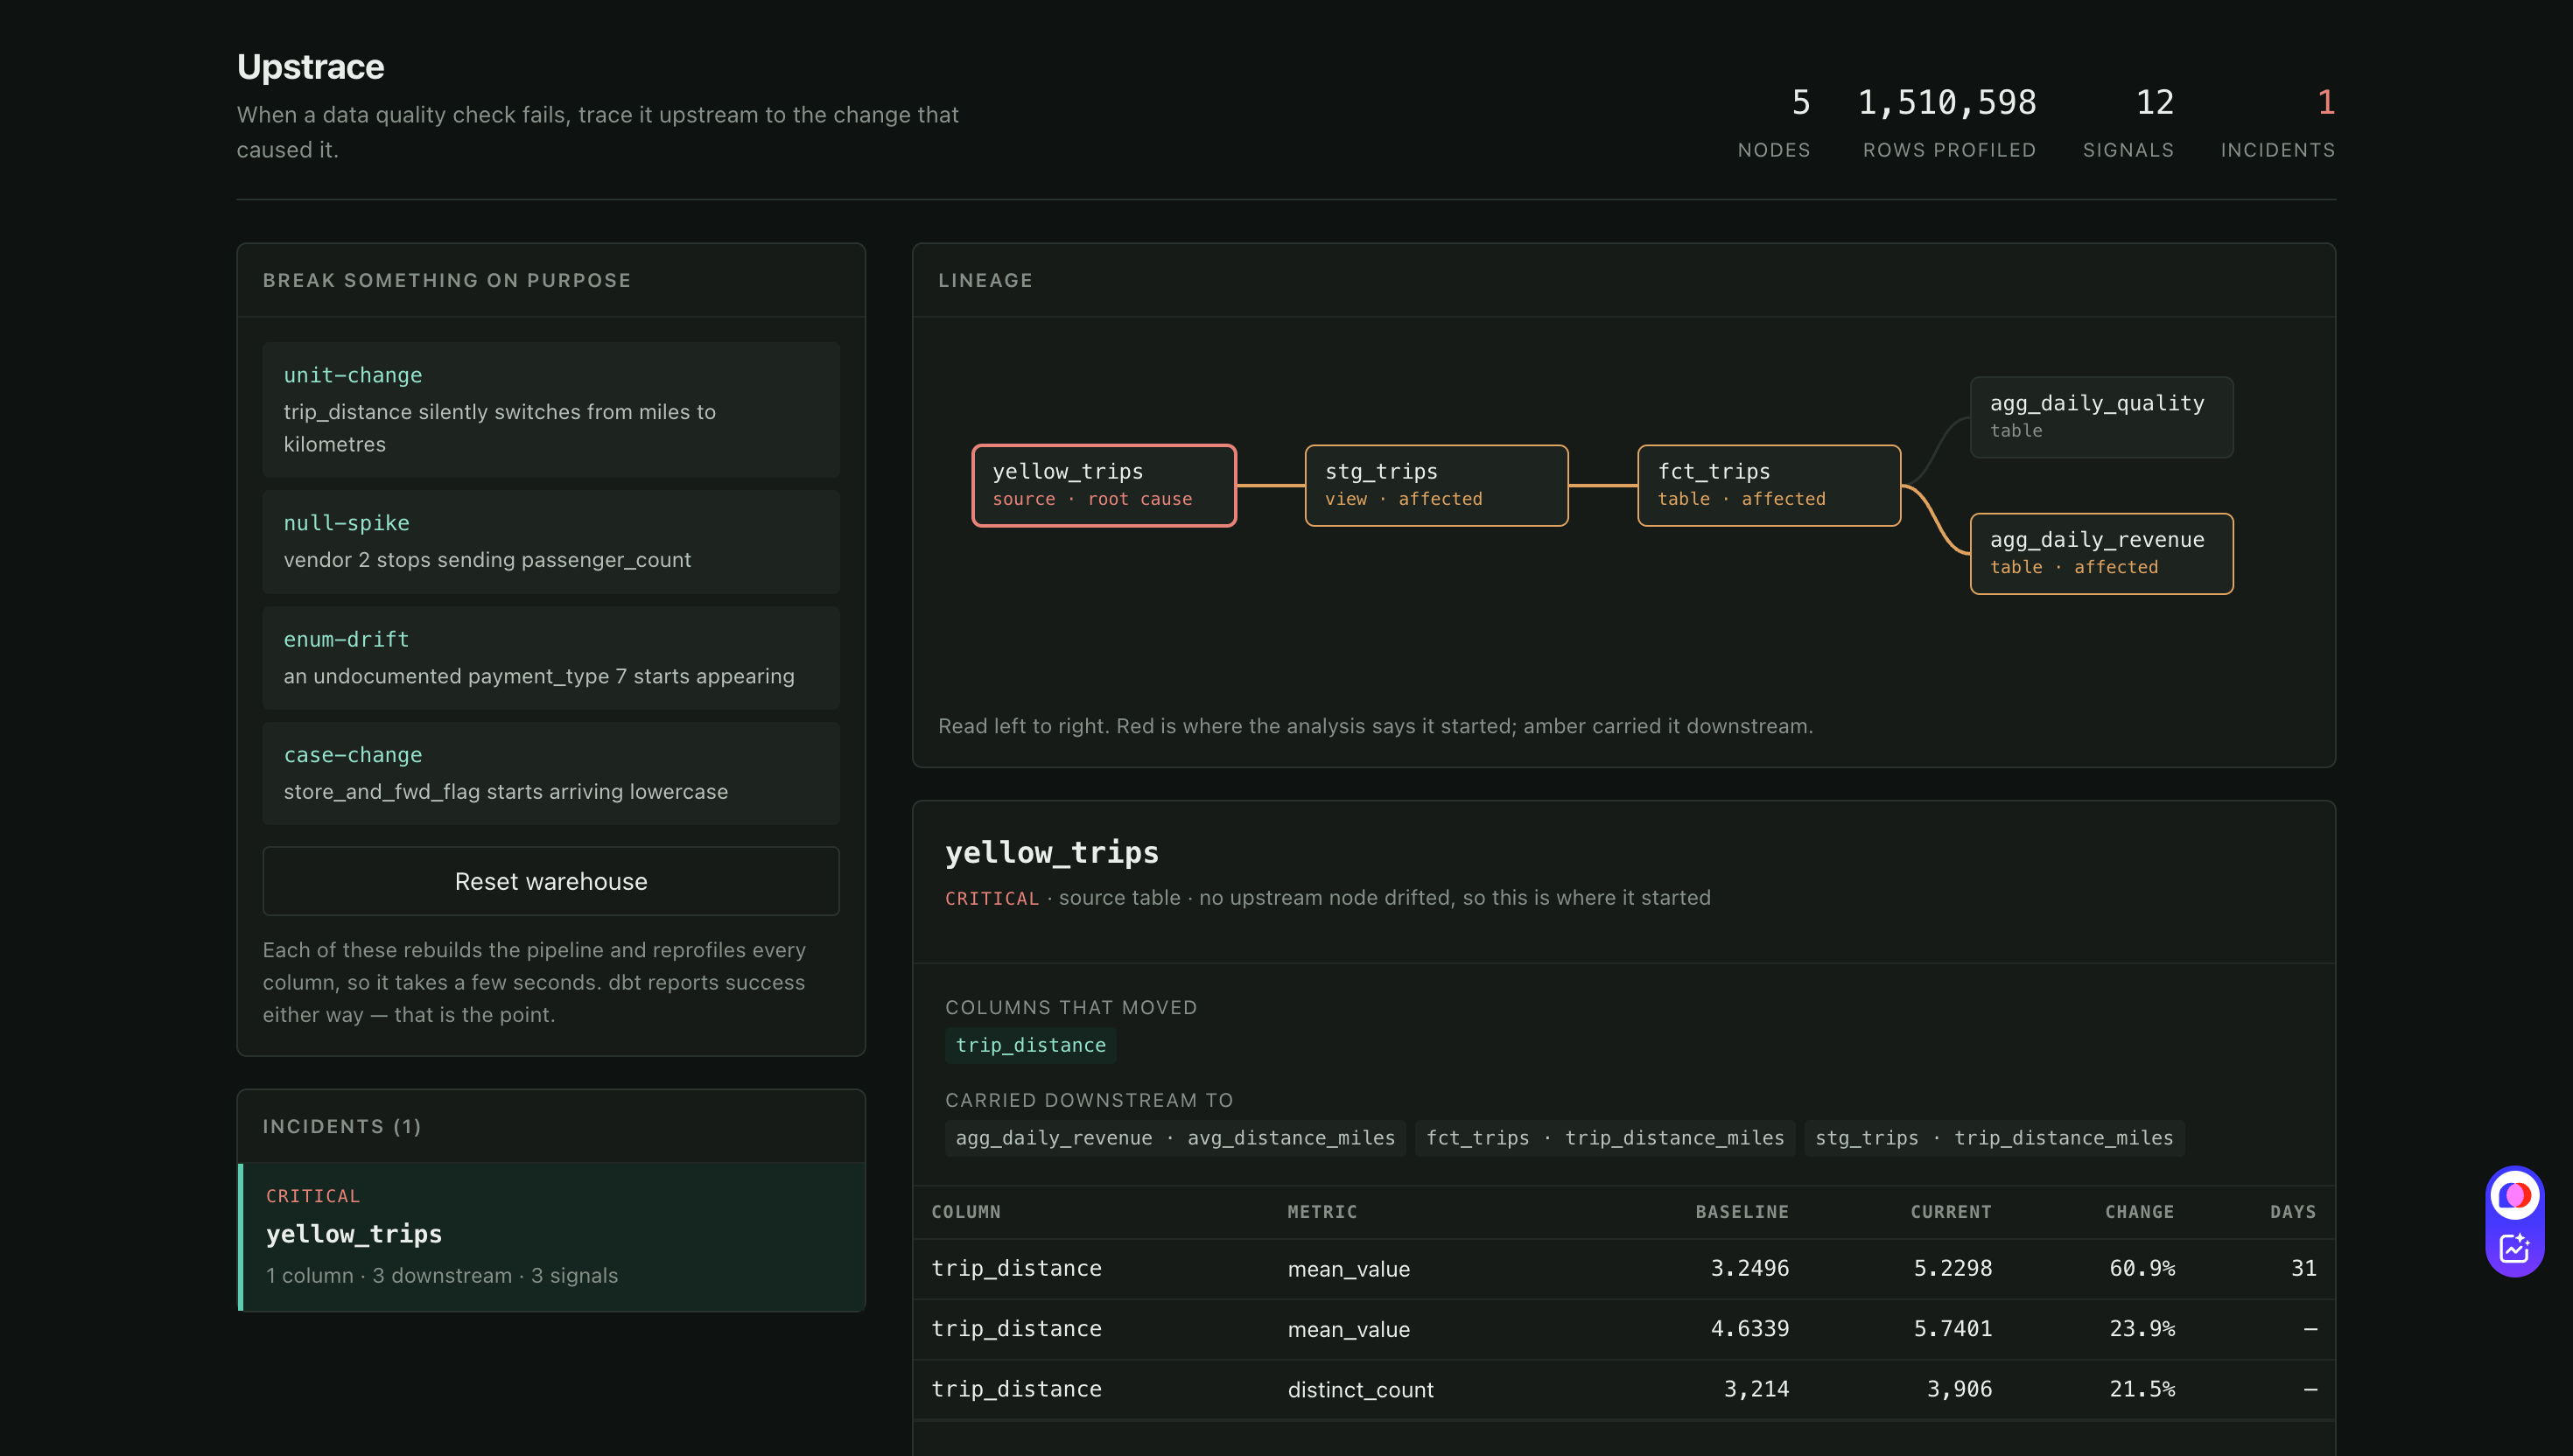
What comes back:
yellow_trips   CRITICAL   source table
  no upstream node drifted, so this is where it started

  column          metric        baseline   current   change   days
  trip_distance   mean_value      3.2496    5.2298    60.9%     31
  trip_distance   mean_value      4.6339    5.7401    23.9%      -
  trip_distance   distinct_count   3,214     3,906    21.5%      -

  carried downstream to
    stg_trips.trip_distance_miles
    fct_trips.trip_distance_miles
    agg_daily_revenue.avg_distance_miles
Two rows for the same metric, and the difference between them is the whole argument for per-partition profiling. The whole-table mean moved 23.9% — suspicious, but not obviously anything. The per-day mean on the 31 affected days moved 60.9%, a ratio of 1.6094. The true miles-to-kilometres factor is 1.60934. Diluting a fault across 500,000 rows hides its signature; measuring each day against itself preserves it.
8. Put it back
upstrace fault reset
9. What the model says
The LLM sees the evidence table and the lineage. It never sees a single row.
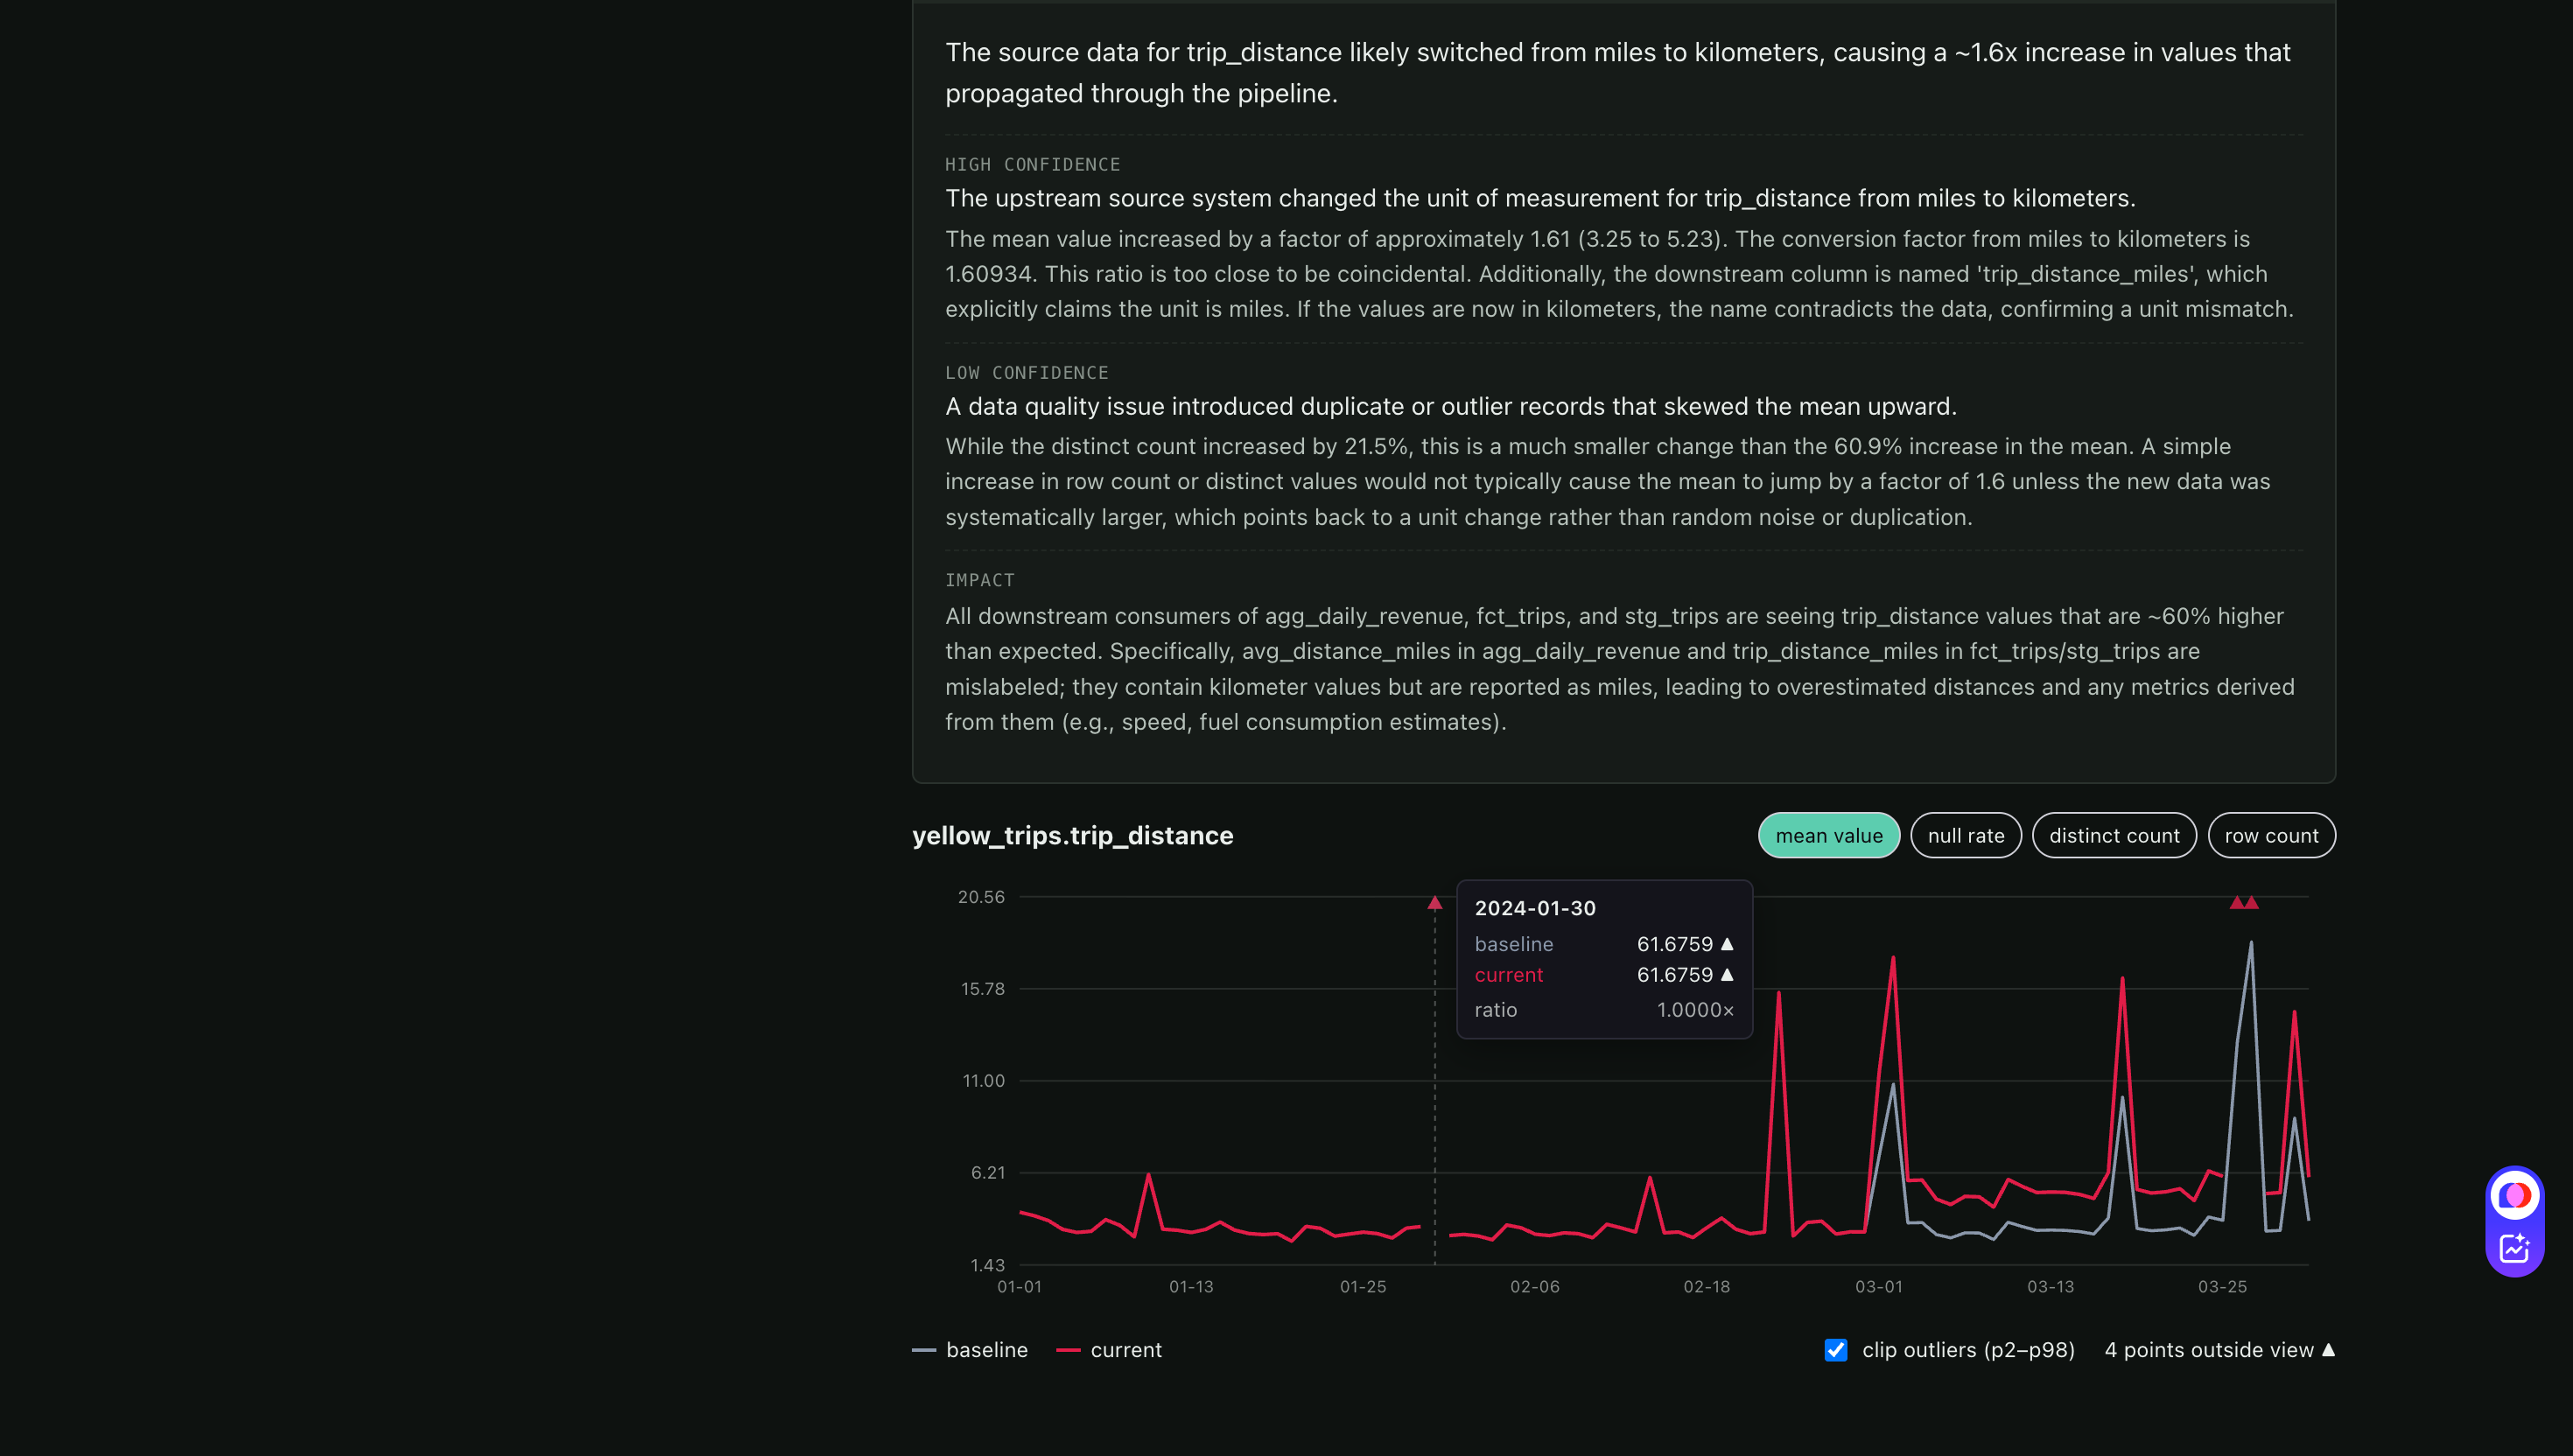
The source data for trip_distance likely switched from miles to kilometers, causing a ~1.6x increase in values that propagated through the pipeline.
HIGH CONFIDENCE — The upstream source system changed the unit of measurement for trip_distance from miles to kilometers. The mean value increased by a factor of approximately 1.61 (3.25 to 5.23). The conversion factor from miles to kilometers is 1.60934. This ratio is too close to be coincidental. Additionally, the downstream column is named
trip_distance_miles, which explicitly claims the unit is miles. If the values are now in kilometers, the name contradicts the data, confirming a unit mismatch.LOW CONFIDENCE — A data quality issue introduced duplicate or outlier records that skewed the mean upward. While the distinct count increased by 21.5%, this is a much smaller change than the 60.9% increase in the mean. A simple increase in row count or distinct values would not typically cause the mean to jump by a factor of 1.6 unless the new data was systematically larger, which points back to a unit change rather than random noise or duplication.
IMPACT — All downstream consumers of agg_daily_revenue, fct_trips, and stg_trips are seeing trip_distance values that are ~60% higher than expected. Specifically, avg_distance_miles in agg_daily_revenue and trip_distance_miles in fct_trips/stg_trips are mislabeled; they contain kilometer values but are reported as miles, leading to overestimated distances and any metrics derived from them (e.g., speed, fuel consumption estimates).
The column name used as evidence, and the explicit rejection of the alternative hypothesis, are what make this worth more than a threshold alert.
Command reference
Every command takes --help.
upstrace models     List the dbt models Upstrace can see, and what each depends on.
upstrace profile    Measure every column of every model and append to the metric history.
upstrace history    Show how one column's measurements have moved across runs.
upstrace fault      Break the raw data on purpose, or put it back.
upstrace drift      Compare the two most recent profile runs and report what moved.
upstrace rca        Turn the drift signals from the latest run into root causes.
upstrace explain    Ask a language model what the root-cause incidents actually mean.
upstrace eval       Inject every seeded defect in turn and score the root-cause analysis.
upstrace init       Write a starter upstrace.yml in the current directory.
upstrace config     Show the resolved configuration and where it came from.
upstrace report     Write a self-contained HTML report of the latest analysis.
upstrace slack-test Send a dummy message to confirm a Slack webhook works.
upstrace init / upstrace config
upstrace init                 # writes upstrace.yml here
upstrace init --force         # overwrite an existing one
upstrace config               # what resolved, and which file it came from
config is the first thing to run when something looks wrong. If it prints
(defaults, no upstrace.yml found), you are in the wrong directory —
configuration is discovered by walking up from the working directory, the way git
finds .git.
upstrace models
Lists every node from the manifest with its dependencies. Empty output means the
manifest is missing (run dbt run first) or include/exclude filtered
everything out.
upstrace profile
upstrace profile              # every included node
upstrace profile -m fct_trips # one model only
Writes one whole-table row per column and one row per column per day into
upstrace_meta. Prints the run id and how many profiles it wrote. Run it twice
before drift — comparison needs two runs.
upstrace history
upstrace history -m yellow_trips -c trip_distance
Both flags are required. Shows how that one column's metrics have moved across every recorded run — the CLI version of the dashboard's metric chart.
upstrace fault
upstrace fault list                          # what can be injected
upstrace fault unit-change                   # inject, from 2024-03-01 onward
upstrace fault null-spike --since 2024-02-15 # inject from a different date
upstrace fault reset                         # put the raw data back
| Key | What it simulates |
|---|---|
unit-change |
trip_distance silently switches from miles to kilometres |
null-spike |
vendor 2 stops sendingpassenger_count |
enum-drift |
an undocumentedpayment_type 7 starts appearing |
case-change |
store_and_fwd_flag starts arriving lowercase |
reset |
rebuild the pipeline from the untouched source |
--since defaults to 2024-03-01, so a fault touches the last 31 days of the
three-month dataset. That is where the days 31 column in the evidence table
comes from — and shrinking the window is how the benchmark builds its
one-week and one-day scenarios, which are the hard ones.
Injection changes the raw table only — rebuild with dbt yourself afterwards, and watch it report success either way. The dashboard's fault buttons rebuild and reprofile in one step; the CLI leaves that to you so you can see dbt pass.
upstrace drift
upstrace drift                        # report only
upstrace drift --baseline rolling     # override the configured baseline mode
upstrace drift --fail-on critical     # exit 1 if any critical signal
upstrace drift --fail-on warning      # exit 1 if anything at all moved
upstrace drift --slack-on warning     # also post to Slack
Compares the two most recent profile runs, writes signals to
upstrace_meta.drift_signals, and prints them worst-first. Two runs over
unchanged data must print No drift above threshold.
--fail-on is what makes this usable in CI. Without an exit code the job is
green whatever the tool found, and "monitoring" means someone remembering to
read logs.
It also warns when the two runs measured very different row volumes — comparing a 500k-row sample against a 9.5M-row load makes every metric look like it moved, and the tool would otherwise report that nonsense confidently.
--slack-on posts the run to Slack at or above a severity. It is independent of
--fail-on, and alerts are sent before the exit-code check — so a run that
fails CI still notifies. See Slack alerts.
upstrace rca
Groups the latest run's signals into incidents and names a root for each, using one rule: a node is a root if it drifted and none of its upstream nodes drifted. Prints the evidence and the downstream columns the change was carried into.
upstrace explain
upstrace explain              # uses the cached response if the prompt matches
upstrace explain --no-cache   # force a fresh model call
Sends the evidence table and the lineage — never the rows — to the configured LLM. Responses are cached on disk by prompt hash, so the same incident always produces the same explanation and the committed cache replays without a key.
upstrace eval
upstrace eval                                          # 56 scenarios + 4 controls
upstrace eval --limit 3                                # quick check
upstrace eval --sample 100000                          # faster, smaller baseline
upstrace eval --sample 500000 --report docs/eval-results.md
| Flag | Default | Meaning |
|---|---|---|
--sample |
500000 |
Rows to sample per run. The sample is seeded andREPEATABLE, so runs are comparable |
--limit |
all | Run only the first N scenarios |
--report |
docs/eval-results.md |
Where to write the markdown report |
A full run takes roughly 15 minutes at --sample 500000. It resets to a clean
baseline before every scenario, so it is safe to interrupt.
--reportoverwrites its target. Commit the previous report before rerunning with a smaller--limitor--sample, or you will replace a full result with a partial one.
Two ways to judge a value
A metric moved — compared to what? Upstrace supports two baselines.
previous_run (default) compares each partition against its own value in the
previous profile run. It is exact, needs no history, and catches a change the
moment it appears. It cannot see a fault that was already in place before you
started profiling — that value simply becomes "normal".
rolling compares each partition against a trailing window of its own
history using a median/MAD robust z-score, so one bad day does not move the bar.
A signal must clear both the statistical test and the configured practical
threshold, so a 0.4% move on a very stable column is not called an incident.
baseline:
  mode: rolling             # or previous_run
  window: 28                # trailing partitions to compare against
  z: 3.5                    # robust z-score threshold
  min_history: 14           # skip a partition with less history than this
  min_partition_share: 0.2  # skip partitions far smaller than the window median
Or per run: upstrace drift --baseline rolling.
Rolling is experimental. On clean taxi data it surfaced real anomalies
nothing had planted — stray rows dated 2002, 2008, 2009 and 2023, a snowstorm on
2024-02-13, and a source-format change on 2024-02-15 — none of which
previous_run can structurally see. But it shares a weakness with every
trailing-window method: a fault in place for the whole window becomes the
baseline. Catching that needs changepoint detection over the full history,
tracked in #1.
What the metrics mean
Six metrics are recorded per column, per run, and per day.
| Metric | What it is | How change is measured | Default threshold |
|---|---|---|---|
row_count |
rows in the table (or in that day) | relative:abs(new − old) / old |
2% |
null_rate |
fraction of values that are null | absolute, in percentage points | 1 pp |
distinct_count |
exact count of distinct values | relative | 10% |
mean_value |
average, numeric columns only | relative | 5% |
min_value |
smallest value, as text | any change at all | — |
max_value |
largest value, as text | any change at all | — |
null_rate is absolute on purpose. A relative change from 0.001 to 0.002 is
100% and means nothing; a move from 0.1% to 1.1% is one percentage point and
means a vendor stopped sending a field.
min_value and max_value are reported with their actual values, not just as
"changed" — a move from 'casual' to 'Casual' is a diagnosis, while "changed"
is a shrug. They are the one place Upstrace handles real cell values rather than
metrics, so profile.mask_values withholds them for columns that should never
leave the warehouse.
distinct_count is counted exactly, and floats are rounded to six decimals
first. Both choices are explained in determinism.
Severity
A signal's severity comes from how far past its threshold it went:
| Severity | Trigger |
|---|---|
warning |
at or past 1× the threshold |
high |
at or past 2× |
critical |
at or past 5× |
Both the thresholds and these multipliers are configurable per node.
Where it is all stored
Everything Upstrace records lives in an upstrace_meta schema inside the
warehouse it is watching, the DuckDB file, or the Postgres database, so it is
queryable with plain SQL alongside your own tables:
| Table | Contents |
|---|---|
profile_runs |
one row per run: id, start, end, node count |
column_profiles |
one row per column per run — whole-table metrics |
partition_profiles |
one row per columnper day per run |
drift_signals |
every signal, with baseline, current, change, severity, and how many days moved |
-- what moved most in the latest run
SELECT model_name, column_name, metric, change, severity, partitions
FROM upstrace_meta.drift_signals
ORDER BY change DESC
LIMIT 10;
The dashboard
Development (two processes, hot reload)
# terminal 1 - API
uvicorn upstrace.api:app --reload --reload-dir src

# terminal 2 - SPA
cd app && npm install && npm run dev
Open the URL Vite prints (usually http://localhost:5173). It proxies /api to
port 8000.
Single process
cd app && npm run build && cd ..
uvicorn upstrace.api:app --port 8000
FastAPI serves the built SPA from app/static. Open http://localhost:8000.
Interactive API docs at /api/docs.
Four views
- Incident feed and RCA detail — every incident, its root node, the columns that moved, the evidence table, and where the change was carried downstream
- Lineage graph — read left to right; red is where the analysis says it started, amber is what carried it
- Metric history — per-day baseline and current overlaid, with metric tabs and a hover tooltip showing the ratio. The y-axis clips to p2–p98 and marks what falls outside; one freak day in the taxi data reaches 61.7 and would otherwise flatten the step change the chart exists to show
- Fault panel — inject a fault live and watch the incident appear
Demo order matters: press Reset warehouse first, then inject. Resetting after injecting would show the repair itself as drift.
API endpoints
| Method | Path | Returns |
|---|---|---|
| GET | /api/health |
liveness |
| GET | /api/overview |
node count, rows profiled, signal count, incident count |
| GET | /api/lineage |
nodes and edges, each flagged root / affected / clean |
| GET | /api/incidents |
every incident with its severity and summary |
| GET | /api/incidents/{root}?explain=true |
one incident, optionally with the LLM explanation |
| GET | /api/metrics/{model}/{column}?metric=mean_value |
per-day baseline and current series |
| GET | /api/faults |
the faults available to inject |
| POST | /api/faults/{key} |
inject a fault, rebuild, reprofile, re-analyse |
| POST | /api/reset |
restore the clean baseline |
Run it on your own dbt project
The engine names no table and no dataset. It reads whatever dbt manifest you point it at.
Requirements: a dbt project on DuckDB or PostgreSQL, and at least one date or timestamp column on the tables you care about.
1. Install Upstrace
pip install upstrace
2. Build your own project once
Upstrace reads target/manifest.json, which only exists after a dbt build:
cd /path/to/your-dbt-project
dbt run
3. Create a config
upstrace init
This writes upstrace.yml in the current directory. Open it and set the two
settings that matter:
project: my-project
warehouse: ./warehouse/analytics.duckdb   # your .duckdb file
dbt_project_dir: .                        # where dbt_project.yml lives
On Postgres, name the dialect and give a connection string in place of a path:
project: my-project
dialect: postgres
warehouse: postgresql://user:password@host:5432/database
dbt_project_dir: .
Paths resolve relative to upstrace.yml itself, so relative ones are fine. A connection string is left alone. Full walkthrough: docs/postgres.md.
4. Check what resolved
upstrace config
upstrace models
upstrace config prints which file it read and every resolved value. If it says
(defaults, no upstrace.yml found), you are in the wrong directory —
configuration is discovered by walking up from the working directory, the way git
finds .git.
upstrace models should list your nodes. If it is empty, the manifest is missing
or include/exclude filtered everything out.
5. Profile twice, then look
upstrace profile      # baseline
# ... let real changes happen, or run your pipeline again ...
upstrace profile      # current
upstrace drift
upstrace rca
The first two runs over unchanged data should produce zero signals. If they do not, something in your pipeline is non-deterministic — which is itself worth knowing.
6. Tune it
Two things almost always need adjusting on a real project:
Which models to profile. Hundreds of models means slow runs and noise:
profile:
  include: ["stg_*", "fct_*", "agg_*"]
  exclude: ["*_scratch", "stg_pii_*"]
The partition axis. Auto-detection picks the first DATE column, else the
first TIMESTAMP. That is right often, and silently wrong sometimes — a table
whose first date column is customer_signup_date would be profiled along an
axis that means nothing:
profile:
  partition_column:
    fct_orders: order_date
    dim_customers: null      # null = skip per-day, whole-table only
Then re-run upstrace profile and check days in the drift output looks
sensible.
7. Thresholds
Start with the defaults. When a table alerts every day for no reason, override it rather than raising the global number:
thresholds:
  overrides:
    agg_marketing_events:
      row_count: 0.40      # this table genuinely swings 40% day to day
With Docker instead
docker build --target runtime -t upstrace .
docker run -v "$PWD":/project -w /project -p 7860:7860 upstrace
The runtime target contains the tool and no data. The demo target — the
default if you build without --target — bakes in a 400,000-row sample and
builds its own warehouse, so docker run -p 7860:7860 <image> gives a working
demo with nothing to set up.
Warehouses
Upstrace runs on DuckDB and on PostgreSQL. Every expression that differs between
them — DESCRIBE versus information_schema.columns, float rounding, bulk
insert, parameter style — lives in src/upstrace/dialect.py behind a
seven-method interface. Nothing else in the codebase knows which warehouse it is
talking to.
Both are exercised by the same workflow on every push: profile twice over unchanged data and assert silence, then inject a unit change into the source and assert that the source is named as the root cause — not merely that something drifted. On Postgres that fault raises 22 signals and 21 of them are downstream, so asserting the root is the only check that would catch a broken lineage rule.
PostgreSQL
pip install "upstrace[postgres]"
Then in upstrace.yml:
dialect: postgres
warehouse: postgresql://user:password@localhost:5432/analytics
That is the entire change. Every command behaves the same:
upstrace models
upstrace profile
upstrace drift
upstrace rca
upstrace config masks the password, so its output is safe to paste into an
issue or a screenshot.
A complete worked example — a dbt project, a deterministic 90-day seed, and a
fault to inject — lives in postgres-demo/. See
docs/postgres.md for how to run it.
Adding another warehouse
Subclass Dialect in dialect.py, implement the seven abstract methods, and
register it in get_dialect(). Nothing outside that file changes. The DuckDB
and Postgres classes are about sixty lines each and sit side by side as
reference.
Configuration reference
Every key in upstrace.yml, with its default:
# Name shown by `upstrace config`. Cosmetic.
project: my-project

# Which SQL dialect to speak: duckdb (default) or postgres.
dialect: duckdb

# Where the data lives. On DuckDB this is a path to the database file and a
# relative path resolves against this config file. On Postgres it is a
# connection string, and `upstrace config` masks the password when printing it.
warehouse: warehouse/upstrace.duckdb

# Directory containing dbt_project.yml. The manifest is read from
# <dbt_project_dir>/target/manifest.json
dbt_project_dir: transform

# Where source parquet lives, for the demo scripts only.
data_dir: data

# Schema Upstrace writes its own tables into.
metrics_schema: upstrace_meta

profile:
  # Glob patterns matched against dbt node names. Exclude wins over include.
  include: ["*"]
  exclude: []

  # Per-day profiling axis.
  #   omitted  -> auto-detect (first DATE column, else first TIMESTAMP)
  #   a column -> use that column
  #   null     -> no per-day profiling for this node
  partition_column: {}

  # Refuse per-day profiling above this many distinct partitions. Guards against
  # a column that looks date-like but is effectively unique.
  max_partitions: 400
  # Columns whose min/max values must never leave the warehouse. min_value and
  # max_value are real cell values - the smallest value in an email column is a
  # real email address. Matched columns report <masked> instead.
  mask_values: []

thresholds:
  # Relative change, except null_rate which is absolute percentage points.
  default:
    row_count: 0.02
    null_rate: 0.01
    distinct_count: 0.10
    mean_value: 0.05

  # Per-node overrides, glob-matched, merged over the defaults.
  overrides: {}

baseline:
  # previous_run compares a partition to its own value in the last run.
  # rolling compares it to a trailing window of its own history.
  mode: previous_run
  window: 28
  z: 3.5
  min_history: 14
  min_partition_share: 0.2

# Multipliers of the threshold at which each severity begins.
severity:
  warning: 1.0
  high: 2.0
  critical: 5.0
Slack alerts
Upstrace can post a run's incidents to a Slack channel.
- Create an incoming webhook for the channel you want.
export UPSTRACE_SLACK_WEBHOOK='https://hooks.slack.com/services/...'upstrace slack-test— confirms the webhook before you rely on it.
Then any drift run posts automatically:
upstrace drift --slack-on warning --report-url https://you.github.io/upstrace/
The message leads with the root cause and its blast radius, then the evidence behind it — not a flat list of every correlated signal:
🔴 Upstrace: 1 root cause, 15 signals
Root cause —
yellow_trips(source) ·trip_distance→ 3 downstream: agg_daily_revenue, fct_trips, stg_trips
That distinction is the point. Fifteen alerts across four models read as four problems; one root with a blast radius reads as one.
--slack-on takes critical, high or warning, and is independent of
--fail-on: CI can alert on warnings while only failing the build on criticals.
Alerts fire before the exit-code check, so a failing run still notifies.
The notifier uses only the standard library, so alerting adds no dependency.
--report-url adds an Open report button pointing at a published
upstrace report output.
This repo's own nightly workflow deliberately does not post to Slack: it injects a fault every night on purpose, and a channel that cries wolf nightly is the exact failure mode this tool exists to prevent.
On a schedule
Upstrace has no scheduler — whatever runs your pipeline runs it. Add
upstrace profile && upstrace drift --slack-on warning after dbt run and
alerts arrive whenever that pipeline does.
A clean run posts nothing at all: the notifier returns without sending when no signal meets the threshold. The channel stays quiet until something actually moves, which is the only way an alert channel survives a month.
From cron, use a wrapper script and set everything explicitly — cron does not load your shell profile, so a job that works in your terminal will silently do nothing at 6am:
#!/usr/bin/env bash
set -euo pipefail
cd /srv/analytics && source .venv/bin/activate
export UPSTRACE_SLACK_WEBHOOK='https://hooks.slack.com/services/...'
dbt run && upstrace profile && upstrace drift --slack-on warning
In GitHub Actions, schedule.cron is UTC — 06:00 IST is 30 0 * * *. In
Airflow, a BashOperator downstream of the dbt task: with --fail-on critical
the task turns red and the channel gets the root cause, from one command.
Environment variables
Configuration lives in upstrace.yml; secrets and overrides live in the
environment (or .env, which is gitignored).
LLM responses are cached on disk under cache/llm/, keyed by a hash of the
prompt. The cache is committed, so every explanation in this repo reproduces
without a key. Change the prompt or the evidence and the hash changes, so a cache
hit always means the same question.
| Variable | Purpose |
|---|---|
GROQ_API_KEY |
API key for the Groq provider |
UPSTRACE_LLM_PROVIDER |
groq, gemini, ollama or mock |
UPSTRACE_LLM_MODEL |
model id, e.g.qwen/qwen3.8-27b |
UPSTRACE_CONFIG |
path to a specificupstrace.yml, skipping discovery |
UPSTRACE_WAREHOUSE |
override the warehouse path |
UPSTRACE_DBT_PROJECT_DIR |
override the dbt project path |
UPSTRACE_METRICS_SCHEMA |
override the metadata schema name |
UPSTRACE_BASELINE_MODE |
previous_run or rolling, overriding upstrace.yml |
UPSTRACE_SLACK_WEBHOOK |
Slack incoming-webhook URL for alerts |
UPSTRACE_DEMO_SAMPLE |
rows the dashboard's reset button loads (demo only) |
How well does it work
Claims about detection are cheap. This one is measured by a harness that injects known faults and checks whether the reported root cause is the node that was actually broken.
56 fault scenarios across four axes — fault type (unit change, fare inflation, null spike, enum drift, row drop, case change, precision loss, flag logic break, mart scaling), magnitude (small / medium / large), time window (one day / one week / one month) and layer (source / model) — plus 4 negative controls.
| Drift detected | 56 / 56 |
| Correct root node | 55 / 56 |
| Correct column | 55 / 56 |
| Fully correct | 55 / 56 (98%) |
| False positives on controls | 0 / 4 |
Aggregate results: docs/eval-results.md. Per-scenario rows are printed by upstrace eval as it runs — the report file holds the totals, not the individual scenarios.
Model comparison: docs/model-comparison.md.
Verified on a second dataset
The benchmark above runs on the taxi data. To test the claim that the engine is dataset-agnostic, it was pointed at a Citi Bike dbt project it had never seen — different schema, different domain, a separate warehouse and config. It ran first attempt, produced zero signals on two identical runs, and named the correct root cause for an injected fault.
It also found a real bug that 56 taxi scenarios could not:
docs/second-dataset.md.
Why per-partition profiling was necessary
The first working version profiled whole tables only. It scored 44/56, and every single failure named a downstream aggregate rather than the source. The reason was dilution: a fault confined to one day of ninety barely moves a table-wide mean, but it moves a small aggregate table hard, so the aggregate looked like the origin.
| whole-table only | per-partition | |
|---|---|---|
| All scenarios | 44 / 56 | 55 / 56 |
| One-day window only | 9 / 17 | 17 / 17 |
The one-day scenarios are the honest test — they are the ones a whole-table average is designed to miss.
The negative controls, and the bug they found
Four scenarios inject nothing, or something deliberately below threshold:
control-null— the pipeline is rebuilt and reprofiled with no change at allcontrol-subthreshold-tip— tips up 3%, under the 5% mean thresholdcontrol-subthreshold-extra— extras up 2%control-subthreshold-tip-near-limit— tips up 4.5%, just under the line
A control passes only if it raises no high or critical signal. When they were
added, control-null failed: three high-severity signals on a run where
nothing had changed.
The cause was real and worth writing down. Distinct counts were computed with
approx_count_distinct, a HyperLogLog estimate that varied by up to 30% between
identical runs. Compounding it, sum() and avg() run in parallel and
floating-point addition is not associative, so two mathematically equal groups
could differ in their last bits and change which values counted as distinct. The
fix was to count exactly, and to round floats first:
def _distinct_expr(col: str, data_type: str) -> str:
    if _is_float(data_type):
        return f"count(distinct round({col}, 6))"
    return f"count(distinct {col})"
Two identical runs now produce zero signals. Fifty-six fault scenarios never caught this; one negative control did — which is the argument for having them.
The one that fails
fare-inflation-small-day — a 3% fare increase on a single day out of ninety.
Drift is detected, but the root is reported as agg_daily_quality rather than
yellow_trips. On that day the source column's own movement stayed just under
threshold while a downstream aggregate amplified it, so the rule that defines a
root — drifted, with no drifted ancestor — legitimately named the aggregate. It
is documented rather than tuned away, because moving the threshold to catch it
would cost false positives elsewhere.
One more thing worth knowing
Partition profiles were originally inserted row by row with executemany: 8.2
seconds for 1,729 rows, growing with table size, and slow enough to time the
benchmark out. Building a DataFrame and running one
INSERT INTO ... SELECT * FROM frame brought it to 0.01 seconds.
What it does not do
Stated plainly, because scope questions get asked:
- dbt is required. Lineage comes from
manifest.json. Without it there is no basis for root-cause analysis, only alerts. - Cannot detect a fault that predates its baseline.
previous_runcompares against the last run androllingagainst a trailing window, so a defect that was already there before either window began reads as normal. Changepoint detection over the full history is the fix, and is not built. - No seasonality model.
previous_runuses fixed per-table thresholds;rollinguses a robust z-score but knows nothing about weekday/weekend or holiday effects, so it will flag a quiet Sunday on a weekday-shaped table. - No scheduler of its own. Profiling runs when something runs it. The
intended production shape is a step after
dbt runin CI or Airflow — see running it on a schedule..github/workflows/nightly.ymldoes exactly that against the demo data every night. - Two warehouses, not all of them. DuckDB and PostgreSQL are supported and
both run in CI on every push. Snowflake, BigQuery and Redshift are not. Every
warehouse-specific expression lives in
dialect.py, so adding one means implementing seven methods in that one file — but nobody has written them. - The dashboard is DuckDB-only. The FastAPI app (
uvicorn upstrace.api:app) reads DuckDB directly rather than going through the dialect layer, and returns a 503 saying so on a Postgres project.drift,rcaandreportwork on both. - The fault-injection benchmark is DuckDB-only. It is a test fixture built on
read_parquet, not part of the engine.
Repo layout
src/upstrace/        the engine - names no table, no dataset
  settings.py        upstrace.yml: paths, globs, thresholds, partition axis
  config.py          resolved paths, a thin façade over settings
  warehouse.py       connection handling and the upstrace_meta tables
  dialect.py         every expression that differs per warehouse, in one place
  manifest.py        read dbt manifest.json into nodes and edges
  profiler.py        whole-table and per-partition column profiles
  drift.py           threshold comparison and severity
  notify.py          Slack notifications - stdlib only
  report.py          the self-contained HTML report
  lineage.py         ancestors / descendants over the dbt graph
  rca.py             the root-cause rule
  llm.py             providers (groq / gemini / ollama / mock) + prompt-hash cache
  explain.py         the prompt
  faults.py          fault injection - the evaluation fixture
  scenarios.py       56 faults + 4 negative controls
  evaluate.py        the harness and its scoring
  api.py             FastAPI: JSON API + SPA
  cli.py             every upstrace command

transform/           the demo dbt project - staging and marts over NYC taxi data
postgres-demo/       the same shape on Postgres - seed, models, and a fault to inject
app/                 React + Vite dashboard
scripts/             data download, warehouse load, demo sample, Docker build
cache/llm/           committed LLM responses, keyed by prompt hash
docs/                eval results, model comparison, the Postgres guide, screenshots
upstrace.yml         configuration for the demo project
Dockerfile           two targets: runtime (tool only), demo (tool + data)
.github/workflows/   ci: both dialects on every push. nightly: self-check + Pages
transform/, faults.py and scenarios.py are the demo pipeline and the
evaluation fixture. The engine never references them.
Data
NYC TLC yellow taxi trip records,
January–March 2024 — 9.5M rows. A 400,000-row reservoir sample spanning 91 days
is committed under data/demo/ so the Docker image can build its own warehouse
without downloading anything.
License
MIT
1 maintainer

Release files for upstrace 0.2.0
For a detailed explanation of source distributions (sdists) and built distributions (wheels), please see the package formats documentation.
Source distribution (sdist)
| File | Size | Uploaded | |
|---|---|---|---|
| upstrace-0.2.0.tar.gz | 81.5 kB | Details |
Built distribution (wheel)
| File | Interpreter | ABI | Platform | Reset |
|---|---|---|---|---|
| upstrace-0.2.0-py3-none-any.whl | Python 3 | none | any | Details |
Total release size: 156.4 kB
Release files / upstrace-0.2.0.tar.gz
| Download URL | upstrace-0.2.0.tar.gz |
|---|---|
| Size | 81.5 kB |
| Tags | Source |
|
SHA-256 checksum How to use checksums |
982a8f6ba0b07317d453c34e6c43d1042e8d9d45ee307cba46cb562220b083db
|
|
BLAKE2b-256 checksum How to use checksums |
85e6ea4748821b47066300769ec50ae2695a2456c0407114becacb6ba707969b
|
| Upload date | |
|
Uploaded using Trusted Publishing? What is trusted publishing? |
No |
| Uploaded via |
twine/7.0.0 CPython/3.10.11
|
Release files / upstrace-0.2.0-py3-none-any.whl
| Download URL | upstrace-0.2.0-py3-none-any.whl |
|---|---|
| Size | 74.8 kB |
| Tags | Python 3 |
|
SHA-256 checksum How to use checksums |
ade3c1b13e4da9c7778358c0b081a8efbdc1b773656c630aedc3f1ba02cc2f33
|
|
BLAKE2b-256 checksum How to use checksums |
856051930754d9ca4475589a341027838011912bd15ed04a864878c5a352471b
|
| Upload date | |
|
Uploaded using Trusted Publishing? What is trusted publishing? |
No |
| Uploaded via |
twine/7.0.0 CPython/3.10.11
|














