A Python visualization tool for genomic surveillance
Project description


VARGRAM (Visual ARrays for GRaphical Analysis of Mutations)
🧬 VARGRAM is a Python package that makes it easy to generate insightful figures for genomic surveillance, born out of our experience during the COVID-19 pandemic. Currently, VARGRAM supports generating mutation profiles straight from sequence files by hooking into existing tools such as Nextclade. The figures can be easily customized within a Python script or Jupyter notebook using a declarative syntax.
🔥 We are actively developing VARGRAM into a full visualization library for common use cases in molecular epidemiology. More modules will be added in the coming months. If you have a feature request or find a bug, please submit an issue.
Documentation
Full installation instructions and tutorials are available on the VARGRAM documentation website.
Installation
Install with pip:
pip install vargram
Python version ≥3.11 is required.
VARGRAM relies on Nextclade to perform mutation calling when sequence files are provided. Make sure to download the Nextclade CLI and add it to the path. You may also just provide Nextclade's analysis CSV output directly and VARGRAM can still produce a mutation profile without Nextclade installed.
Quickstart Guide
To produce a mutation profile, VARGRAM requires a single FASTA file (or a directory of FASTA files) of samples, a FASTA file for the reference, and a genome annotation file following the GFF3 format.
A mutation profile can be generated in just four lines of code:
from vargram import vargram # Importing the package

vg = vargram(seq='path/to/<samples-directory>', # Provide sample sequences
            ref='path/to/<reference.fa>', # Provide reference sequence
            gene='path/to/<annotation.gff>') # Provide genome annotation
vg.profile() # Tell VARGRAM you want to create a mutation profile
vg.show() # And show the resulting figure
Alternatively, you can simply provide a CSV file. For example, you can upload your sequences to the Nextclade web app and download the analysis CSV output. VARGRAM recognizes this output and can process it:
from vargram import vargram

vg = vargram(data='path/to/<nextclade_analysis.csv>') # Provide Nextclade analysis file
vg.profile()
vg.show()
Calling the mutation profile this way does not require Nextclade CLI to be installed.
Sample Output
Install VARGRAM and try out the following snippet, which will download test data for you. Nextclade CLI does not need to be installed for the following example:
# Import main VARGRAM module and module to download external data
from vargram import vargram
from vargram.data import example

# Download test data into test_data directory
example.get('test_data')

# Generate the mutation profile
vg = vargram(data='test_data/analysis/omicron_analysis_cli.tsv') # Provide data
vg.profile() # Tell VARGRAM you want to create a mutation profile
vg.show() # Show the figure
vg.save("default_profile.png", dpi=300) # Save the figure
This will produce the following figure:
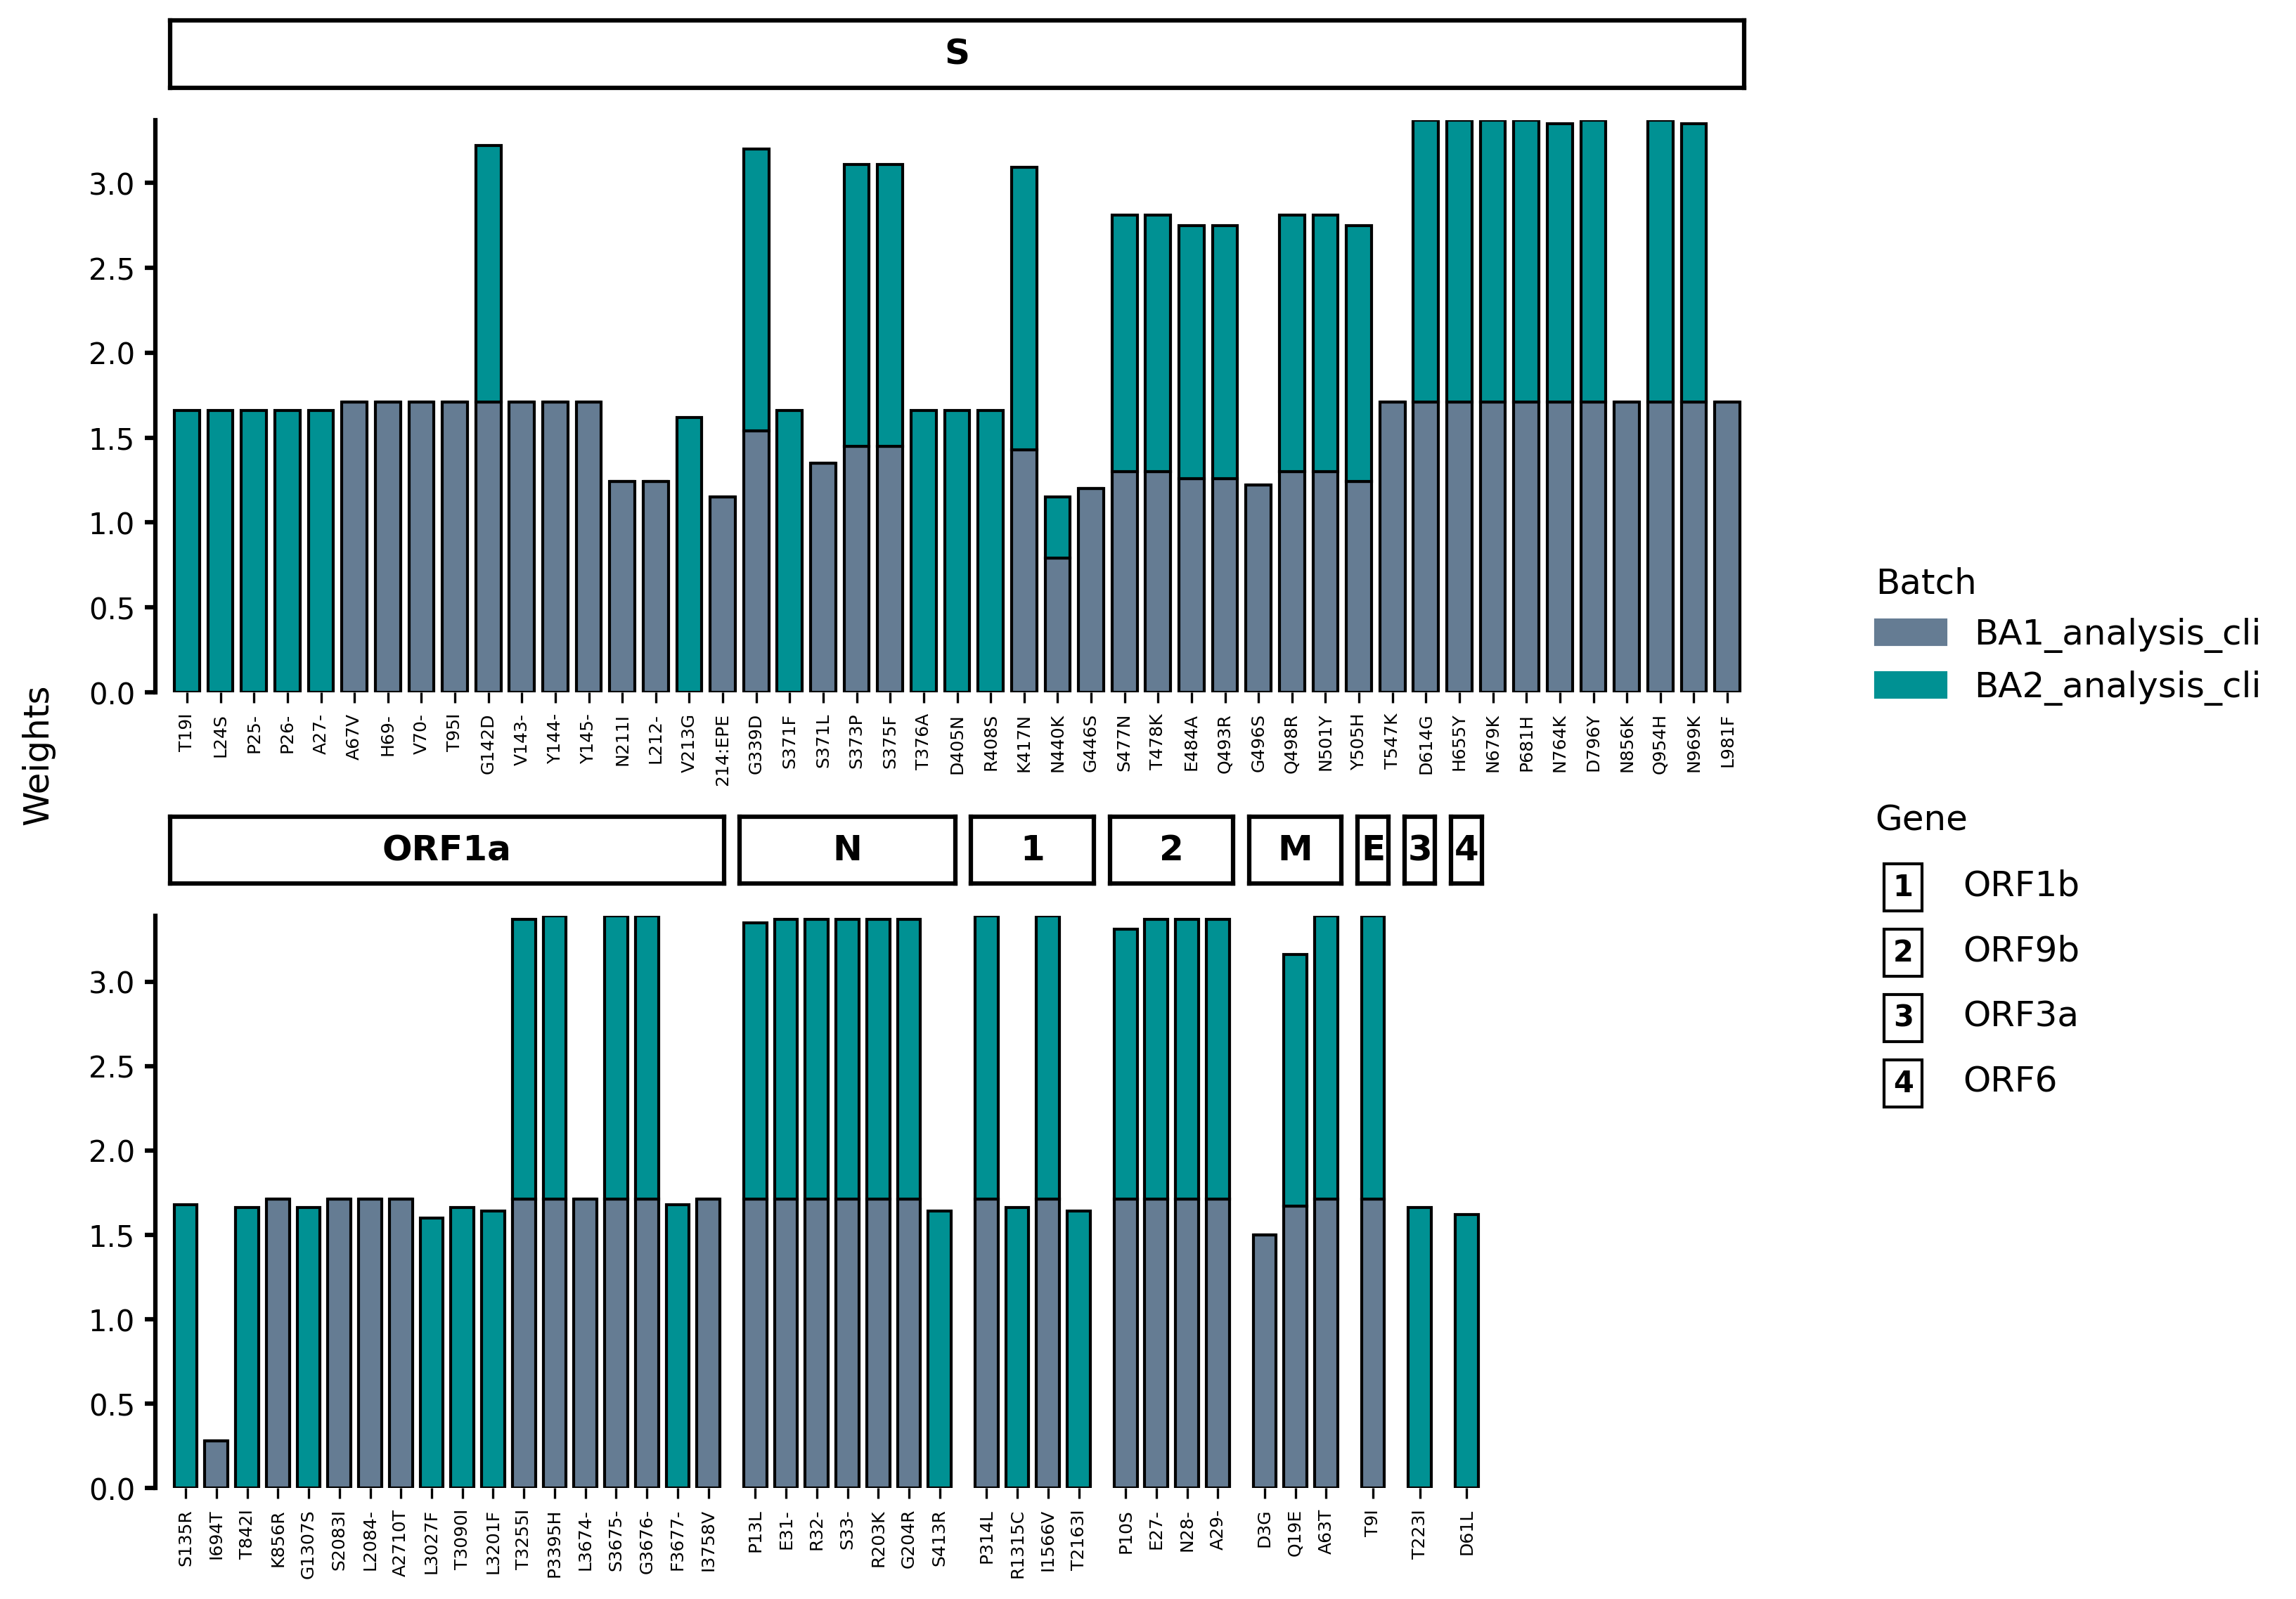
Note that by default, VARGRAM favors placing genes with the most number of mutations first. The figure can be customized to show genes by their start position, to force a horizontal layout and other options:
vg = vargram(data='test_data/analysis/omicron_analysis_cli.tsv', # Provide data
gene='test_data/sc2.gff') # Provide annotation file
vg.profile(threshold=5, # Set minimum count for a mutation to be included
ytype='counts') # Set y-axis to show raw count
vg.aes(stack_title='Region', # Change batch legend title
stack_label=['Foreign', 'Local'], # Change batch names
stack_color=['#009193', '#E33E84'], # Change batch bar colors
order=True, # Order the genes based on the annotation file
flat=True) # Force a horizontal layout
vg.key('test_data/keys/BA1_key.csv', label='BA.1') # Show key mutations of BA.1
vg.key('test_data/keys/BA2_key.csv', label='BA.2') # Show key mutations of BA.2
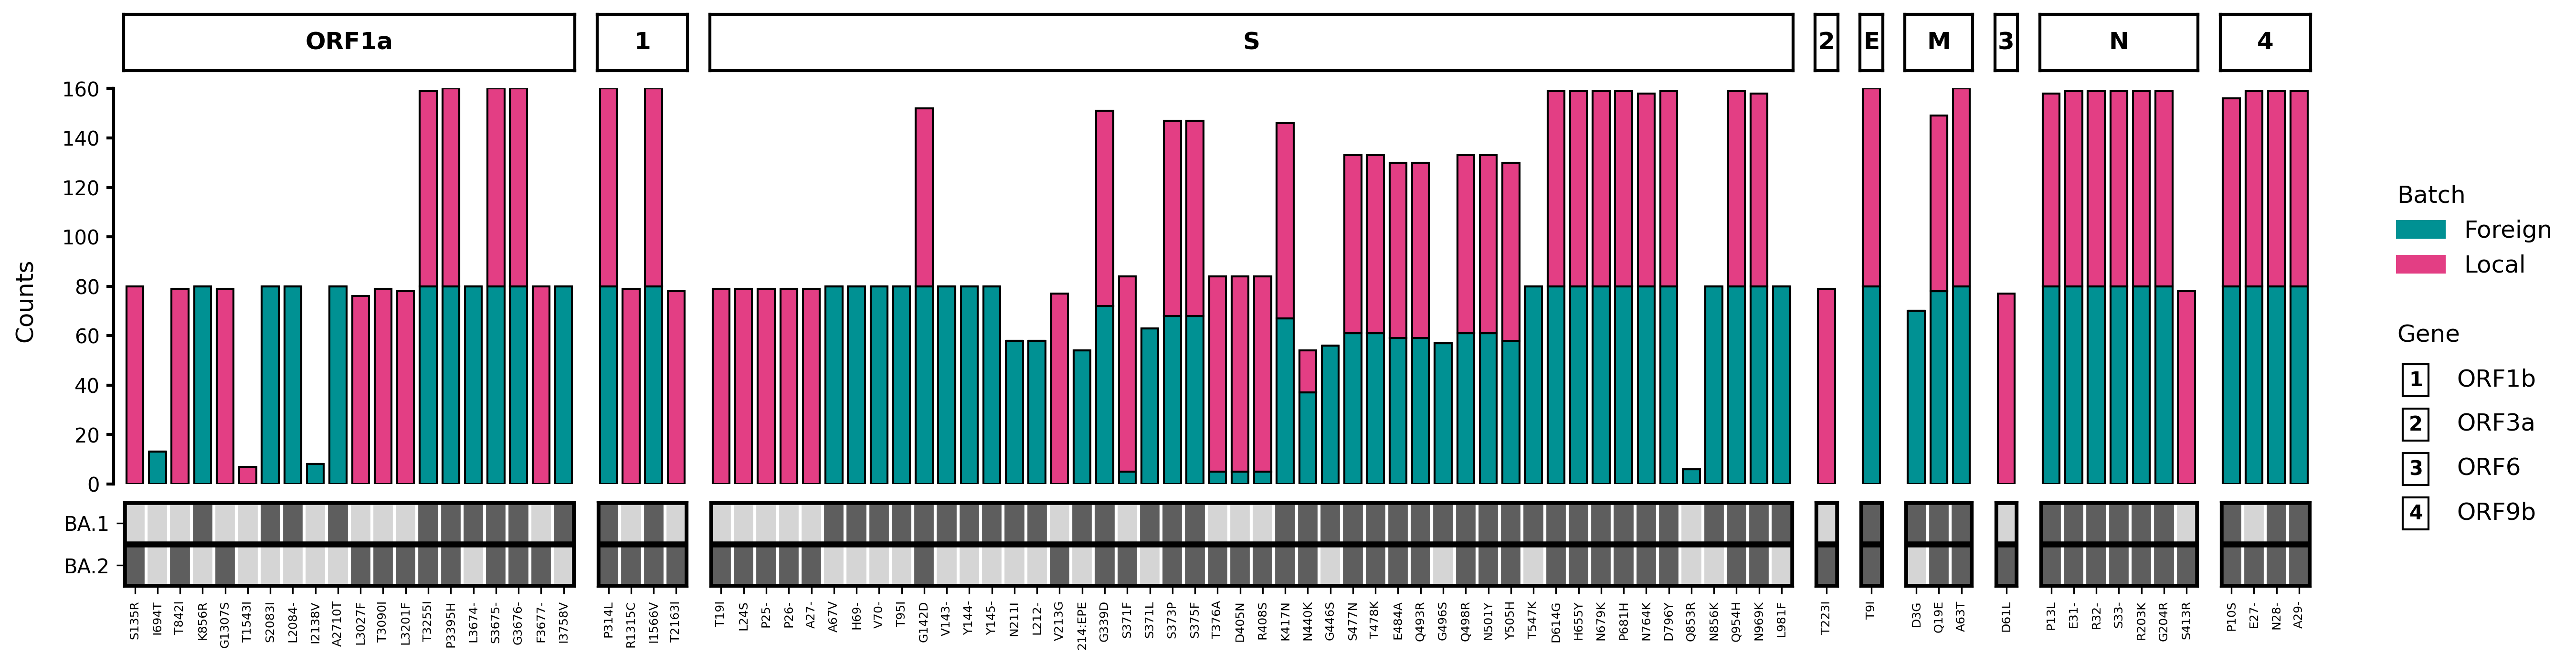
vg.show() # Show the figure
This results to the following figure:
Project details
Release history Release notifications | RSS feed


Download files
Download the file for your platform. If you're not sure which to choose, learn more about installing packages.
Source Distribution
Built Distribution
Filter files by name, interpreter, ABI, and platform.
If you're not sure about the file name format, learn more about wheel file names.
Copy a direct link to the current filters
File details
Details for the file vargram-0.4.0.tar.gz.
File metadata
- Download URL: vargram-0.4.0.tar.gz
- Upload date:
- Size: 31.5 kB
- Tags: Source
- Uploaded using Trusted Publishing? No
- Uploaded via: twine/6.1.0 CPython/3.12.4
File hashes
| Algorithm | Hash digest | |
|---|---|---|
| SHA256 |
36bf9c23f242b37642a27fa7ab1952f18c49e2416b6ffba76bd8e414fabac001
|
|
| MD5 |
5ac9e8d81e870d4fda8c90b79a5ba022
|
|
| BLAKE2b-256 |
f1dafda526ae6638d07c90498a2f947892923c4bfaa541875c2139307f3646d5
|
File details
Details for the file vargram-0.4.0-py3-none-any.whl.
File metadata
- Download URL: vargram-0.4.0-py3-none-any.whl
- Upload date:
- Size: 31.2 kB
- Tags: Python 3
- Uploaded using Trusted Publishing? No
- Uploaded via: twine/6.1.0 CPython/3.12.4
File hashes
| Algorithm | Hash digest | |
|---|---|---|
| SHA256 |
4365ce52bc1704a008e65332fce5bb0c900a122c65548f6865b2821975c88bfb
|
|
| MD5 |
e957a3a029706b951e27c657cdb7312c
|
|
| BLAKE2b-256 |
b03f24665e80c8b8bb821eb3f6682f824cc7e6fa7fb6e0657690b87d04463775
|


