


VennFan
Overview
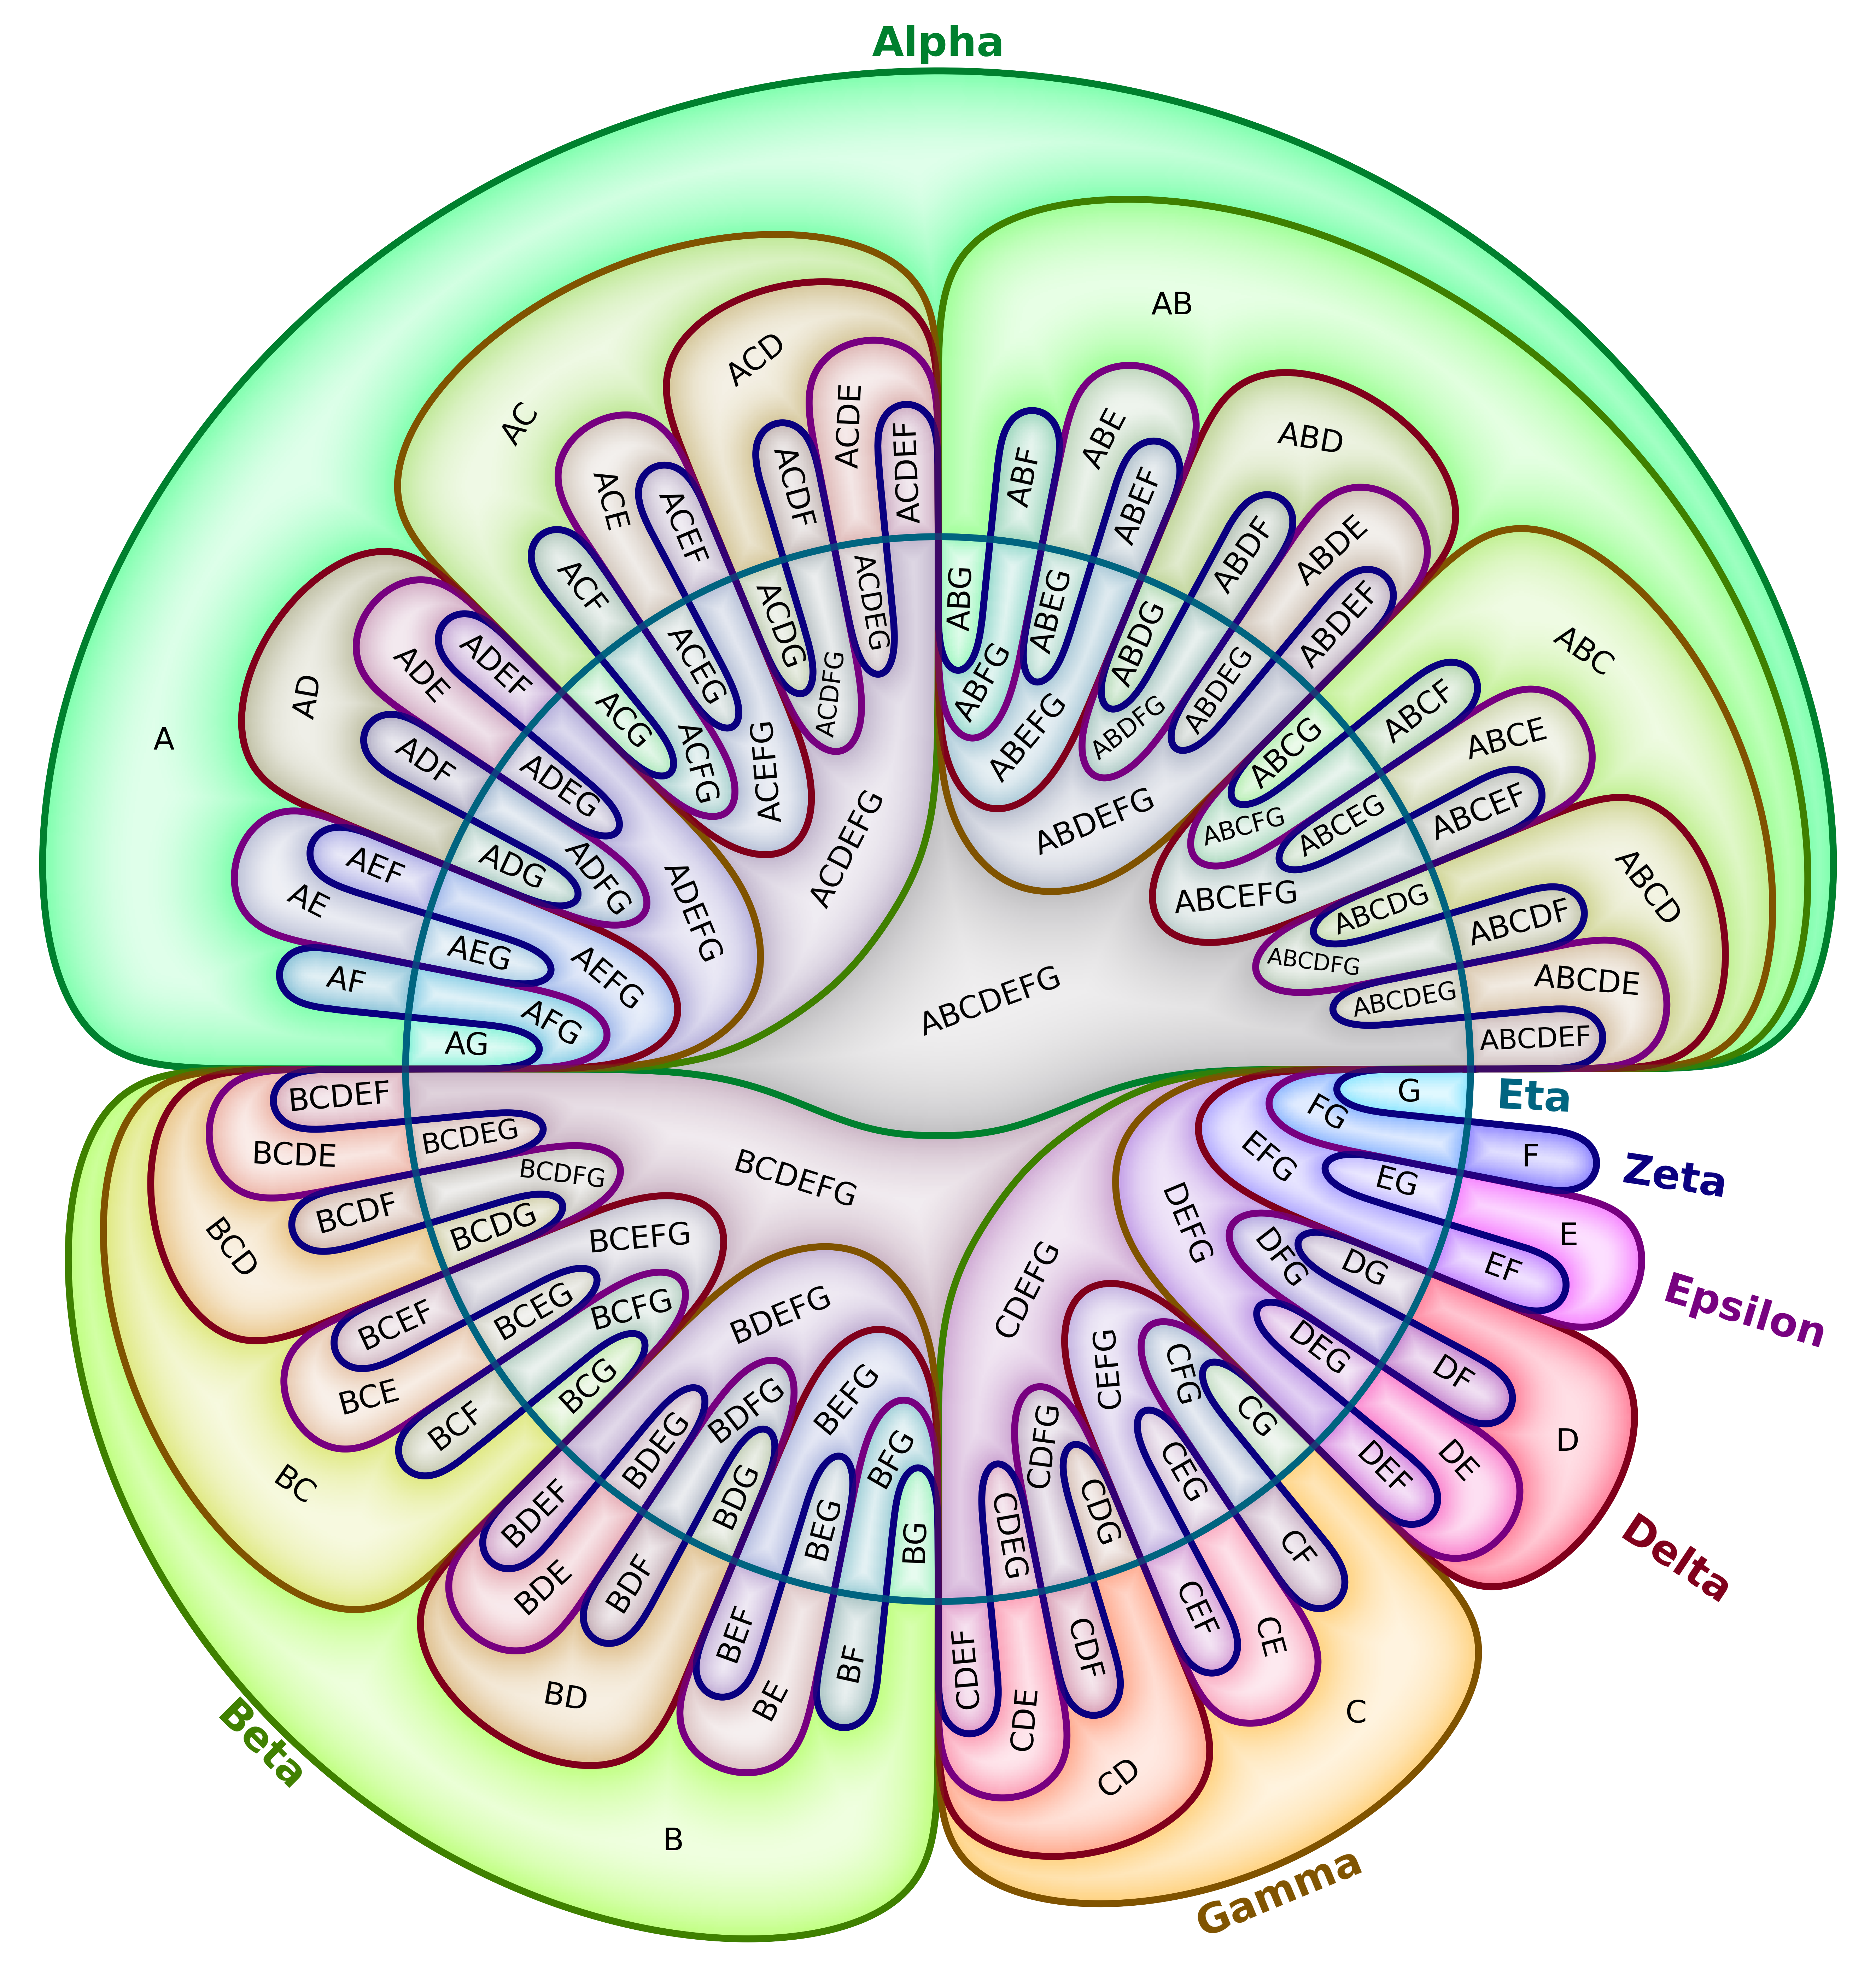
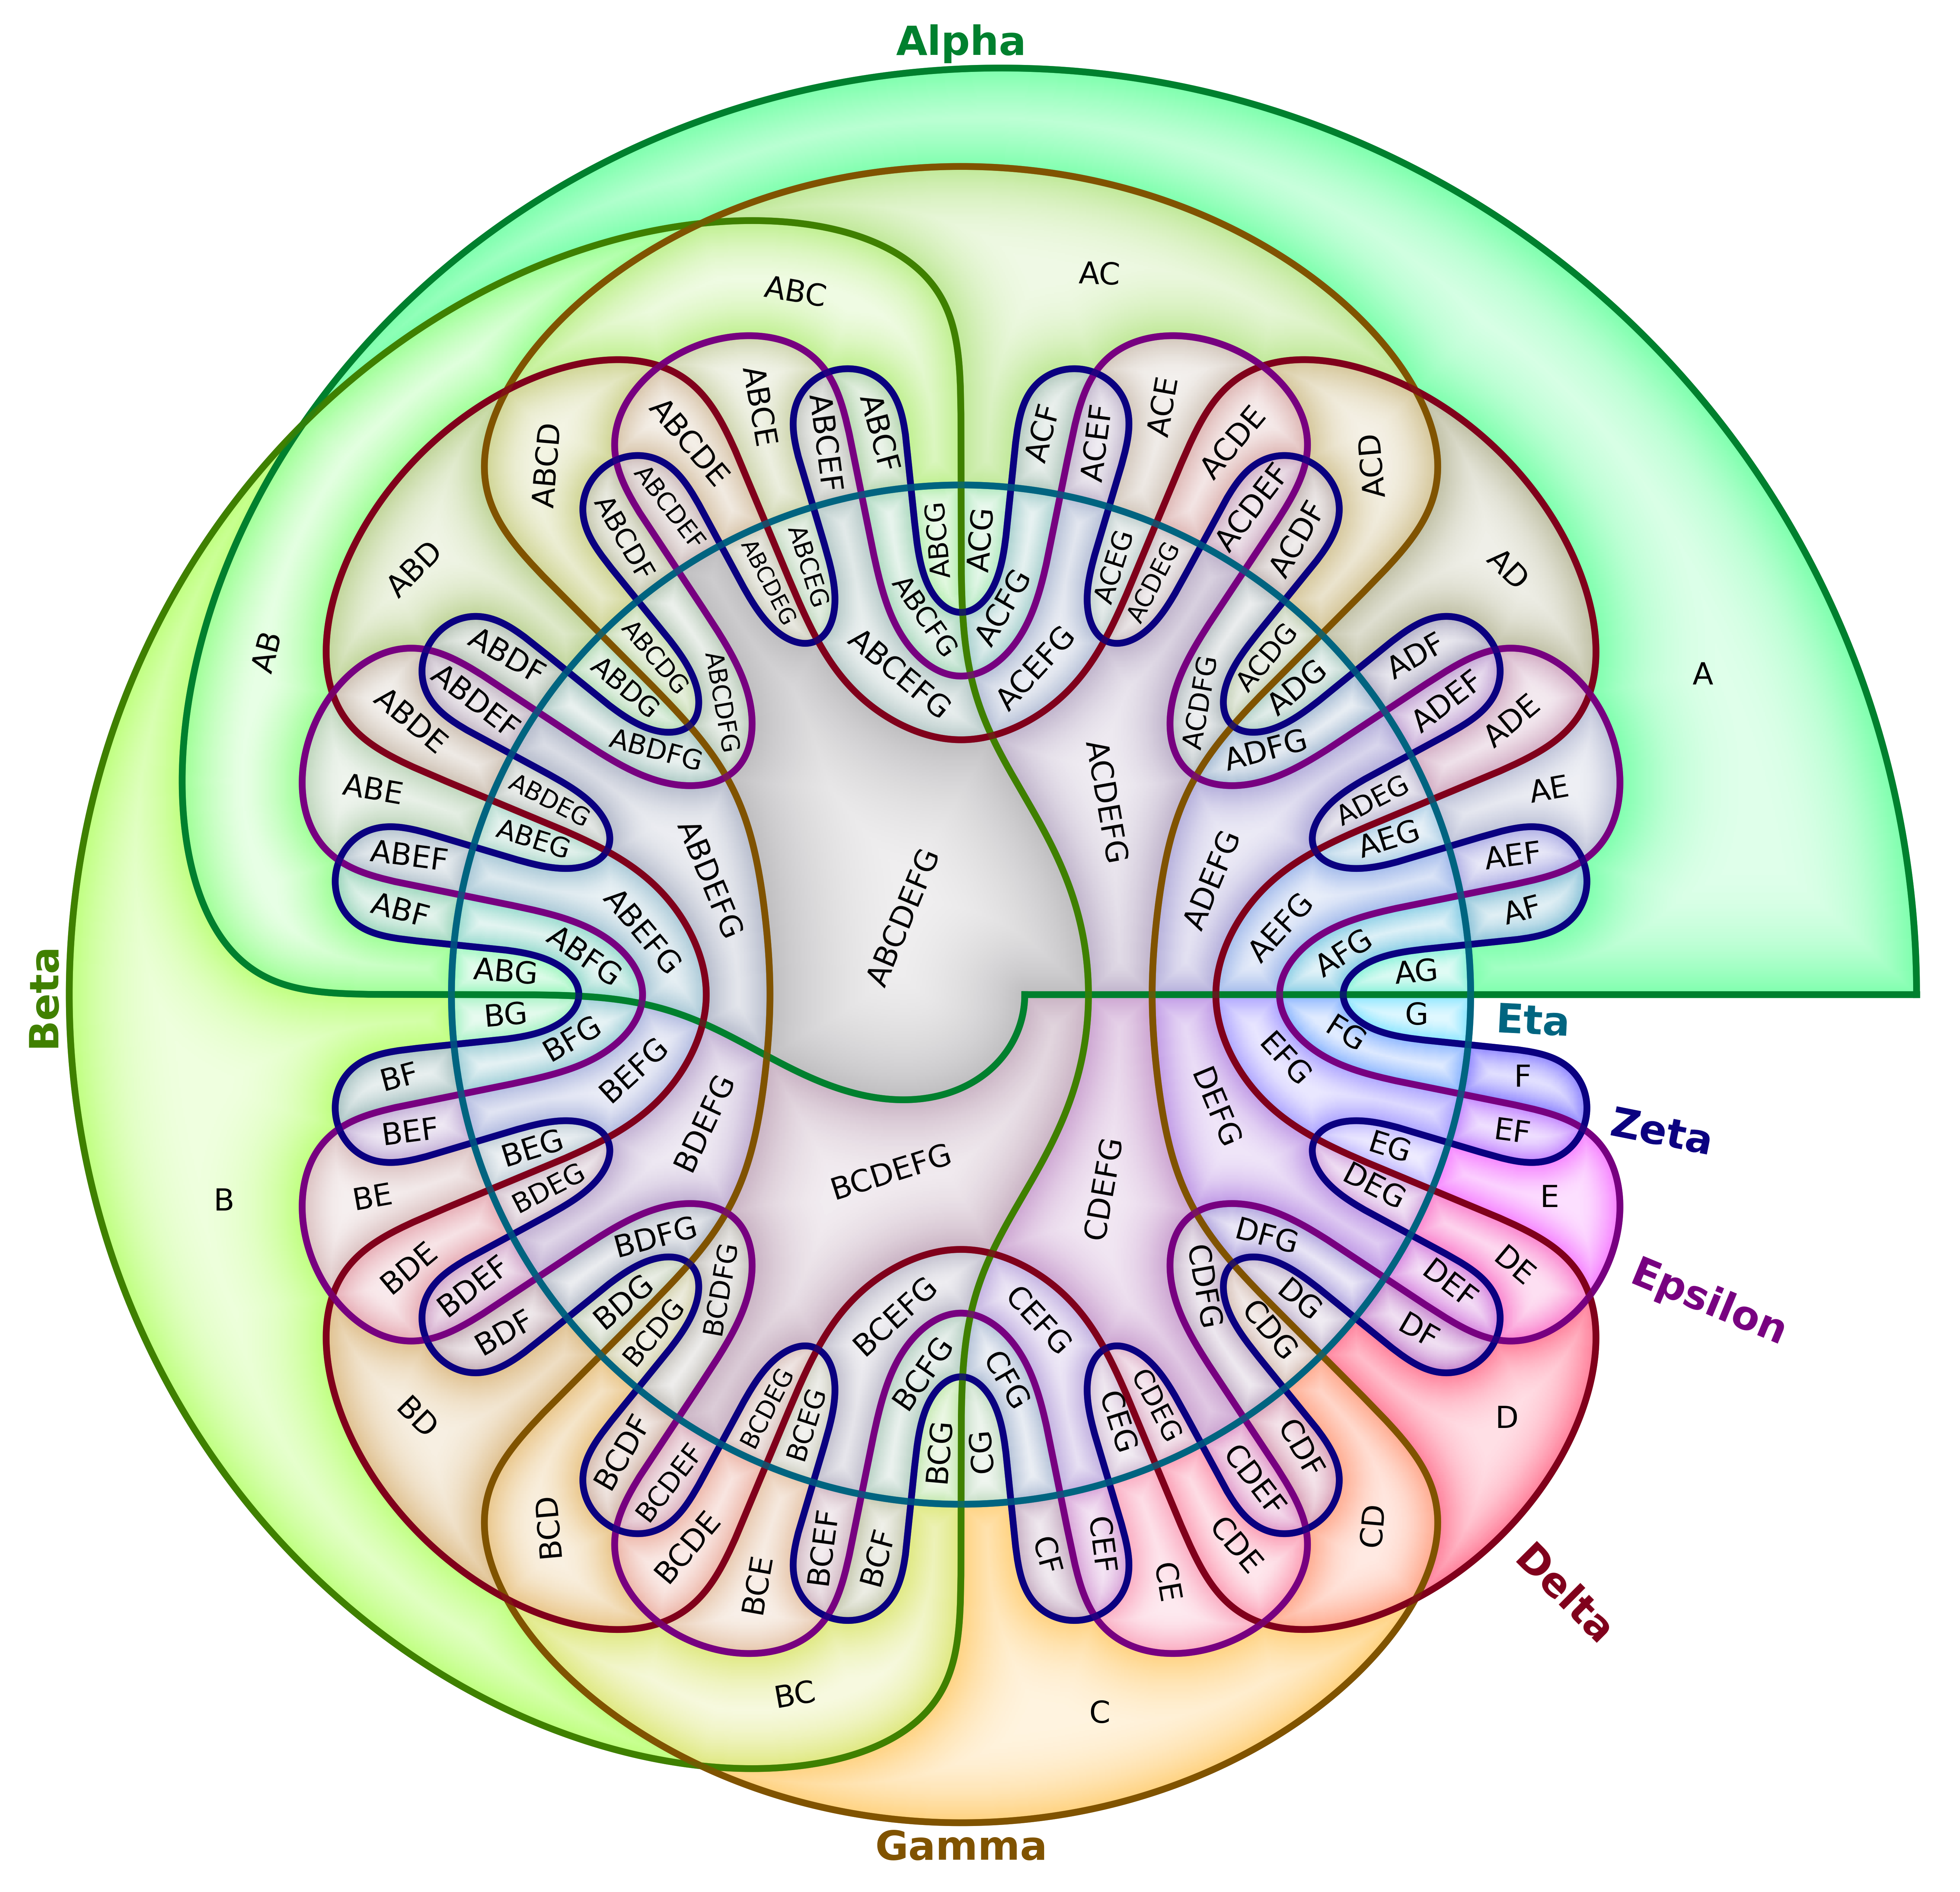
We introduce VennFan, a method for generating n-set Venn diagrams based on the polar coordinate projection of trigonometric boundaries, resulting in Venn diagrams that resemble a set of fan blades.
This module provides a function for creating VennFan Matplotlib figures for up to nine classes.
| Sine | Cosine |
|---|---|
 |
 |
Installation
pip install vennfan
Usage
Basic Usage
import numpy as np
import matplotlib.pyplot as plt

from vennfan import vennfan

# Fill a 4D 2x2x2x2x2x2 array with random values
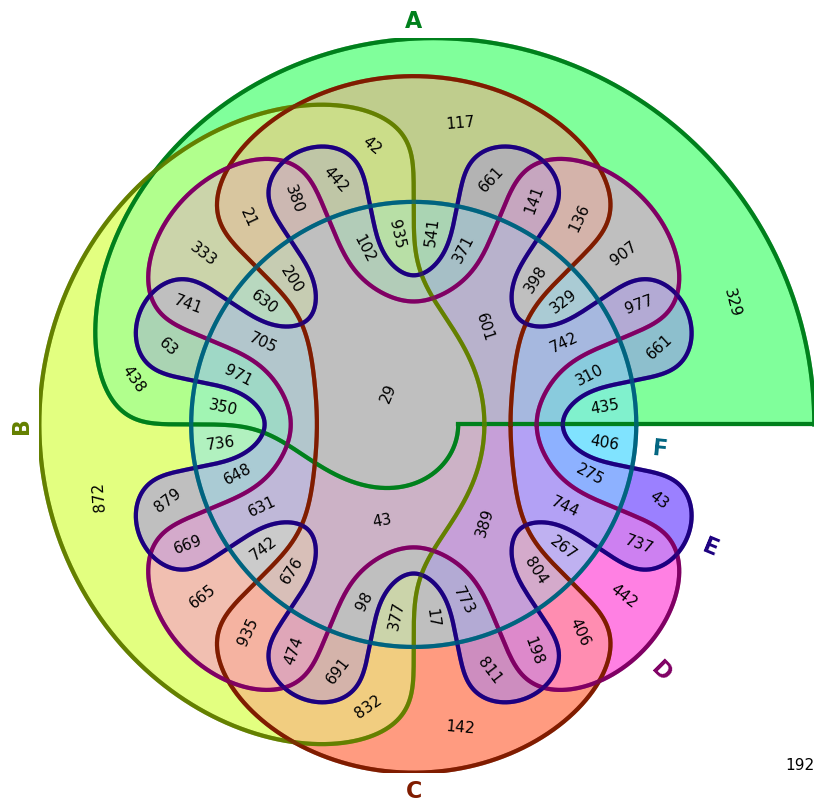
rand6 = np.random.randint(0, 1000, size=(2, 2, 2, 2, 2, 2))

# Set the value at A∩B∩C to 42
rand6[1,1,1,0,0,0] = 42

# Create the Venn-diagram
fig = vennfan(rand6, ["A", "B", "C", "D", "E", "F"])

# Save the figure
fig.savefig("rand6_demo.png", dpi=100, bbox_inches="tight")
plt.close(fig)
Optional Parameters
Core data
| Parameter | Default | Description |
|---|---|---|
title |
None |
Optional figure title (str). If None, no title is added. |
outfile |
None |
Optional output path(s). If a str or a list of str-s, the figure is saved and the function returns None. If None, the function returns the Matplotlib Figure. |
Geometry / boundary curves
| Parameter | Default | Description |
|---|---|---|
curve_mode |
"cosine" |
Boundary curve family: "cosine" or "sine". |
decay |
"linear" |
Amplitude decay mode: "linear" or "exponential". |
p |
None |
Curve parameter. If None, a per-N default is loaded from package defaults. |
epsilon |
None |
Curve parameter. If None, a per-N default is loaded from package defaults. |
delta |
None |
Curve parameter. If None, a per-N default is loaded from package defaults. |
b |
None |
Curve parameter. If None, a per-N default is loaded from package defaults. |
Colors
| Parameter | Default | Description |
|---|---|---|
colors |
None |
Per-class fill colors. If shorter than N, repeated cyclically. If None, uses the library default palette. |
outline_colors |
None |
Per-class outline colors for boundary curves and class labels. If shorter than N, repeated cyclically. If None, uses the library default outline palette. |
color_mixing |
"average" |
How to mix class colors into region colors. One of "average", "subtractive", "hue_average", "alpha_stack", or a callable f(colors_for_key, present) -> rgb. |
text_color |
None |
If set, overrides region label text color everywhere. If None, text color is chosen automatically per region based on fill color. |
Highlight
| Parameter | Default | Description |
|---|---|---|
highlight_factor |
None |
Enables a radial “halo” inside each region when set to a float in [0, 1]. None disables highlight. Higher values push colors more toward highlight_color. |
highlight_color |
"#FFFFFF" |
Target color used for the highlight blend (only used when highlight_factor is not None). |
highlight_gamma |
0.5 |
Exponent controlling the gradient transition speed of the highlight (gamma on normalized interior-distance profile). |
Font sizes / text fitting
| Parameter | Default | Description |
|---|---|---|
region_fontsize |
None |
Base font size for region labels. If None, uses a per-N default from package defaults. |
class_label_fontsize |
None |
Font size for class labels around the outside. If None, uses a per-N default from package defaults. |
complement_fontsize |
None |
Font size for the complement (all-zeros) label. If None, defaults to region_fontsize after defaults are resolved. |
shrink_region_text |
True |
If True, region labels shrink-to-fit within their region masks. If False, base font sizes are used as-is. |
Layout / resolution
| Parameter | Default | Description |
|---|---|---|
dpi |
None |
Figure DPI. If None, defaults to 100 * N. |
linewidth |
None |
Boundary curve linewidth. If None, uses a per-N default. Also affects erosion radius used for shrink-to-fit. |
disc_points_per_class |
200 |
Grid resolution control for region masks. Higher values refine boundaries and can reduce over-aggressive shrink-to-fit in small regions, at the cost of runtime/memory. |
Region label placement
| Parameter | Default | Description |
|---|---|---|
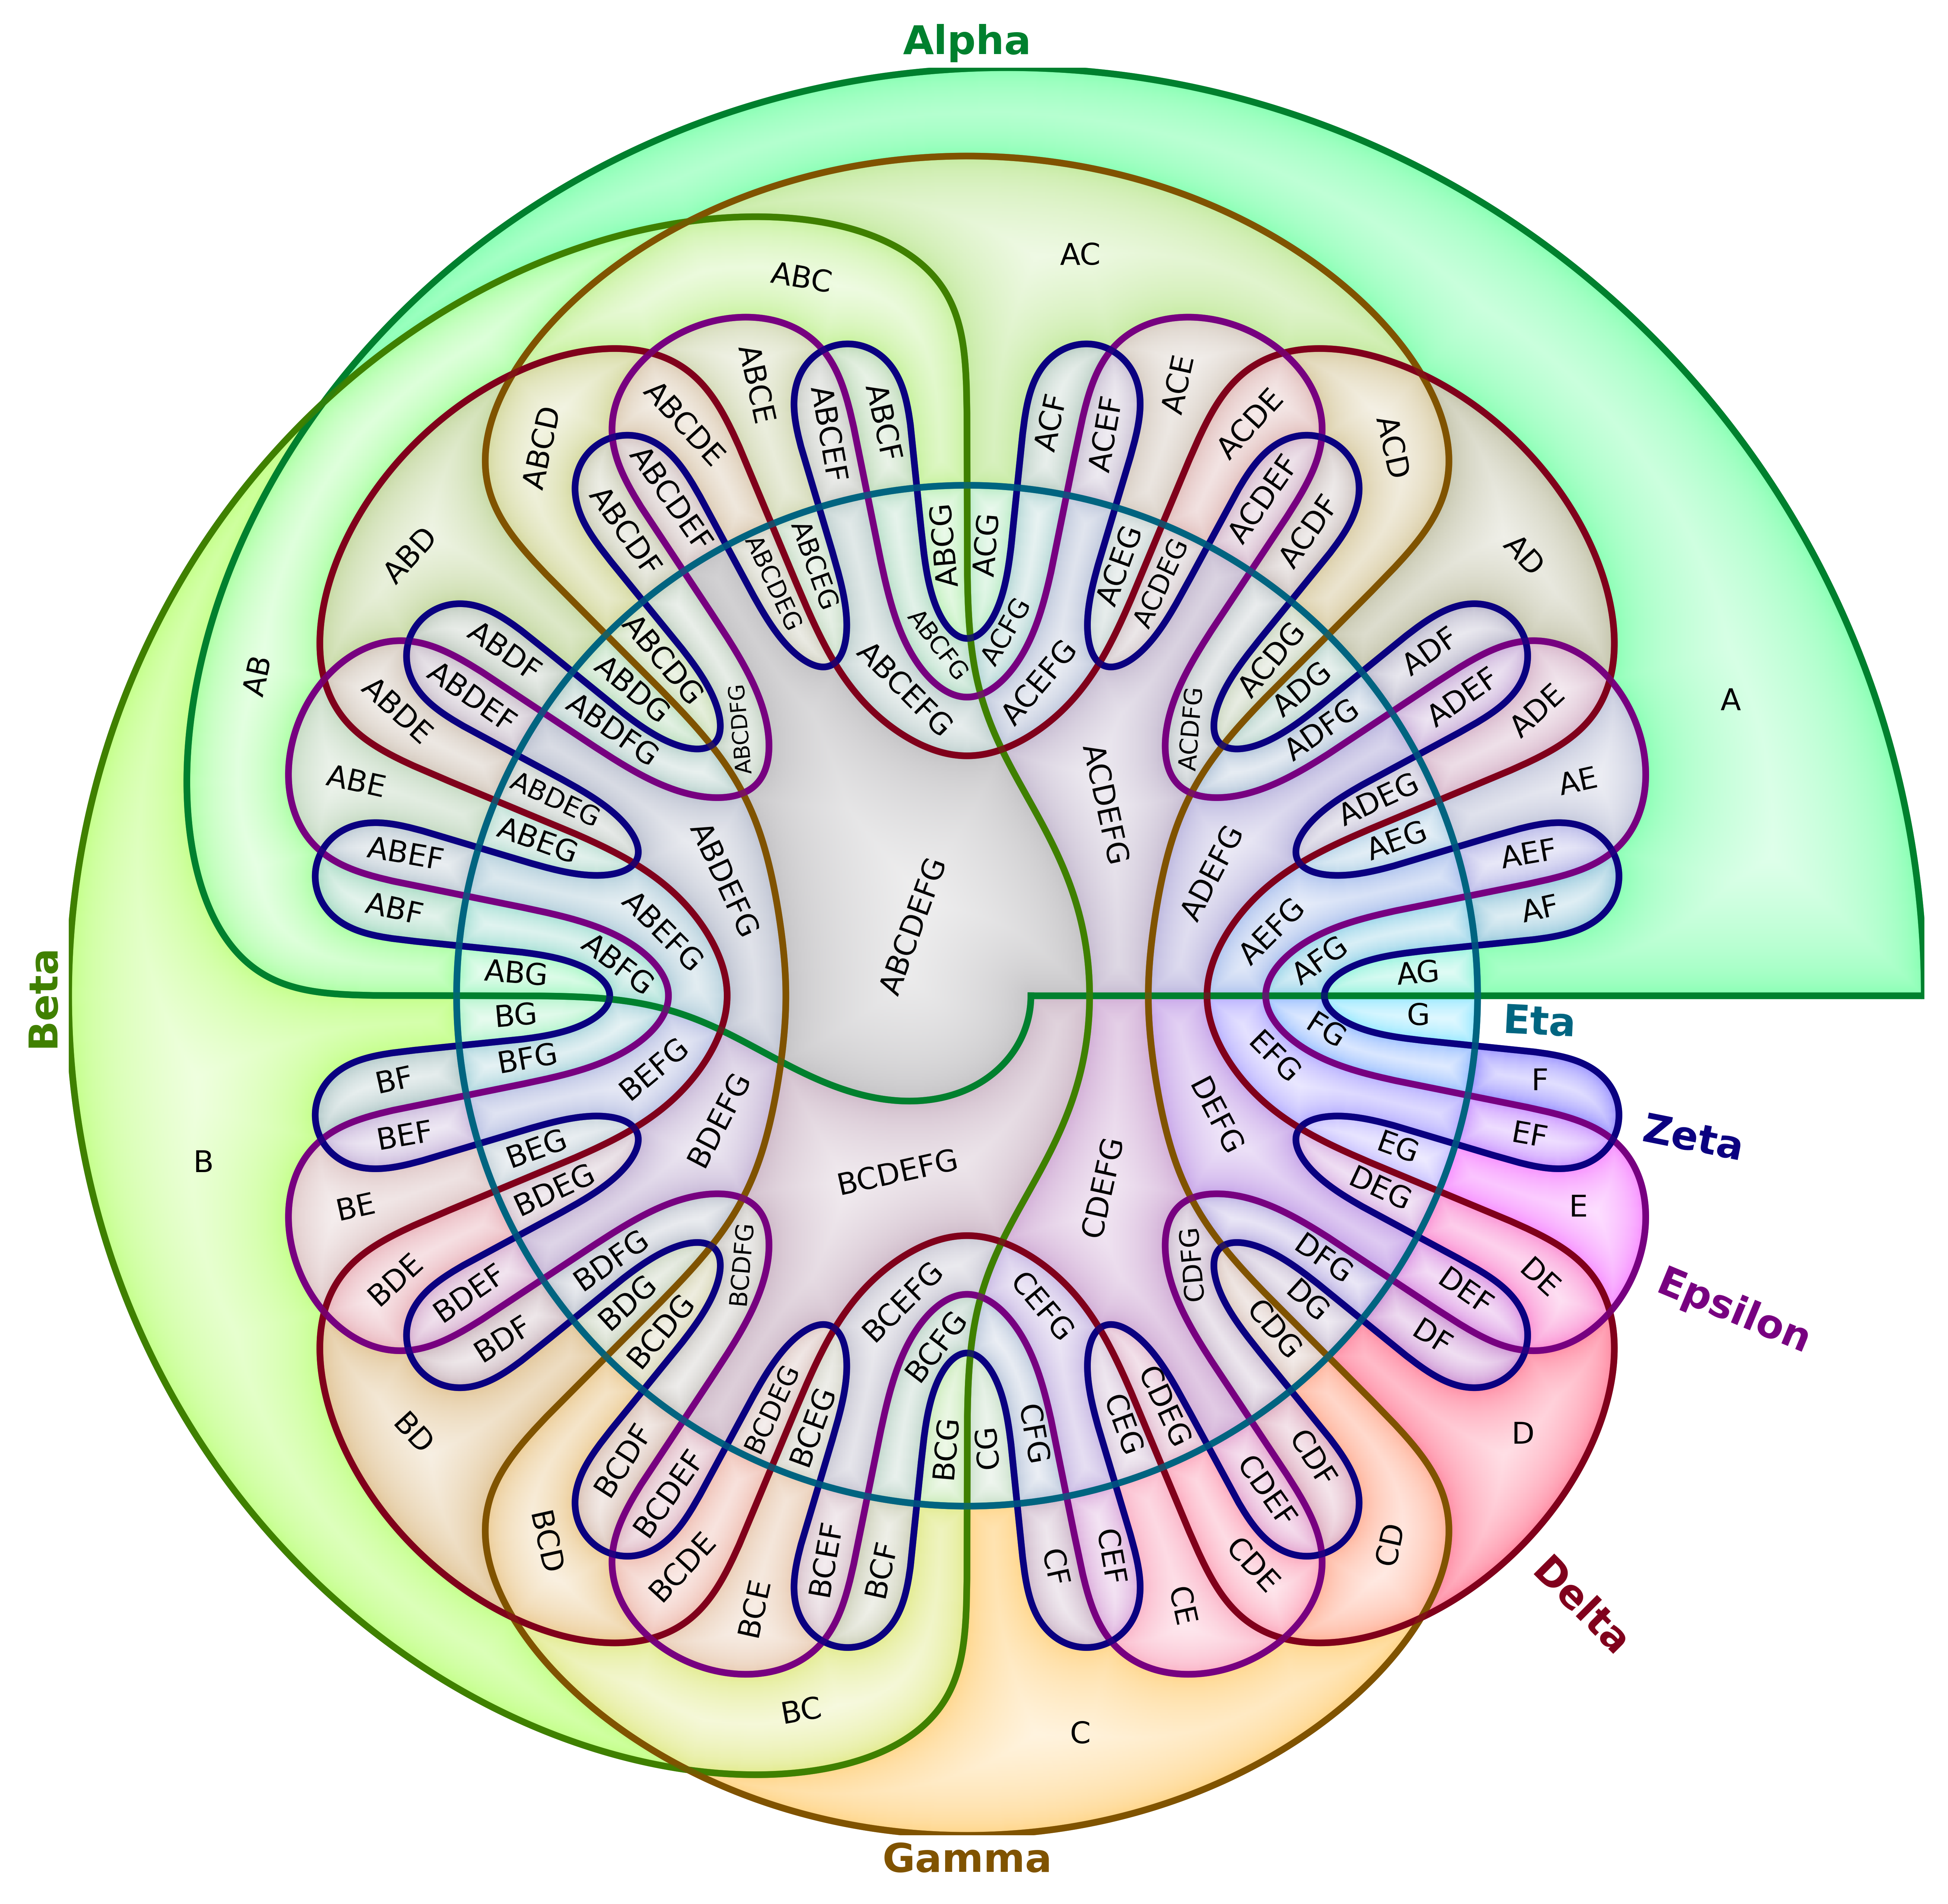
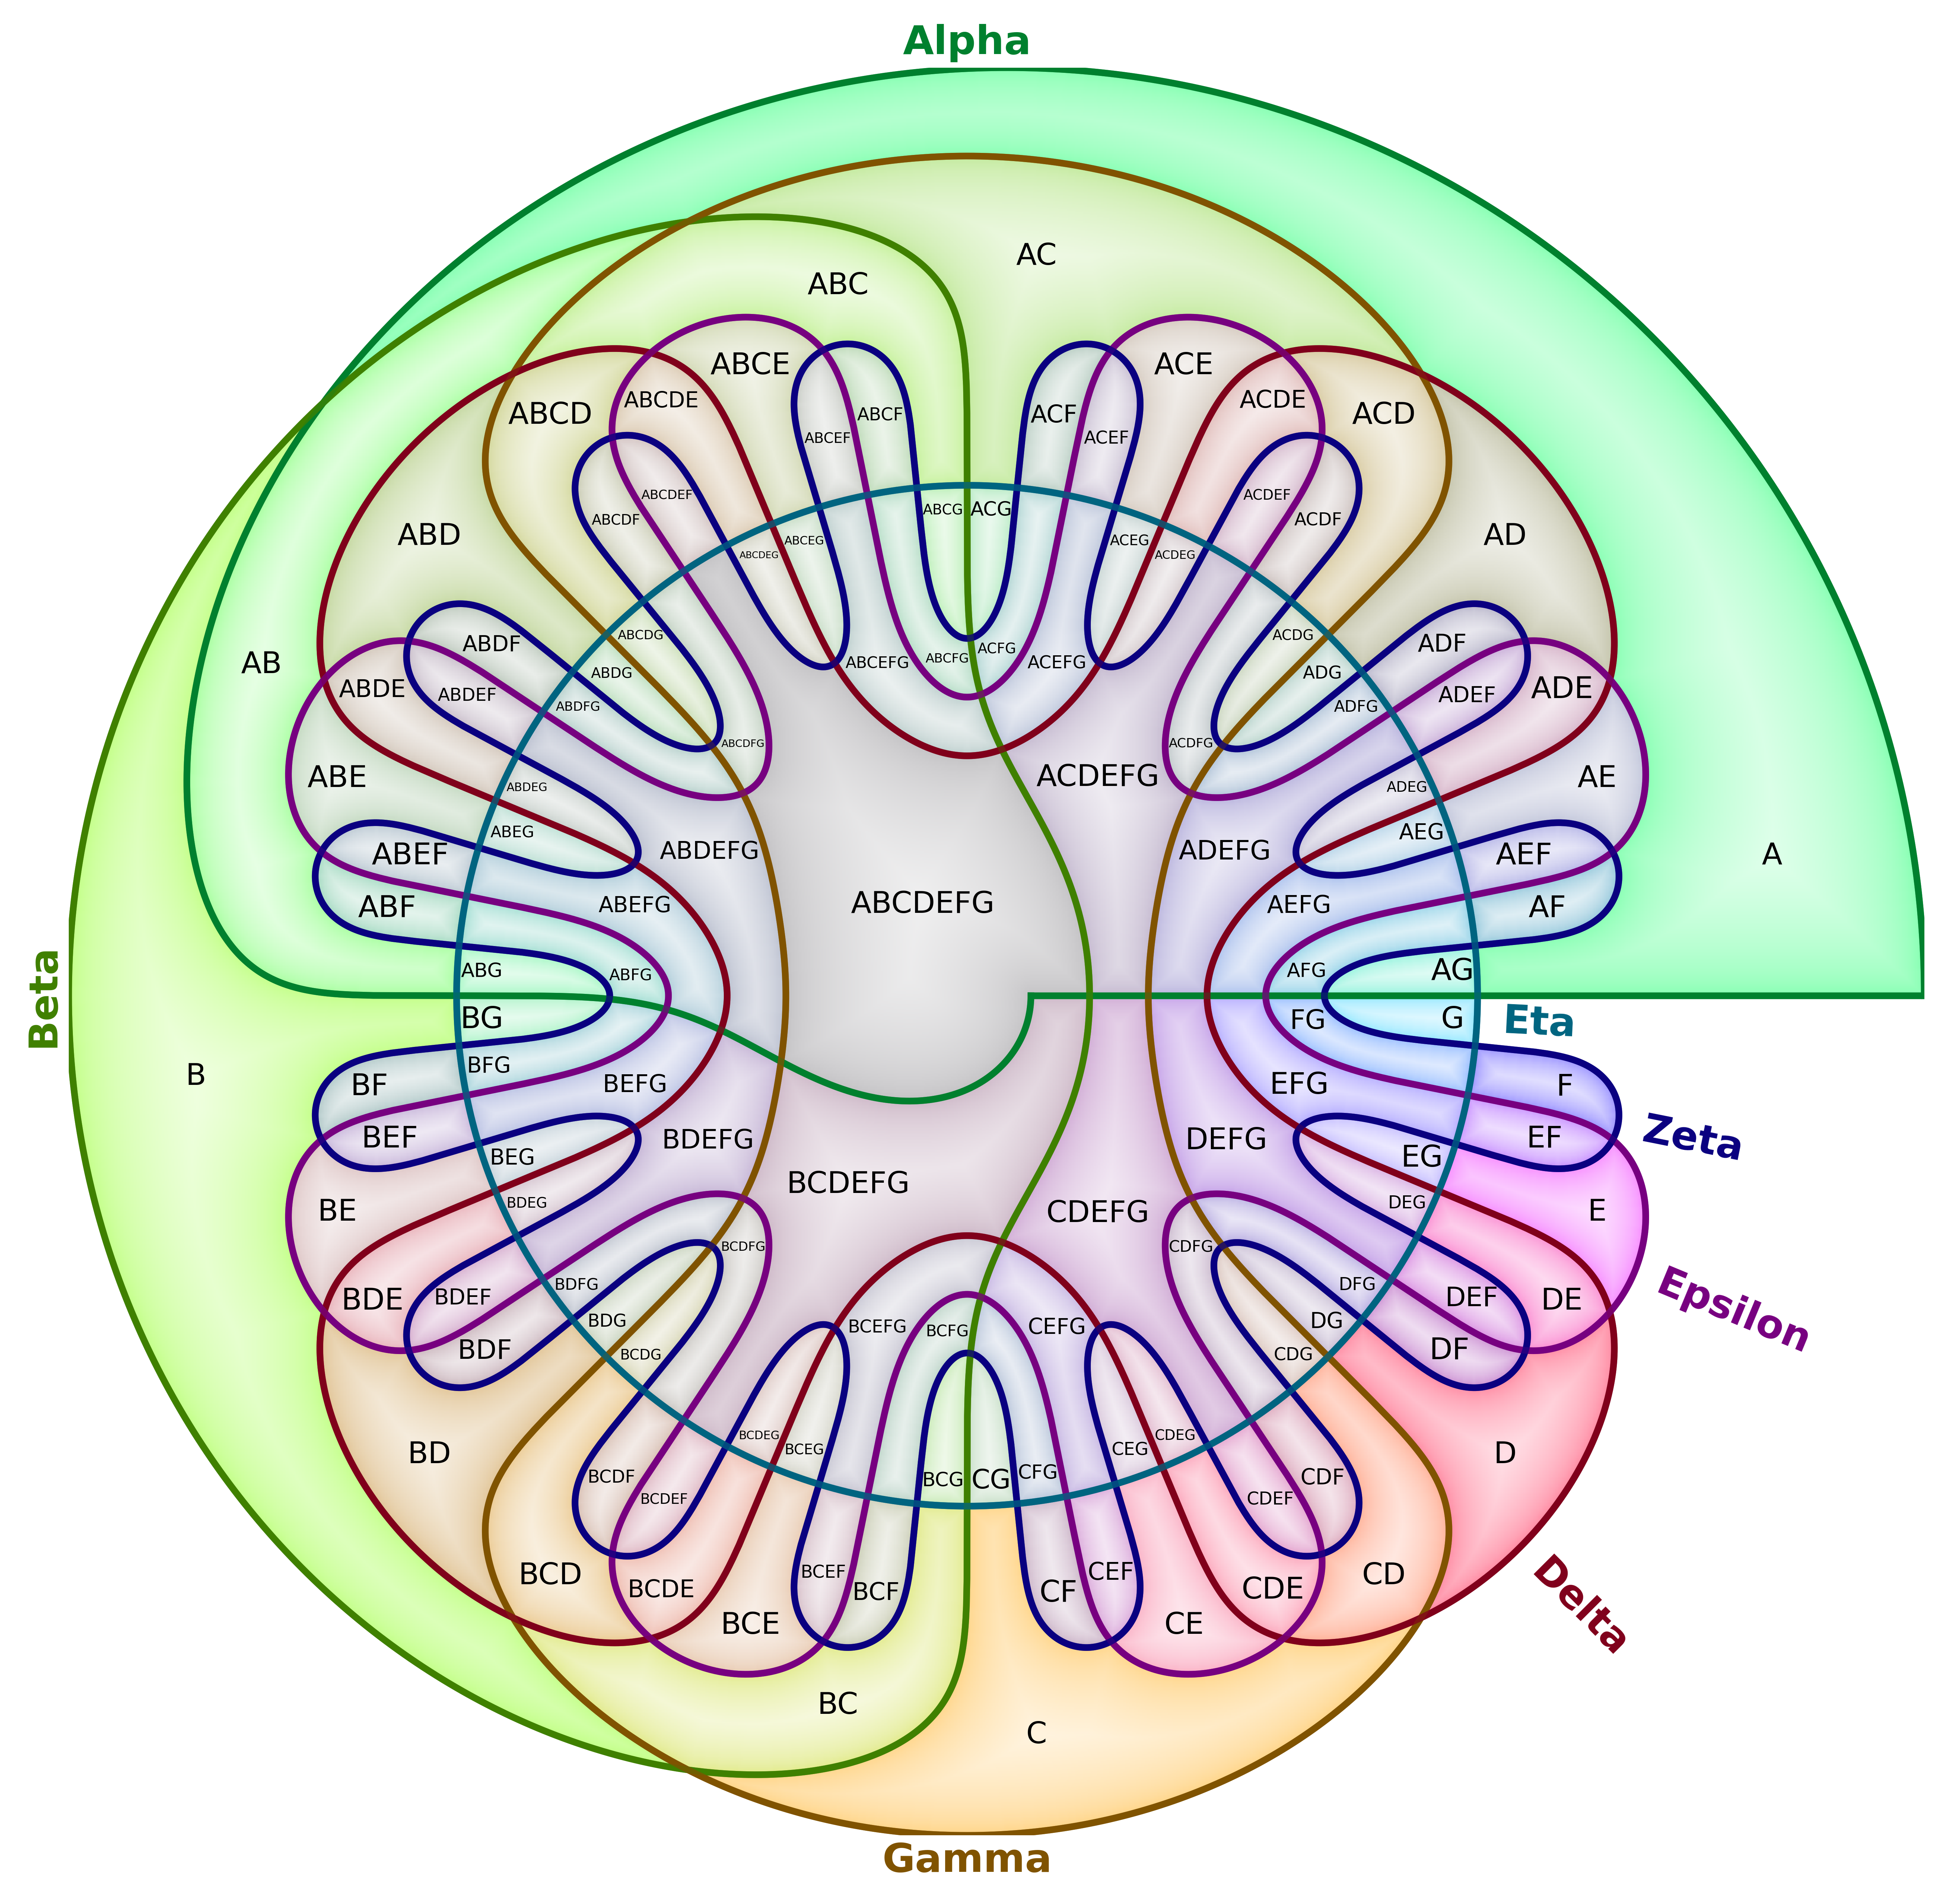
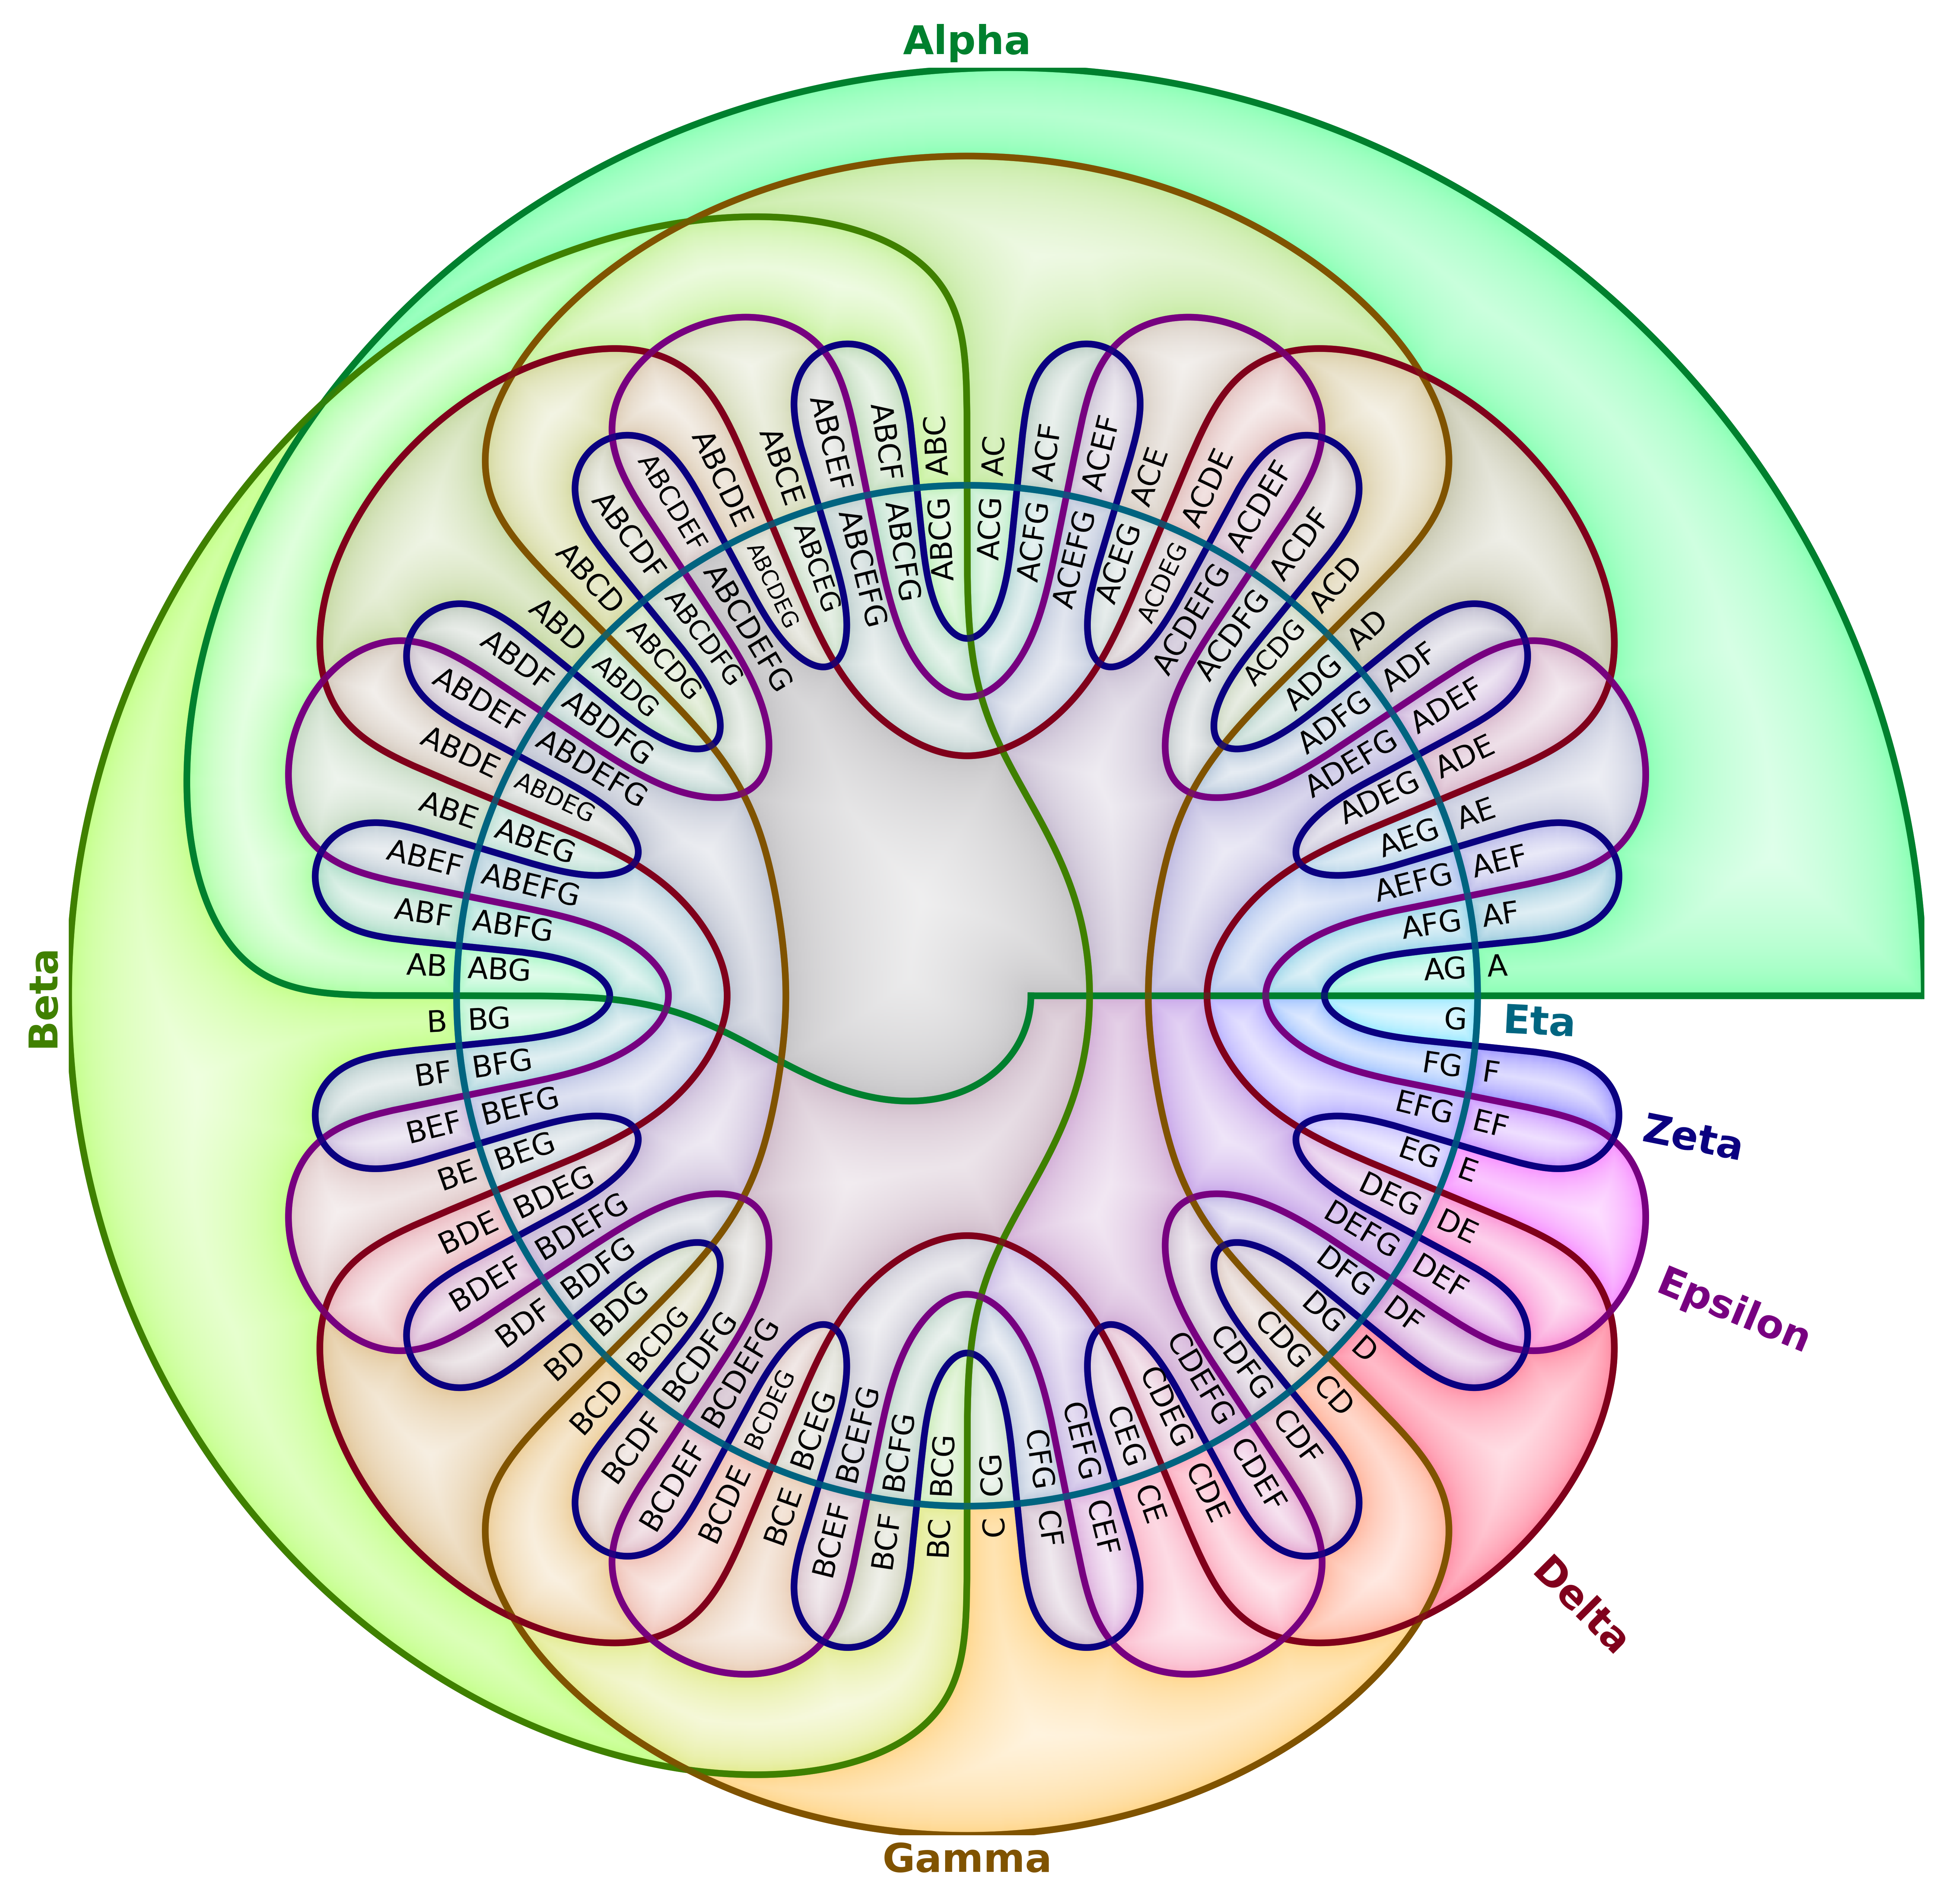
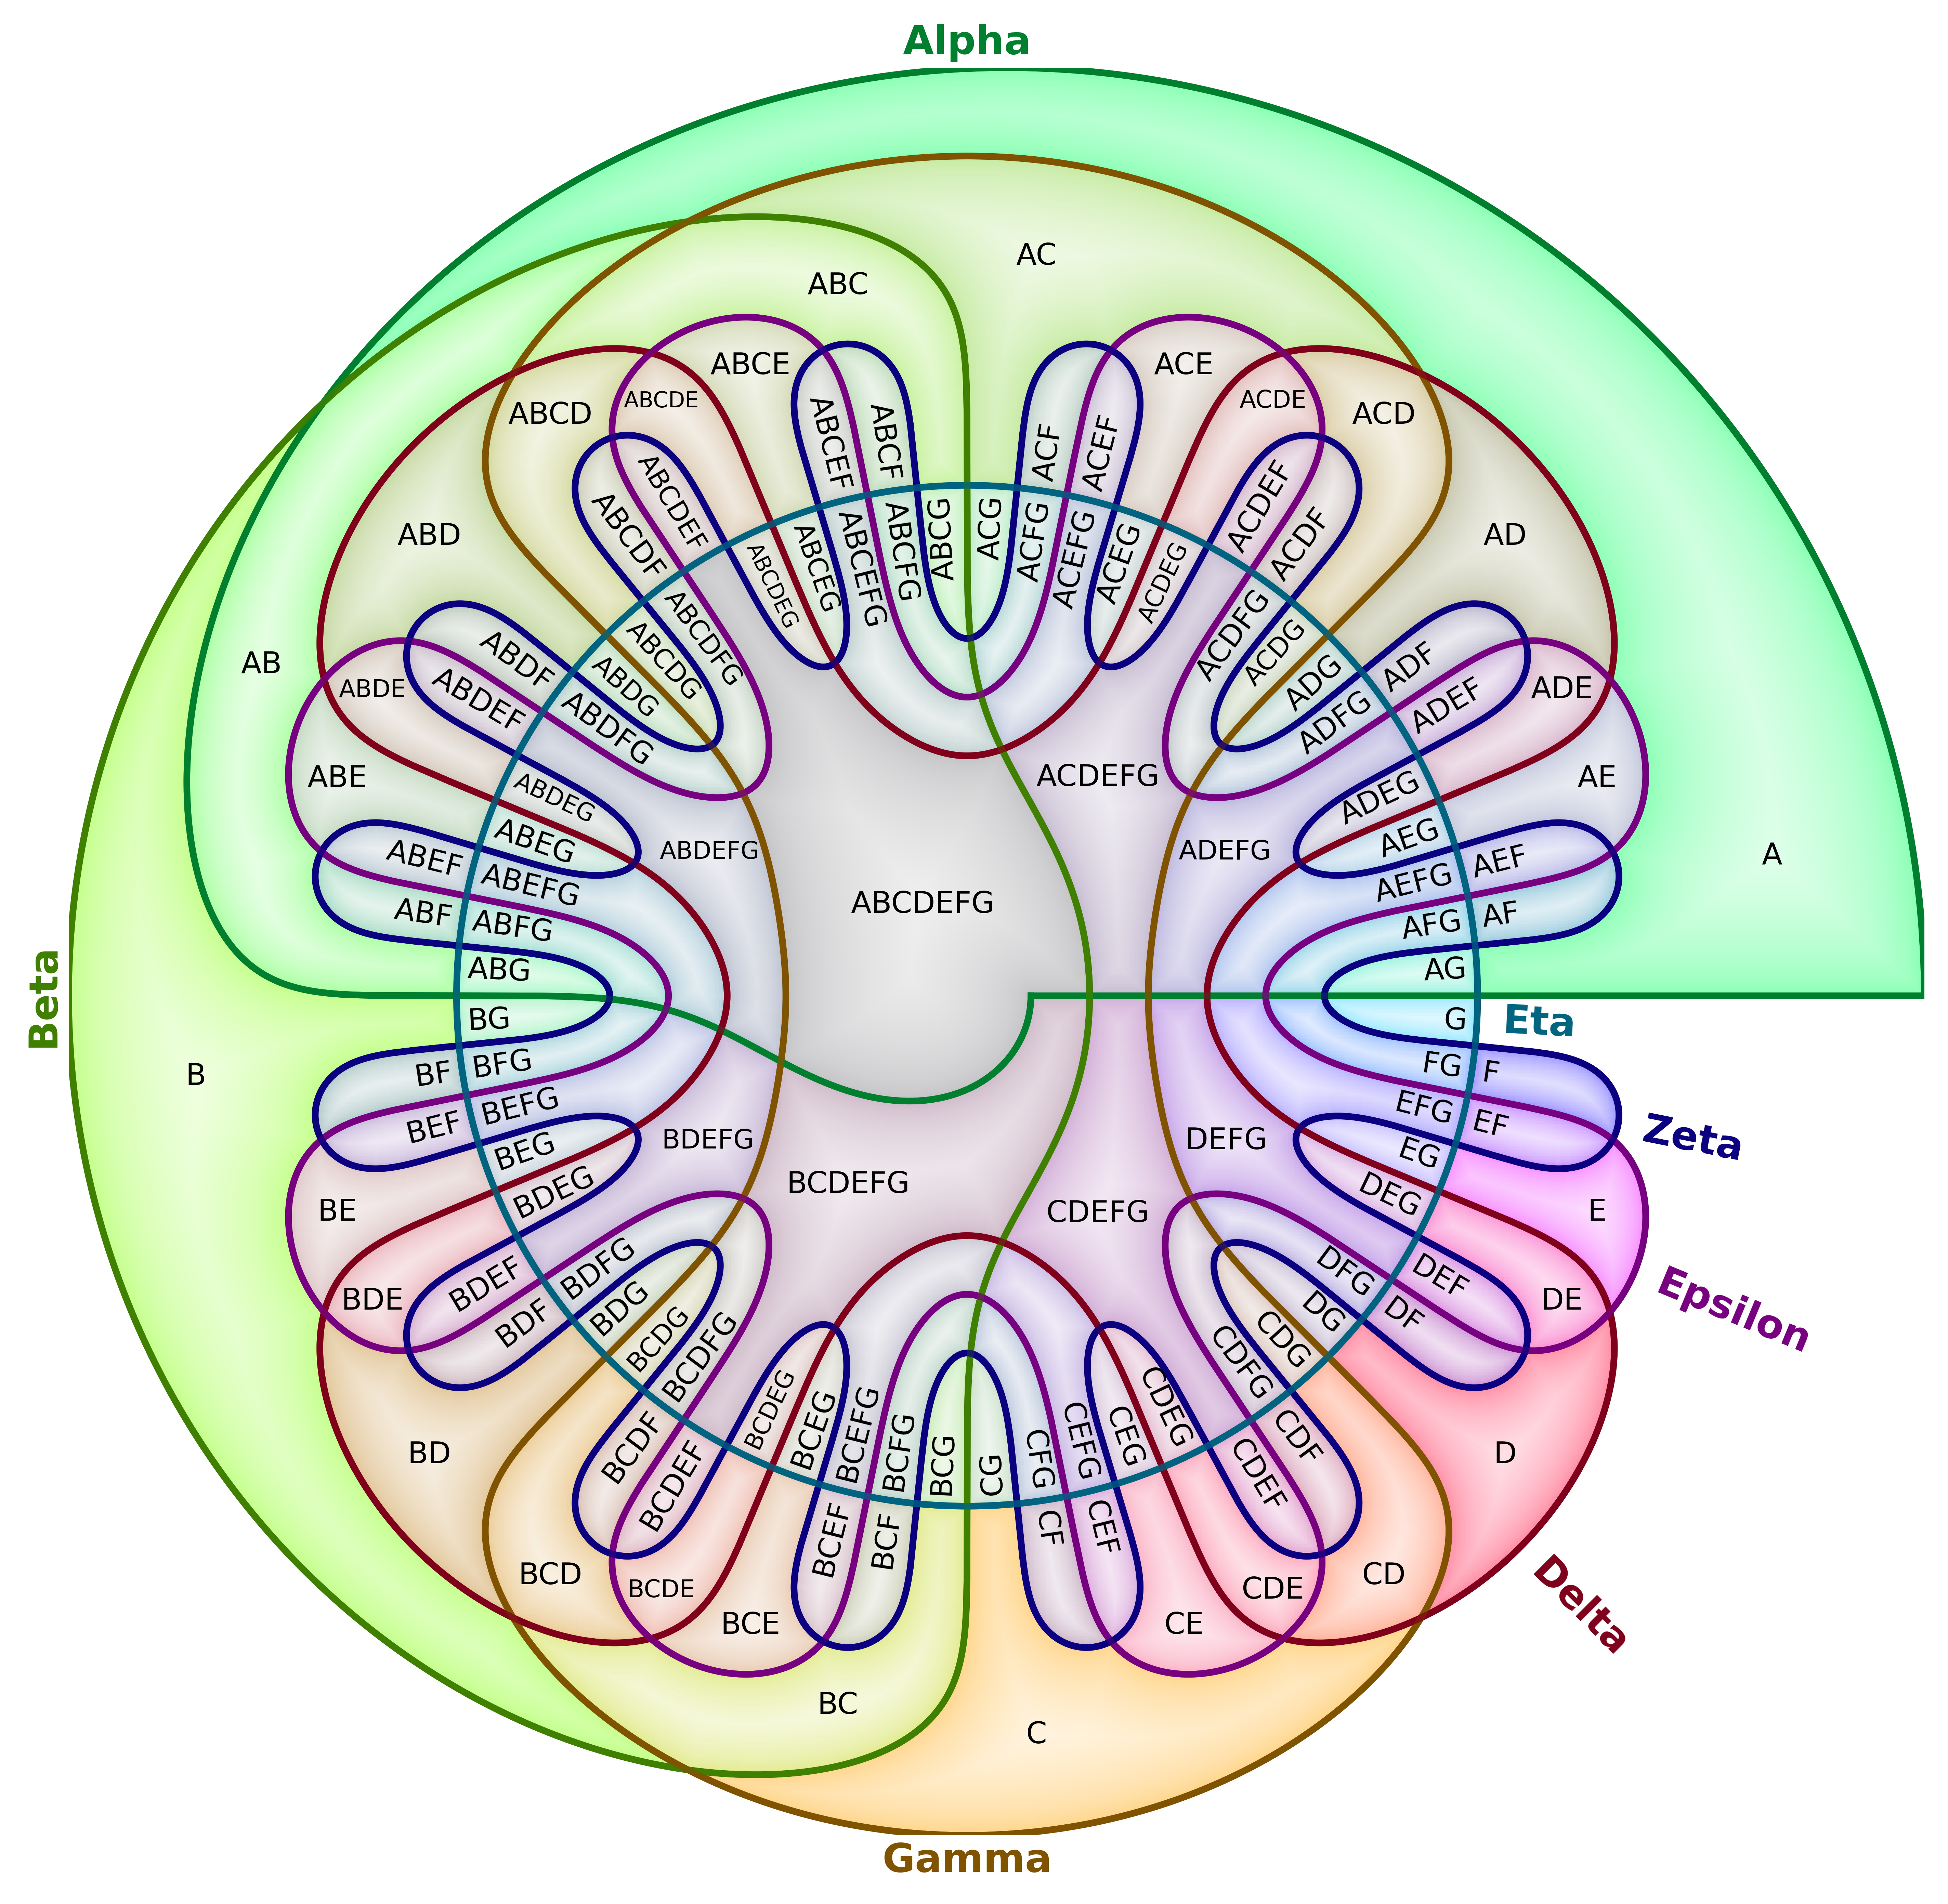
region_label_placement |
"visual_text_center" |
Label placement mode: "visual_text_center" (erosion-based interior anchor), "visual_center" (visual center), "radial" (along radial angle), or "hybrid" (per-region choice). |
"visual_text_center" |
"visual_center" |
"radial" |
"hybrid" |
|---|---|---|---|
 |
 |
 |
 |
How to Cite
@misc{csanády2026newperspectivedrawingvenn,
      title={A New Perspective on Drawing Venn Diagrams for Data Visualization},
      author={Bálint Csanády},
      year={2026},
      eprint={2601.06980},
      archivePrefix={arXiv},
      primaryClass={cs.GR},
      url={https://arxiv.org/abs/2601.06980},
}
License
This project is licensed under the MIT License (c) 2025 Bálint Csanády, aielte-research. See the LICENSE file for details.
1 maintainer

Download files
Download the file for your platform. If you're not sure which to choose, learn more about installing packages.
Source Distribution
Built Distribution
Filter files by name, interpreter, ABI, and platform.
If you're not sure about the file name format, learn more about wheel file names.
Copy a direct link to the current filters
File details
Details for the file vennfan-0.0.6.tar.gz.
File metadata
- Download URL: vennfan-0.0.6.tar.gz
- Upload date:
- Size: 38.6 kB
- Tags: Source
- Uploaded using Trusted Publishing? No
- Uploaded via:
twine/6.2.0 CPython/3.12.12
File hashes
| Algorithm | Hash digest | |
|---|---|---|
| SHA256 |
f3d89c7914798ff597638f1d370db120b1e46bda7045407f08ca78d6a4fa8965
|
|
| MD5 |
658ca75ceca832554a704c360da83fc3
|
|
| BLAKE2b-256 |
f528d70367481a40c1f03c3f0b11500866e6f08fab2b0c8ff8263f97921c5088
|
File details
Details for the file vennfan-0.0.6-py3-none-any.whl.
File metadata
- Download URL: vennfan-0.0.6-py3-none-any.whl
- Upload date:
- Size: 39.8 kB
- Tags: Python 3
- Uploaded using Trusted Publishing? No
- Uploaded via:
twine/6.2.0 CPython/3.12.12
File hashes
| Algorithm | Hash digest | |
|---|---|---|
| SHA256 |
c3f401b5474e111060d21ac12fc67b6b3b21dd34d963967ecaeb8f771aff2d4d
|
|
| MD5 |
0cee534673e79d0a4196fb66cb4d5d69
|
|
| BLAKE2b-256 |
a00840c55ad6882c5b2497297b7d30dd7af9c1542920f0f50abcd83cd94db2d0
|














