
A lightweight GUI to browse and interact with HDF5 file structures
Verified details
These details have been verified by PyPIProject links
GitHub Statistics
Maintainers

Reason this release was yanked:
Broken package
Project description
vibehdf5 - HDF5 File Viewer & Manager
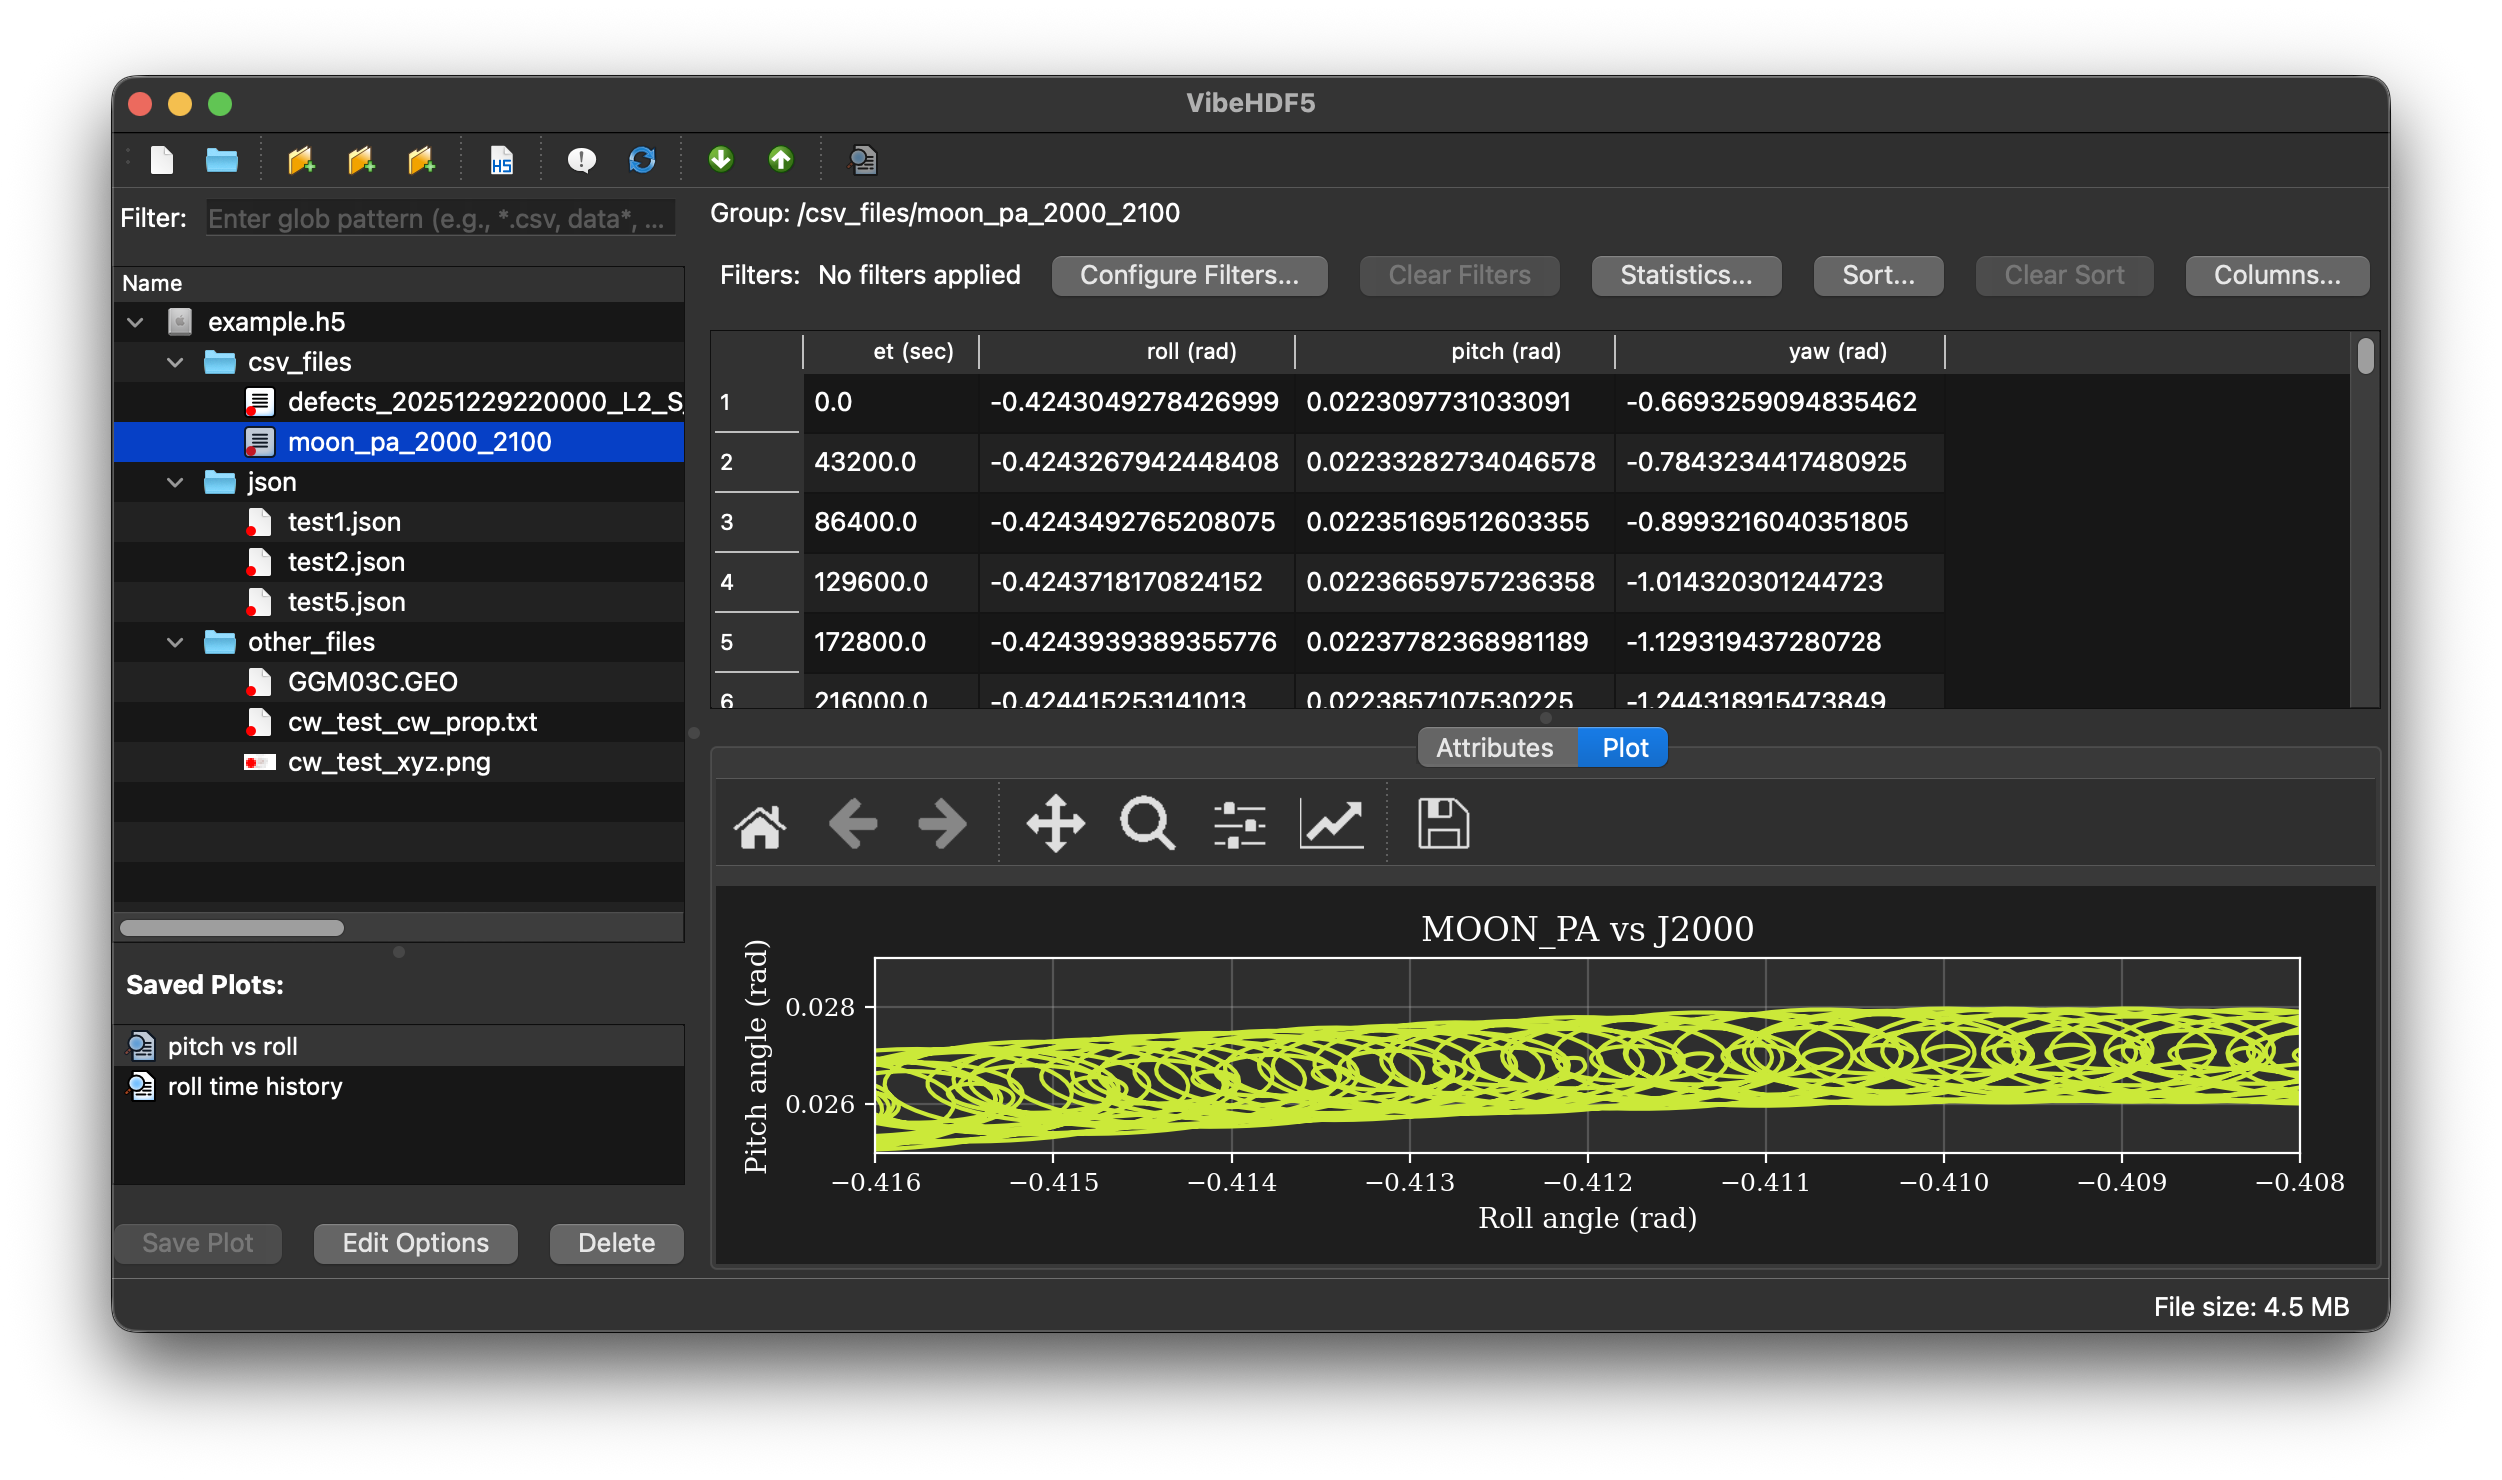






A powerful, lightweight GUI application for browsing, managing, and visualizing HDF5 file structures. Built with PySide6, it provides an intuitive tree-based interface for exploring groups, datasets, and attributes, with advanced features for content management and data preview.
Features
🔍 Browse & Explore
- Hierarchical Tree View: Navigate HDF5 file structure with expandable groups and datasets
- Dataset Information Dialog: Right-click any dataset to view comprehensive details including shape, dtype, size, compression ratio, chunking, filters, attributes, and statistics
- Attribute Display: Browse attributes attached to groups and datasets
- Sorting & Search: Sort tree columns and quickly locate items
- Visual Icons: Toolbar with standard system icons for intuitive navigation
📊 Data Preview
- Text Preview: View dataset contents as text with automatic truncation for large data
- Syntax Highlighting: Automatic color-coded syntax for Python, JavaScript, C/C++, Fortran, JSON, YAML, XML, HTML, CSS, Markdown, and more
- Image Display: Automatic PNG image rendering for datasets with
.pngextension - Smart Scaling: Images scale automatically to fit the preview panel while maintaining aspect ratio
- Binary Data Handling: Hex dump preview for non-text binary datasets
- Variable-Length Strings: Proper handling of HDF5 variable-length string datasets
- Extensible Language Support: Easy to add support for additional programming languages
📈 CSV Data, Filtering & Plotting
- CSV Import: Import CSV files as HDF5 groups with one dataset per column and native gzip compression for space efficiency
- Table Display: View CSV data in an interactive table with column headers
- Column Visibility: Show/hide columns with settings saved in HDF5
- Unique Values: Right-click column headers to view unique values in filtered data
- Column Filtering: Apply multiple filters to CSV tables (==, !=, >, >=, <, <=, contains, startswith, endswith)
- Filter Persistence: Filters are automatically saved in the HDF5 file and restored when reopening
- Multi-Column Sorting: Sort CSV data by multiple columns with ascending/descending options
- Sort Persistence: Sort configurations are saved in the HDF5 file and restored when reopening
- Column Statistics: View statistical summaries (count, min, max, mean, median, std dev, sum, unique values) for filtered data
- Saved Plot Configurations: Save multiple plot configurations per CSV group with customizable styling
- Interactive Plotting: Embedded matplotlib plots with full navigation toolbar (zoom, pan, save)
- Plot Management: Create, edit, rename, duplicate, delete, and instantly switch between saved plot configurations
- Plot Export: Drag-and-drop plots to filesystem or batch export all plots to a folder
- Advanced Plot Styling: Axis limits, logarithmic scales, reference lines, dark background, custom fonts
- Series Customization: Configure line color, style, marker type, line width, marker size, and smoothing for each data series
- Figure Configuration: Set output resolution (DPI), figure size, and export format (PNG, PDF, SVG, EPS)
- Plot Persistence: All plot configurations stored in HDF5 with efficient range compression for filtered indices (up to 100% space savings)
- Export Filtered Data: Drag-and-drop CSV export includes only filtered rows and visible columns
- Filter Management: Configure, clear, and view active filters with real-time table updates
- Independent Settings: Each CSV group maintains its own filters, sort configurations, column visibility, and plot configurations
✏️ Content Management
- Add Files: Import individual files into the HDF5 archive via toolbar or drag-and-drop
- Add Folders: Import entire directory structures with hierarchy preservation
- Delete Items: Remove datasets, groups, or attributes via right-click context menu
- Drag & Drop Import: Drag files or folders from your file manager directly into the tree
- Smart Target Selection: Automatically determines the correct group for imported content based on selection
- Overwrite Protection: Confirmation prompts when importing would overwrite existing data
- Exclusion Filters: Automatically skips system files (.DS_Store, .git, etc.)
📤 Export & Extract
- Drag Out: Drag datasets or groups from the tree to export to your filesystem
- Dataset Export: Datasets saved as individual files
- Group Export: Groups exported as folders with complete hierarchy
- Format Preservation: Text datasets saved as UTF-8, binary data preserved exactly
🎨 User Interface
- Split Panel Layout: Adjustable splitter between tree view and preview panel
- Recent Files: Quick access to recently opened files via File menu
- Adjustable Font Size: Increase/decrease GUI font size with Ctrl+/Ctrl- keyboard shortcuts
- Toolbar Actions: Quick access to common operations
- Keyboard Shortcuts:
Ctrl+N: Create new HDF5 fileCtrl+O: Open HDF5 fileCtrl+Shift+F: Add filesCtrl+Shift+D: Add folderCtrl++: Increase GUI font sizeCtrl+-: Decrease GUI font sizeCtrl+0: Reset GUI font sizeCtrl+Q: Quit
- Status Bar: Real-time feedback on operations
- Alternating Row Colors: Enhanced readability
Installation
Note that vibehdf5 requires a Qt library (PyQt6 or PySide6) to also be installed.
Using pip
pip install vibehdf5 PySide6
Using conda
conda install vibehdf5 pyside6
Using pixi
pixi add pyside6 vibehdf5
Documentation
Full documentation is available online at:
- GitHub Pages: https://jacobwilliams.github.io/vibehdf5/
To build the documentation locally (using Sphinx) use make html in the docs/ directory.
From Source
git clone https://github.com/jacobwilliams/vibehdf5.git
cd vibehdf5
pip install -e .
Using pixi (for development)
pixi shell --manifest-path ./env/pixi.toml
Usage
Launch the Application
After installation, launch from the command line:
vibehdf5
Or open a specific file:
vibehdf5 /path/to/your/file.h5
From Python
Run directly from source:
python -m vibehdf5 [file.h5]
Working with Files
Creating New Files
- Click New HDF5 File… in the toolbar or press
Ctrl+N - Choose a location and filename (
.h5extension added automatically if not provided) - If the file already exists, you'll be prompted to confirm overwrite
- The new empty HDF5 file is created and loaded in the viewer
- You can immediately start adding content via the methods below
Opening Files
- Click Open HDF5… in the toolbar or press
Ctrl+O - Select an HDF5 file (.h5 or .hdf5)
- The tree will populate with the file structure
- Recently opened files appear in File > Open Recent menu for quick access
- Clear recent files list via File > Open Recent > Clear Recent Files
Adding Content
Add Individual Files:
- Click Add Files… in the toolbar or press
Ctrl+Shift+F - Select one or more files
- Files are added to the currently selected group (or root if none selected)
Add Folders:
- Click Add Folder… or press
Ctrl+Shift+D - Select a directory
- The entire folder structure is recursively imported
Drag & Drop:
- Drag files or folders from your file manager
- Drop onto any group, dataset, or attribute in the tree
- Content is automatically added to the appropriate location
Deleting Content
- Right-click on a dataset, group, or attribute
- Select the delete option from the context menu
- Confirm the deletion
Warning: Deletions are permanent and modify the HDF5 file immediately.
Exporting Content
- Drag any dataset or group from the tree to your file manager
- Datasets are extracted as individual files
- Groups are extracted as folders with full hierarchy
Viewing Data
- Click any dataset to see a preview in the right panel
- PNG images are automatically rendered
- Text data displays with syntax highlighting
- Binary data shows as hex dump
Dataset Information:
- Right-click any dataset in the tree
- Select Dataset Information...
- View comprehensive details in a modal dialog:
- Basic Info: Shape, dtype, number of elements, memory size
- Storage: Actual storage size, compression ratio (if compressed)
- Chunking: Whether data is chunked and chunk dimensions
- Compression: Type (gzip, lzf, etc.) and compression level
- Filters: Scale-offset, shuffle, fletcher32 checksum
- Fill Value: Default value for uninitialized data
- Attributes: All custom attributes with values
- Statistics: Min, max, mean, standard deviation (for small numeric datasets)
- External Storage: External file information if applicable
- Dimensions: Detailed breakdown for multi-dimensional datasets
Working with CSV Data
Importing CSV Files:
- Use Add Files… or drag-and-drop to import a CSV file
- CSV files are automatically converted to HDF5 groups with:
- One dataset per column preserving data types
- Native gzip compression (level 6 for text, level 4 for numeric data)
- Automatic chunking for optimal performance
- Column names stored as group attributes
- Source file metadata for reference
- Typical space savings: 50-90% depending on data patterns
Viewing CSV Tables:
- Click on a CSV group in the tree (marked with
source_type='csv'attribute) - Data displays as an interactive table with column headers
- Select multiple columns (Ctrl/Cmd+Click) for analysis
Filtering CSV Data:
- Click Configure Filters… above the table
- Add filter conditions:
- Select column name
- Choose operator (==, !=, >, >=, <, <=, contains, startswith, endswith)
- Enter value to compare against
- Add multiple filters (combined with AND logic)
- Filters are automatically saved to the HDF5 file
- Click Clear Filters to remove all filters
Filter Features:
- Filters persist when closing and reopening files
- Each CSV group has independent filters
- Numeric comparisons (>, >=, <, <=) automatically convert values
- String operations (contains, startswith, endswith) for text data
- Date/time comparisons for string columns (automatically detects date formats)
- Real-time table updates when filters change
- Status shows "X filter(s) applied" and filtered row count
Sorting CSV Data:
- Click Sort… above the table
- Add sort columns in order of priority:
- Select column name
- Choose Ascending or Descending order
- Use up/down arrows to reorder sort priority
- First column is primary sort, second breaks ties, etc.
- Sort configurations are automatically saved to the HDF5 file
- Click Clear Sort to restore original row order
Sort Features:
- Multi-column sorting with configurable priority
- Independent sort order (ascending/descending) per column
- Sort persists when closing and reopening files
- Each CSV group has its own sort configuration
- Sorting respects active filters (sorts filtered data)
- Works with numeric, string, and mixed-type columns
Column Visibility:
- Click Columns… above the table to control which columns are displayed
- Choose "Show All Columns" or "Show Selected Columns"
- Check/uncheck columns to show or hide them in the table
- Visibility settings are automatically saved to the HDF5 file
- Hidden columns are excluded from drag-and-drop CSV exports
- Each CSV group maintains independent visibility settings
Unique Values:
- Right-click on any column header in the CSV table
- Select Show Unique Values in '[column name]'
- View all unique values in a sortable dialog
- Shows count of unique values for quick data inspection
- Respects active filters (shows unique values from filtered data only)
Column Statistics:
- Click Statistics… above the table to view column summaries
- Statistics computed for filtered data only
- Shows for each column:
- Count: Number of valid values
- Min/Max: Minimum and maximum values
- Mean: Average (numeric columns only)
- Median: Middle value (numeric columns only)
- Std Dev: Standard deviation (numeric columns only)
- Sum: Total (numeric columns only)
- Unique Values: Count of distinct values
- String columns show Count, Min, Max, and Unique Values only
Plotting Filtered Data:
- Select 2 or more columns in the table (Ctrl/Cmd+Click)
- Click Save Plot to create a new plot configuration
- Enter a name for the plot (e.g., "Temperature vs Time")
- The plot appears in the Saved Plots list below the tree view
- Select any saved plot to instantly display it in the Plot tab
- Only filtered/visible rows are plotted
- Plot title shows filter status (e.g., "150/1000 rows, filtered")
Managing Saved Plots:
- Saved Plots List: All plot configurations appear below the tree view
- Auto-Apply: Click any plot in the list to instantly display it
- Edit Options: Click Edit Options to customize plot styling
- Delete: Click Delete or right-click to remove a plot configuration
- Rename: Double-click a plot name to rename it inline
- Duplicate: Right-click and select Duplicate to create a copy with different settings
- Export Single Plot: Drag a plot from the list to your file manager to export as image
- Export All Plots: Right-click and select Export All Plots to batch export to a folder
- Copy JSON: Right-click and select Copy Plot JSON to copy configuration to clipboard
- Persistence: All plots are saved in the HDF5 file and restored on reopening
Customizing Plot Appearance:
- Select a saved plot and click Edit Options
- General Tab:
- Change plot name
- Set custom plot title (or leave blank for auto-generated)
- Set X-axis and Y-axis labels (or leave blank for column names)
- Toggle grid and legend on/off
- Enable dark background for better visibility
- Set axis limits (X min/max, Y min/max) or leave blank for auto
- Configure figure size (width and height in inches)
- Set export DPI (resolution for saved images)
- Choose export format: PNG, PDF, SVG, or EPS
- Fonts & Styling Tab:
- Set font sizes for title, axis labels, tick labels, and legend
- Enable logarithmic scale for X and/or Y axes
- Add horizontal and vertical reference lines with custom colors
- Series Styles Tab:
- Configure each data series independently
- Choose from 10 colors: blue, red, green, orange, purple, brown, pink, gray, olive, cyan
- Select line style: Solid, Dashed, Dash-dot, Dotted, or None
- Choose marker: Circle, Square, Triangle, Diamond, Star, Plus, X, Point, or None
- Adjust line width (0.5 to 5.0)
- Set marker size (1.0 to 20.0)
- Apply smoothing (moving average) with configurable window size
- Click OK to apply changes - the plot updates immediately
Plot Features:
- Interactive Navigation: Full matplotlib toolbar with zoom, pan, reset, and save-to-file
- Multi-Series Support: Plot multiple Y columns against a single X column
- Data Range Selection: Plots use the current filtered data and row range
- Embedded Display: Plots appear in a dedicated tab in the main window
- Quick Switching: Instantly switch between different plot configurations
- Format Preservation: All styling settings persist with the HDF5 file
Exporting Filtered Data:
- Drag CSV group from tree to your file manager
- Exported CSV file contains only filtered rows
- If no filters are active, all rows are exported
- Original column names and order are preserved
Data Storage
Text Files:
- Stored as UTF-8 encoded string datasets using
h5py.string_dtype(encoding='utf-8')
Binary Files:
- Stored as 1D uint8 arrays using
np.frombuffer(data, dtype='uint8') - Ensures proper preservation of binary content (PNG images, etc.)
CSV Data:
- String columns: gzip compression level 6 with automatic chunking
- Numeric columns: gzip compression level 4 with automatic chunking
- Chunk size: min(10000, data_length) for datasets > 1000 rows
- Filtered plot indices: Compact range format (e.g., '0-9999' instead of 10000 individual indices)
- Range compression provides up to 100% space savings for consecutive indices
Directory Structure:
- Folders map to HDF5 groups
- File hierarchy is preserved in group paths
- Excluded items (.git, .DS_Store, etc.) are automatically skipped
Dependencies
- Python ≥ 3.8
- qtpy - Qt abstraction layer for PySide6/PyQt6 compatibility
- PySide6 or PyQt6 (via qtpy abstraction)
- h5py - HDF5 interface
- numpy - Array operations
- pandas - CSV import and data filtering
- matplotlib - Plotting (optional, for CSV plotting features)
Icons
Some icons obtained from https://www.flaticon.com -- see icons.md for full attributions.
Tips & Best Practices
Performance
- The viewer loads the entire tree structure on open
- For very large files (thousands of items), initial load may take a few seconds
- Preview panel limits displayed content to 1 MB by default
- CSV tables with many columns may take time to populate initially
- Filters are applied in-memory for fast updates
File Organization
- Use descriptive group names to organize related datasets
- Store metadata as attributes rather than separate datasets when appropriate
- For binary files like images, use extensions in dataset names (.png, .jpg) to enable preview features
- Import related CSV files to keep tabular data organized
CSV Data Management
- Filters are stored as JSON in the
csv_filtersattribute of CSV groups - Plot configurations are stored as JSON in the
saved_plotsattribute of CSV groups - Each CSV group maintains independent filter state and plot configurations
- Large CSV files (10,000+ rows) display efficiently with filtered views
- Use filters before plotting or exporting to work with specific data subsets
- Column data types are preserved during import (numeric, string, etc.)
- Create multiple plot views of the same data with different styling and filters
Workflow Integration
- Use drag-and-drop to quickly archive project files
- Export specific datasets for analysis in other tools
- Delete temporary or obsolete data to keep archives clean
- Apply filters to CSV data before exporting for downstream analysis
- Create multiple filtered views of the same data by duplicating CSV groups
- Save plot configurations to quickly regenerate visualizations
- Use plot styling to create publication-ready figures directly from HDF5 data
- Share HDF5 files with embedded plots and filters for reproducible analysis
Development
Launching from the pixi environment
pixi shell --manifest-path ./env/pixi.toml
python -m vibehdf5
Running Tests
# From the project root
pytest tests/
Code Style
# Format with ruff
ruff format vibehdf5/

# Lint
ruff check vibehdf5/
Building Package
python -m build
Building Standalone Executable [EXPERIMENTAL]
Create a standalone executable that doesn't require Python to be installed:
# Install PyInstaller (if not already installed)
pip install pyinstaller

# Run the build script
./build_executable.sh
Output locations:
- macOS:
dist/vibehdf5.app(application bundle) - Linux:
dist/vibehdf5(single executable) - Windows:
dist/vibehdf5.exe(single executable)
Distribution:
- macOS:
open dist/vibehdf5.appor copy to/Applications/ - Linux:
./dist/vibehdf5or copy to/usr/local/bin/ - Windows: Run
dist\vibehdf5.exeor copy to desired location
For detailed instructions, customization options, and troubleshooting, see BUILD_EXECUTABLE.md.
Note: PyInstaller does not support cross-compilation. Build on the target platform.
Acknowledgments
Built with:
- h5py - Pythonic interface to HDF5
- PySide6 - Python bindings for Qt
- NumPy - Numerical computing library
- Pandas - Data analysis and manipulation tool
Similar projects
- HDFView -- the official HDF5 viewer (Java)
- hdf5view
- hdf5-viewer
- argos
Other links
Project details
Verified details
These details have been verified by PyPIProject links
GitHub Statistics
Maintainers
Release history Release notifications | RSS feed


Download files
Download the file for your platform. If you're not sure which to choose, learn more about installing packages.
Source Distribution
Built Distribution
Filter files by name, interpreter, ABI, and platform.
If you're not sure about the file name format, learn more about wheel file names.
Copy a direct link to the current filters
File details
Details for the file vibehdf5-2.1.0.tar.gz.
File metadata
- Download URL: vibehdf5-2.1.0.tar.gz
- Upload date:
- Size: 171.3 kB
- Tags: Source
- Uploaded using Trusted Publishing? Yes
- Uploaded via: twine/6.1.0 CPython/3.13.7
File hashes
| Algorithm | Hash digest | |
|---|---|---|
| SHA256 |
c6324d358c3362883497ed9df2a2bf1f63f627f0e6496e02b380400a73bc6b88
|
|
| MD5 |
d471b6c95452abf7e3b8178f43fbcc9d
|
|
| BLAKE2b-256 |
6cfc0769641a6ec99725d5a31411a726bd212d7cb32abed57a8f49bdcfcc1986
|
Provenance
The following attestation bundles were made for vibehdf5-2.1.0.tar.gz:
Publisher:
publish.yml on jacobwilliams/vibehdf5
-
Statement:
-
Statement type:
https://in-toto.io/Statement/v1 -
Predicate type:
https://docs.pypi.org/attestations/publish/v1 -
Subject name:
vibehdf5-2.1.0.tar.gz -
Subject digest:
c6324d358c3362883497ed9df2a2bf1f63f627f0e6496e02b380400a73bc6b88 - Sigstore transparency entry: 731860214
- Sigstore integration time:
-
Permalink:
jacobwilliams/vibehdf5@ca8af8353f703b82494d6e69eec0a26c6abb348c -
Branch / Tag:
refs/tags/2.1.0 - Owner: https://github.com/jacobwilliams
-
Access:
public
-
Token Issuer:
https://token.actions.githubusercontent.com -
Runner Environment:
github-hosted -
Publication workflow:
publish.yml@ca8af8353f703b82494d6e69eec0a26c6abb348c -
Trigger Event:
release
-
Statement type:
File details
Details for the file vibehdf5-2.1.0-py3-none-any.whl.
File metadata
- Download URL: vibehdf5-2.1.0-py3-none-any.whl
- Upload date:
- Size: 178.7 kB
- Tags: Python 3
- Uploaded using Trusted Publishing? Yes
- Uploaded via: twine/6.1.0 CPython/3.13.7
File hashes
| Algorithm | Hash digest | |
|---|---|---|
| SHA256 |
7a0dbb9b65efd4a0f38662f7b46c68b5501625a1f77cf06c3ab6fb51a7e58df4
|
|
| MD5 |
b82776cbcf31e3a4951821b46e69bebc
|
|
| BLAKE2b-256 |
d68acb94f82f8010dd6723211ee3c98f20b47085e48429d8f4204541f24fea97
|
Provenance
The following attestation bundles were made for vibehdf5-2.1.0-py3-none-any.whl:
Publisher:
publish.yml on jacobwilliams/vibehdf5
-
Statement:
-
Statement type:
https://in-toto.io/Statement/v1 -
Predicate type:
https://docs.pypi.org/attestations/publish/v1 -
Subject name:
vibehdf5-2.1.0-py3-none-any.whl -
Subject digest:
7a0dbb9b65efd4a0f38662f7b46c68b5501625a1f77cf06c3ab6fb51a7e58df4 - Sigstore transparency entry: 731860220
- Sigstore integration time:
-
Permalink:
jacobwilliams/vibehdf5@ca8af8353f703b82494d6e69eec0a26c6abb348c -
Branch / Tag:
refs/tags/2.1.0 - Owner: https://github.com/jacobwilliams
-
Access:
public
-
Token Issuer:
https://token.actions.githubusercontent.com -
Runner Environment:
github-hosted -
Publication workflow:
publish.yml@ca8af8353f703b82494d6e69eec0a26c6abb348c -
Trigger Event:
release
-
Statement type:






