
Librería de visualización adaptable para HTML, Dashboards y PDFs en Python

Project description
📦 ViewX — v2.1
ViewX es un paquete moderno de Python diseñado para generar páginas HTML interactivas, dashboards dinámicos y visualizaciones inteligentes que se adaptan automáticamente a los objetos agregados por el usuario.
Este proyecto ofrece una solución ligera, intuitiva y escalable, ideal para crear interfaces visuales llamativas sin depender de frameworks pesados… aunque una parte se encuentra basada en Streamlit mediante dependencias opcionales.
✨ Características principales
- ⚡ Rápido y minimalista: cero dependencias pesadas por defecto.
- 🧩 API intuitiva: crea páginas y dashboards en segundos.
- 📐 Diseño adaptativo: cada componente se acomoda automáticamente.
- 🌐 Modo HTML: genera páginas
.htmltotalmente autónomas. - 📊 Modo Dashboard: plantillas escalables con soporte opcional para Streamlit/Dash.
- 🛠️ Extensible: añade tus propias plantillas y módulos personalizados.
- 🔮 Visión a futuro: pensado para expandirse a interfaces inteligentes.
Instalacion
pip install viewx
🚀 Ejemplo rápido
Crear una página HTML
import pandas as pd
from viewx.HTML import HTML

# 1. Crear datos de ejemplo
df_ventas = pd.DataFrame({
    'Mes': ['Ene', 'Feb', 'Mar', 'Abr', 'May', 'Jun', 'Jul', 'Ago', 'Sep', 'Oct', 'Nov', 'Dic'],
    'Ventas': [120, 135, 148, 170, 195, 210, 245, 268, 290, 310, 335, 400],
    'Beneficio': [30, 35, 42, 51, 58, 63, 73, 80, 87, 93, 100, 120],
    'Clientes': [45, 48, 52, 58, 65, 72, 80, 88, 95, 102, 110, 125]
})

# Datos para gráfico de barras
df_productos = pd.DataFrame({
    'Producto': ['Producto A', 'Producto B', 'Producto C', 'Producto D', 'Producto E'],
    'Ventas': [450, 320, 280, 190, 150]
})

# Datos para scatter
df_clientes = pd.DataFrame({
    'Edad': [25, 32, 28, 45, 38, 29, 51, 42, 35, 30],
    'Gasto': [120, 200, 150, 300, 250, 180, 400, 320, 220, 160],
    'Segmento': ['Joven', 'Adulto', 'Joven', 'Senior', 'Adulto', 'Joven', 'Senior', 'Adulto', 'Adulto', 'Joven']
})

# 2. Configurar el dashboard
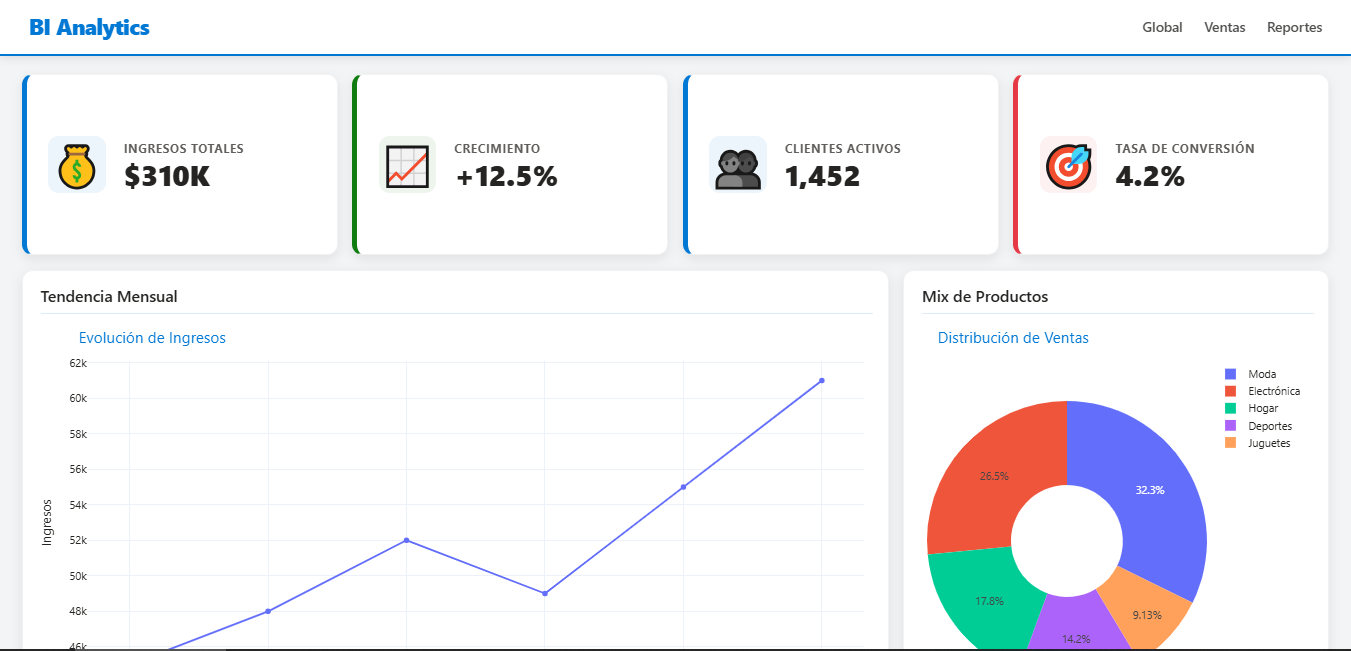
dashboard = HTML(
    title="📊 Dashboard Ejecutivo - Demo",
    theme="corporate_blue",  # Temas: corporate_blue, dark_enterprise, modern_green, void_indigo, glass_ocean, cyberpunk_neon
    cols=12,  # Grid de 12 columnas
    rows=12,  # 12 filas de altura
    gap=16,
    padding=20,
    navbar={
        "title": "📈 ViewX PRO",
        "items": [
            {"label": "Inicio", "link": "#"},
            {"label": "Ventas", "link": "#"},
            {"label": "Clientes", "link": "#"},
            {"label": "Reportes", "link": "#"}
        ]
    }
)

# 3. Añadir componentes (row, col, height, width)
# Fila 1: KPIs
dashboard.add_valuebox("Ventas Totales", "$2.8M", "💰", row=1, col=1, height=2, width=3)
dashboard.add_valuebox("Beneficio Neto", "$942K", "📈", "#00A86B", row=1, col=4, height=2, width=3)
dashboard.add_valuebox("Clientes Activos", "1,247", "👥", "#FF6B35", row=1, col=7, height=2, width=3)
dashboard.add_valuebox("Tasa Conversión", "24.5%", "🎯", "#9B59B6", row=1, col=10, height=2, width=3)

# Fila 2-5: Gráfico de líneas (ventas mensuales) - Método sencillo con datos
dashboard.add_chart(
    data=df_ventas,
    chart_type="line",
    x="Mes",
    y="Ventas",
    title="📈 Evolución de Ventas 2024",
    row=3, col=1, height=10, width=6
)

# Fila 2-5: Gráfico de barras (productos) - Otro ejemplo sencillo
dashboard.add_chart(
    data=df_productos,
    chart_type="bar",
    x="Producto",
    y="Ventas",
    title="🏷️ Ventas por Producto",
    row=3, col=7, height=10, width=6
)

# 4. Generar el archivo
dashboard.generate("mi_dashboard.html")
Crear un DashBoard
from viewx.DashBoard import DashBoard
from viewx.datasets import load_dataset

df = load_dataset("iris.csv")

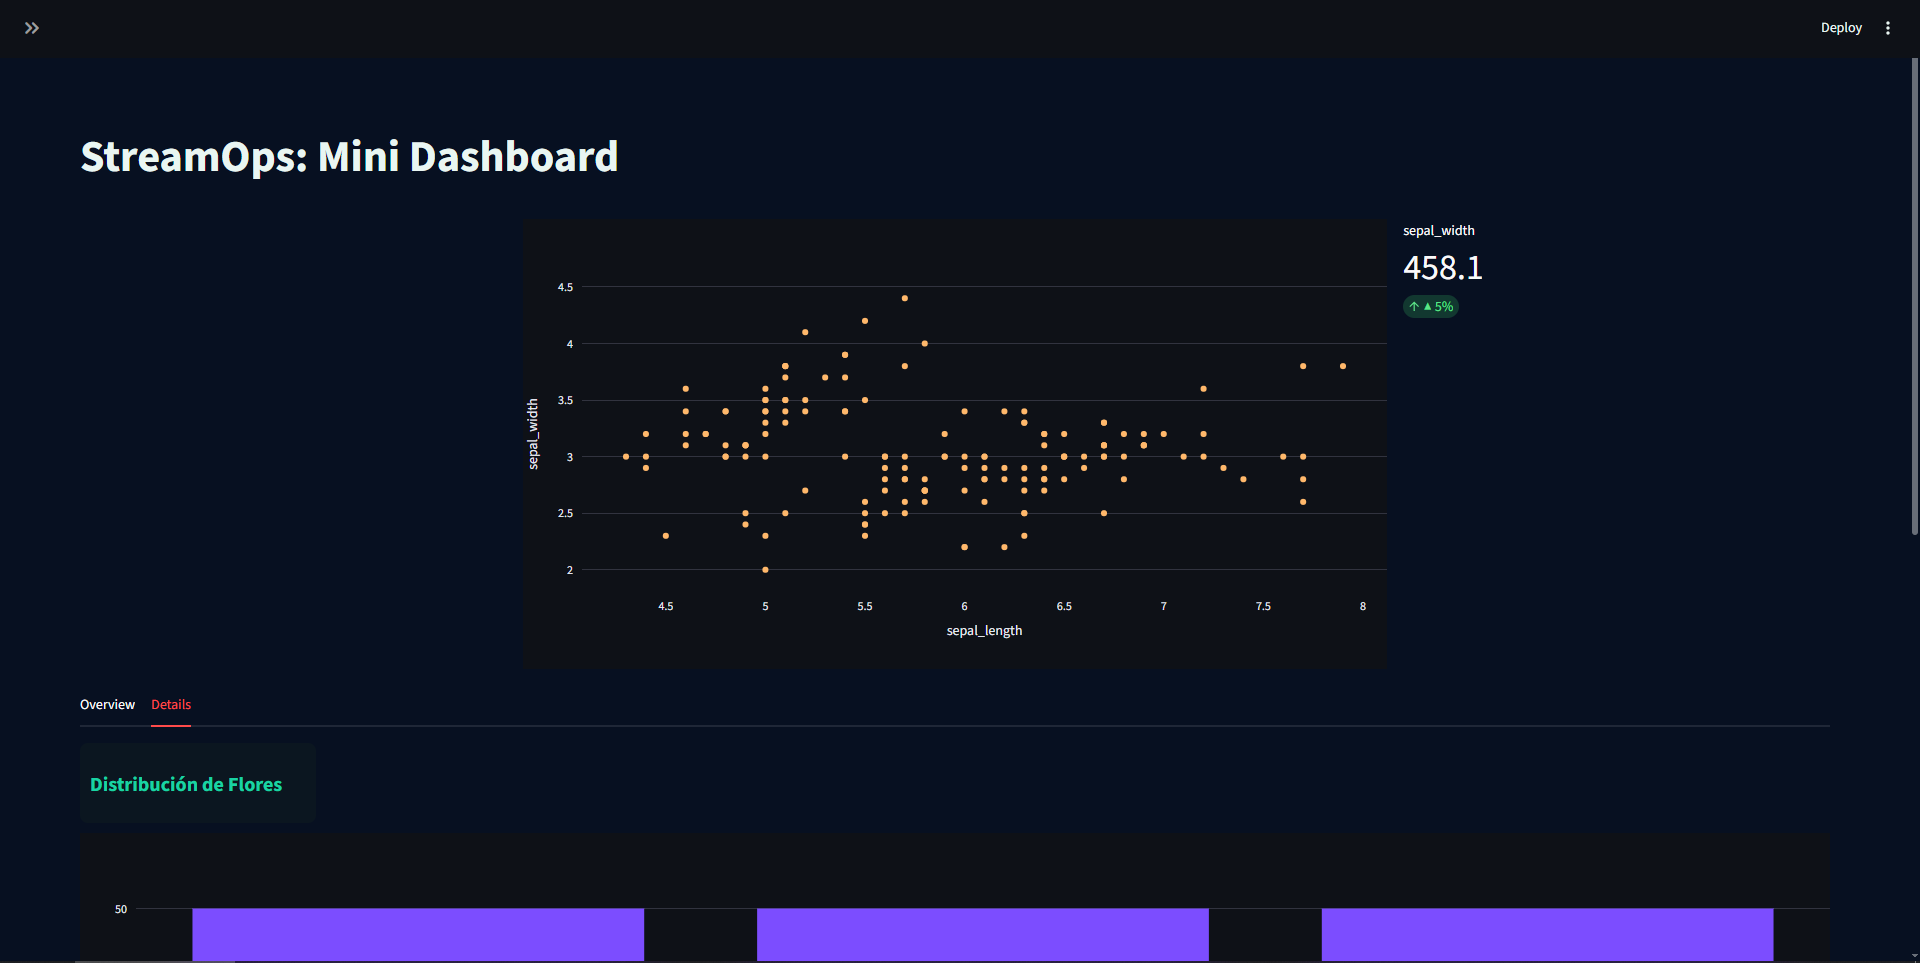
db = DashBoard(df, title="StreamOps: Mini Dashboard", title_align="center")
db.set_theme(background="#071021", text="#E9F6F2", primary="#19D3A3", card="#0b1620")
# Sidebar
db.add_sidebar(db.comp_text("Parámetros del reporte"))
db.add_sidebar(db.comp_metric("Longitud del dataset", df.shape[0]))
db.add_sidebar(db.comp_metric("Cantidad de Flores", df["species"].unique().shape[0]))
# Main layout
db.add_blank()
db.add_row(
    col_widths=[1, 2, 1],
    components=[
        db.comp_blank(),
        db.comp_plot(x="sepal_length", y="sepal_width", kind="scatter", color="#FFB86B"),
        db.comp_metric("sepal_width", df["sepal_width"].sum(), delta="▲ 5%")
    ]
)

db.add_tabs({
    "Overview": [
        db.comp_title("Resumen por Región"),
        db.comp_table()
    ],
    "Details": [
        db.comp_title("Distribución de Flores"),
        db.comp_plot(x="species", y=None, kind="hist", color="#7C4DFF")
    ]
})

db.add_expander("Detalles técnicos", [
    db.comp_text("Este panel fue generado automáticamente."),
    db.comp_text("Metadata: filas=" + str(len(df)), size="12px")
], expanded=True)

db.run(open_browser=True)
Crear una Presentacion
from viewx.Slides import (
    Presentation, Slide, Grid,
    Title, Subtitle, Text, BulletList,
    BarPlot, PiePlot, IconStat, RotatingIcon, MovingFigure,
    Button, Link
)

pres = Presentation("Demo Viewx.Slides", theme="dark")
pres.font("Inter").meta(author="Viewx", date="2026")

with Slide(title="Bienvenida al Motor", index=1, notes="Slide de portada del motor Viewx.Slides."):
    Title("Slides Engine v1.0").center("x").pos(top=10).zoom_in(duration=1.2)
    Subtitle("Framework de presentaciones dinámicas en Python").center("x").pos(top=26).slide_in("right")
    Text(
        "Este motor permite crear presentaciones HTML interactivas de forma programática, con posicionamiento, dimensiones, animaciones y componentes reutilizables.",
        color="#ffffff",
    ).center("x").pos(top=42).size(width="68%").align("center").fade_in(delay=0.3)
    RotatingIcon("gear", size=64, color="#00f2ff").pos(right=6, top=8)
    MovingFigure("circle", color="rgba(0,242,255,.22)", size=180, path="drift").pos(left=8, bottom=10).z(1)
    Button("Ver GitHub", href="https://github.com/").center("x").pos(top=68).fade_in(delay=0.55)

with Slide(title="Componentes", index=2, bg="linear-gradient(135deg,#111827,#312e81)"):
    Title("Componentes incluidos").pos(left=6, top=8).slide_in("left")
    BulletList([
        "Textos, títulos, subtítulos y listas.",
        "Imágenes, vídeos, hipervínculos y botones.",
        "Estadísticas con iconos y figuras animadas.",
        "Gráficos interactivos basados en Plotly.",
    ]).pos(left=8, top=30).size(width="48%")
    with Grid(columns=3, gap=18).pos(left=58, top=26).size(width="36%"):
        IconStat("check", "12+", "Componentes")
        IconStat("chart", "4", "Gráficos")
        IconStat("bolt", "CSS", "Animaciones")
    Link("Ir a la portada", href="#").pos(left=8, bottom=12).link_to_slide(1)

with Slide(title="Gráficos", index=3):
    Title("Plotly integrado").pos(left=6, top=7).zoom_in()
    Text("Los gráficos se exportan como HTML interactivo usando Plotly por CDN.").pos(left=7, top=22).size(width="42%")
    BarPlot(["A", "B", "C", "D"], [24, 38, 31, 45], title="BarPlot").pos(left=7, top=38).size(width="40%", height="42%")
    PiePlot(["Python", "HTML", "CSS"], [55, 30, 15], title="PiePlot", hole=0.35).pos(left=54, top=25).size(width="38%", height="52%")

path = pres.export("viewx_slides_demo.html")
print(path)
Crear un Reporte
from viewx.datasets import load_dataset
import seaborn as sns
import matplotlib.pyplot as plt

# ===============================
# 1️⃣ CREAR REPORTE
# ===============================
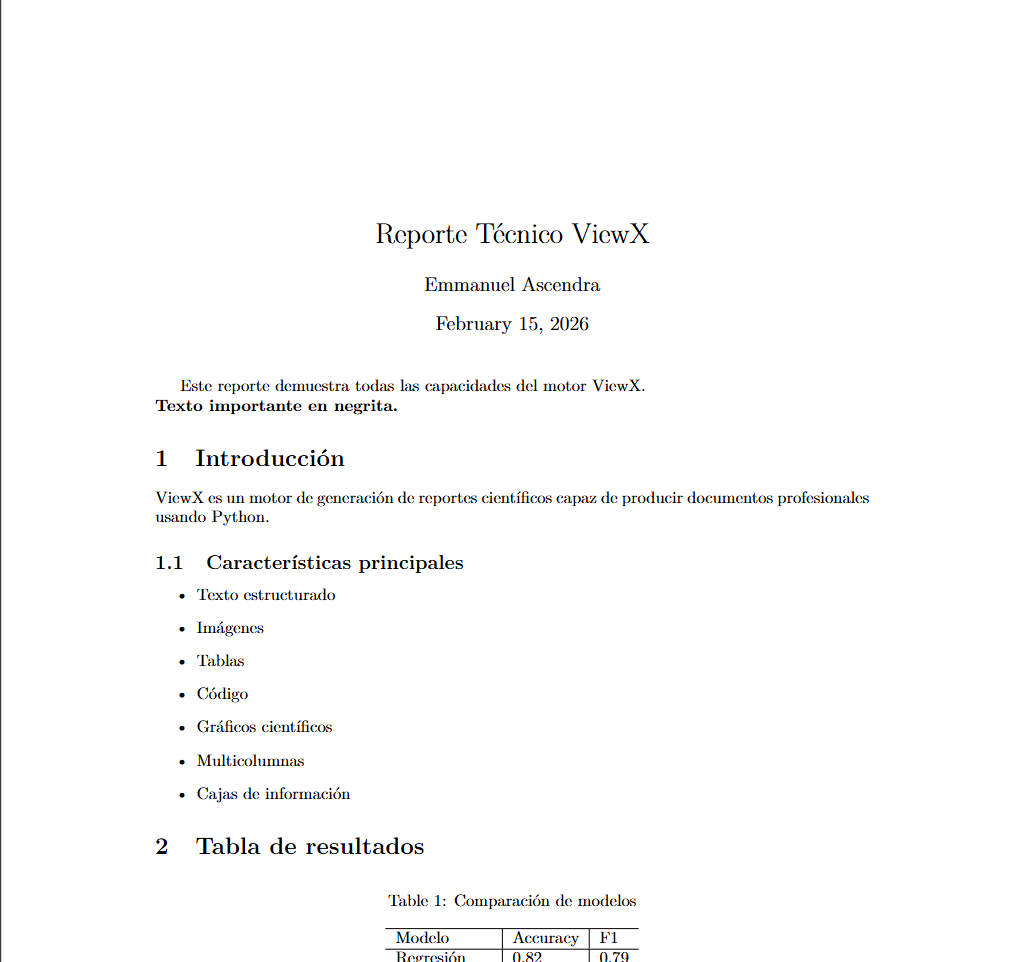
r = Report(
    title="Reporte Técnico ViewX",
    author="Emmanuel Ascendra"
)

# ===============================
# 2️⃣ TEXTO
# ===============================
r.add_text("Este reporte demuestra todas las capacidades del motor ViewX.\n")
r.add_text("Texto importante en negrita.", bold=True)

# ===============================
# 3️⃣ SECCIONES
# ===============================
with r.doc.create(r.add_section("Introducción")):
    r.add_text(
        "ViewX es un motor de generación de reportes científicos "
        "capaz de producir documentos profesionales usando Python."
    )

# ===============================
# 4️⃣ SUBSECCIÓN
# ===============================
with r.doc.create(r.add_subsection("Características principales")):
    r.add_itemize([
        "Texto estructurado",
        "Imágenes",
        "Tablas",
        "Código",
        "Gráficos científicos",
        "Multicolumnas",
        "Cajas de información"
    ])

# ===============================
# 5️⃣ TABLA
# ===============================
with r.doc.create(r.add_section("Tabla de resultados")):
    r.add_table(
        headers=["Modelo", "Accuracy", "F1"],
        rows=[
            ["Regresión", 0.82, 0.79],
            ["Árbol", 0.91, 0.88],
            ["Red neuronal", 0.94, 0.92],
        ],
        caption="Comparación de modelos"
    )

# ===============================
# 6️⃣ IMAGEN
# ===============================
with r.doc.create(r.add_section("Visualización")):
    r.add_image(
        path="assets/ejemplo.png",
        caption="Imagen de prueba",
        width="0.6\\linewidth"
    )

# ===============================
# 7️⃣ CÓDIGO
# ===============================
with r.doc.create(r.add_section("Código de ejemplo")):
    r.add_code("""
import numpy as np

x = np.linspace(0, 10, 50)
y = np.sin(x)
""")

# ===============================
# 8️⃣ MULTICOLUMNAS
# ===============================
with r.doc.create(r.add_section("Análisis en dos columnas")):
    r.begin_multicols(2)

    r.add_text(
        "Este bloque demuestra cómo dividir el contenido "
        "en múltiples columnas dentro del mismo documento."
    )

    r.add_itemize([
        "Ideal para papers",
        "Mejora lectura",
        "Ahorra espacio"
    ])

    r.end_multicols()

# ===============================
# 9️⃣ CAJA DESTACADA
# ===============================
with r.doc.create(r.add_section("Nota importante")):
    r.add_box(
        title="Observación clave",
        content="Todos los elementos se generan directamente desde Python.",
        color="green!20"
    )

# ===============================
# 🔟 GRÁFICO SIMPLE
# ===============================
with r.doc.create(r.add_section("Gráfico simple")):
    r.add_plot(
        x=[0, 1, 2, 3, 4],
        y=[0, 1, 4, 9, 16],
        caption="Crecimiento cuadrático"
    )

# ===============================
# 1️⃣1️⃣ MULTIGRÁFICO
# ===============================
with r.doc.create(r.add_section("Gráficos múltiples")):
    r.add_multiplot(
        plots=[
            ([0, 1, 2, 3], [0, 1, 4, 9]),
            ([0, 1, 2, 3], [0, 1, 8, 27]),
        ],
        caption="Comparación de funciones"
    )

# ===============================
# 1️⃣2️⃣ SALTO DE PÁGINA
# ===============================
r.new_page()
r.add_text("Contenido en una nueva página.")

# ===============================
# 1️⃣3️⃣ GENERAR PDF
# ===============================
r.build("reporte_demo")
Analizar Datos en DataMatrix
import pandas as pd
import numpy as np
from viewx.DataMatrix import DataMatrix

# 1. Crear un Dataset sintético que simule datos bibliométricos
data = {
    'Authors': [
        'Aria, M; Cuccurullo, C', 'Aria, M; Smith, J', 'Cuccurullo, C',
        'Doe, J', 'Smith, J; Doe, J', 'Aria, M', 'Brown, A', 'Brown, A; Smith, J',
        'Gomez, P', 'Gomez, P; Aria, M', 'Doe, J', 'White, S', 'White, S; Brown, A',
        'Black, R', 'Black, R; Gomez, P', 'Green, T', 'Green, T; Aria, M',
        'Doe, J', 'Smith, J', 'Cuccurullo, C'
    ],
    'Year': [2017, 2017, 2018, 2018, 2019, 2019, 2020, 2020, 2021, 2021, 2022, 2022, 2023, 2023, 2024, 2024, 2025, 2025, 2026, 2026],
    'Journal': [
        'Journal of Informetrics', 'Journal of Informetrics', 'Scientometrics',
        'Scientometrics', 'Nature', 'Nature', 'Science', 'Science',
        'Journal of Informetrics', 'Scientometrics', 'Nature', 'Science',
        'Journal of Informetrics', 'Scientometrics', 'Nature', 'Science',
        'Journal of Informetrics', 'Scientometrics', 'Nature', 'Science'
    ],
    'Citations': np.random.randint(0, 100, size=20),
    'Abstract': ['Resumen de prueba ' + str(i) for i in range(20)],
    'Keywords': ['bibliometrics; R', 'python; data science', 'metrics; science', 'analysis', 'data', 'python', 'r', 'metrics', 'science', 'mapping', 'analysis', 'data', 'python', 'r', 'metrics', 'science', 'mapping', 'analysis', 'data', 'python'],
    'Duplicate_Col': [1] * 20, # Columna constante para alerta
    'Missing_Col': [np.nan] * 15 + [1, 2, 3, 4, 5] # Columna con muchos nulos
}

df = pd.DataFrame(data)

# Añadir filas duplicadas para probar limpieza
df = pd.concat([df, df.iloc[:2]], ignore_index=True)

print("Dataset creado con", len(df), "filas.")

# 2. Usar DataMatrix
dm = DataMatrix(df)

# Limpiar datos
dm.clean_data(drop_duplicates=True, fill_na=True)

# Generar reporte
report_path = dm.generate_report("demo_datamatrix_report.html", title="Análisis Bibliométrico de Prueba")

print(f"Reporte generado exitosamente en: {report_path}")
🤝 Contribuciones
¡Todas las ideas, mejoras y plantillas son bienvenidas! ViewX está diseñado para crecer y evolucionar con la comunidad.
📬 Contacto:
Release history Release notifications | RSS feed


Download files
Download the file for your platform. If you're not sure which to choose, learn more about installing packages.
Source Distribution
Built Distribution
Filter files by name, interpreter, ABI, and platform.
If you're not sure about the file name format, learn more about wheel file names.
Copy a direct link to the current filters
File details
Details for the file viewx-0.2.1.tar.gz.
File metadata
- Download URL: viewx-0.2.1.tar.gz
- Upload date:
- Size: 4.7 MB
- Tags: Source
- Uploaded using Trusted Publishing? No
- Uploaded via: twine/6.2.0 CPython/3.13.7
File hashes
| Algorithm | Hash digest | |
|---|---|---|
| SHA256 |
c7e95cd51e281bf1cfca662b6e253987454ea1718cff0152c536cf0131833390
|
|
| MD5 |
67b8f456097a5b92cbfcd65bd1aa2b5f
|
|
| BLAKE2b-256 |
e02e335a0ce5e4ff63e557bd98720a78519d8534ba4a1b11a0cfd69c1ec01a93
|
File details
Details for the file viewx-0.2.1-py3-none-any.whl.
File metadata
- Download URL: viewx-0.2.1-py3-none-any.whl
- Upload date:
- Size: 4.7 MB
- Tags: Python 3
- Uploaded using Trusted Publishing? No
- Uploaded via: twine/6.2.0 CPython/3.13.7
File hashes
| Algorithm | Hash digest | |
|---|---|---|
| SHA256 |
4a2e56c34687138ea4f425eedf856a92553e6d84aac2ec3361eed8f692be1e87
|
|
| MD5 |
358ee0d07f926f7390dd72076b206c4a
|
|
| BLAKE2b-256 |
95b8c960a5901a57f7c3ea1d1b8e26b127ccc93d1d203b167d8738d3eaeb436b
|






