
Vis
vis is a CLI for visualizing fuzzy tabular data without leaving the terminal.

Features
vis provides quick, on-the-fly visualizations of tabular data that may not be perfectly structured. Whether it's output from a command, log file, messy CSV, or more, vis can parse and visualize it with a short one-liner.
- Visualize 1D data as histograms and 2D data as scatter/line plots, via Matplotlib-based visualizations managed by Seaborn
- Fuzzy parsing extracts numbers from messy data, no strict columns or formats required
- Units and time parsing convert human-friendly formats like
5GB,2h30m, or3 days agointo numbers for plotting - Boundary control with options to filter outliers or set axis limits
- Trend lines and KDE for deeper insights into data distributions and relationships
- Clean-only mode to just extract and print the parsed numbers without plotting, perfect for data cleaning
Install
pip install vis_cli
Examples
Histograms
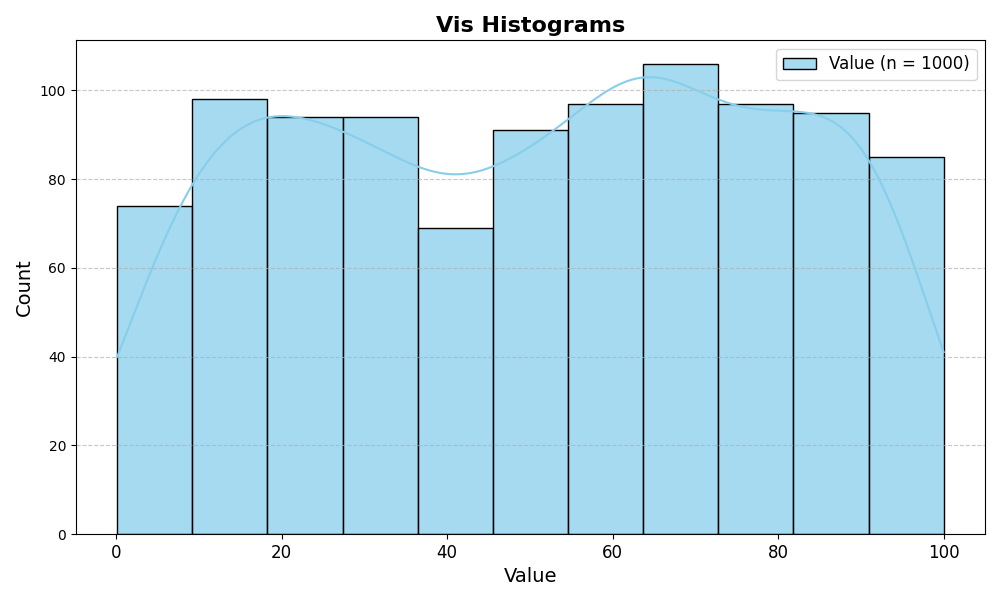
awk 'BEGIN { for (i = 0; i < 1000; i++) print rand() * 100 }' | vis hist --kde
Scatter plots
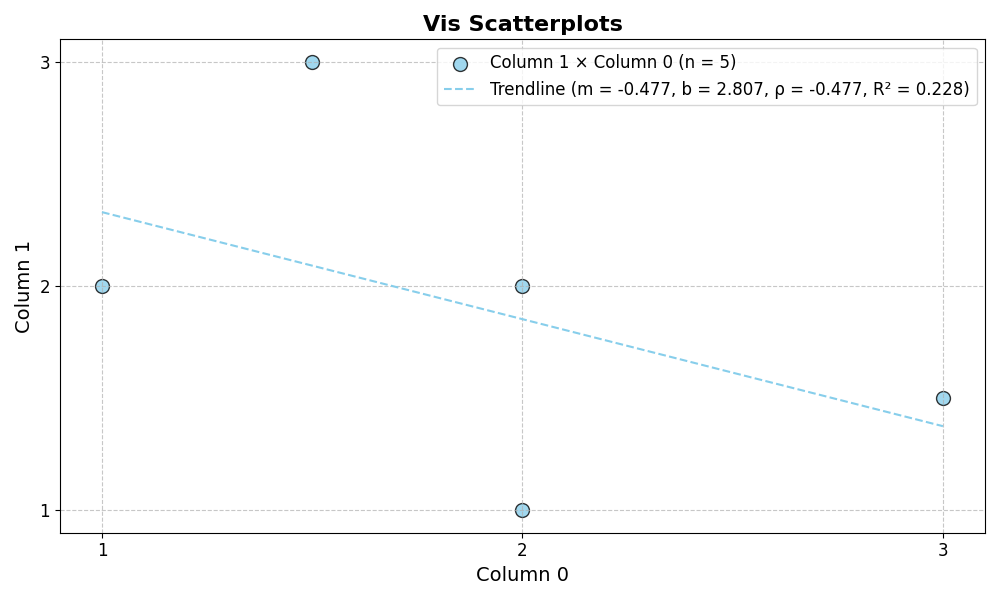
echo -e 'messy 1 data2\nstill1.5results3\n2 1 in\n3 1.5\n2clean2 outputs' | vis scatter --trend
Line plots
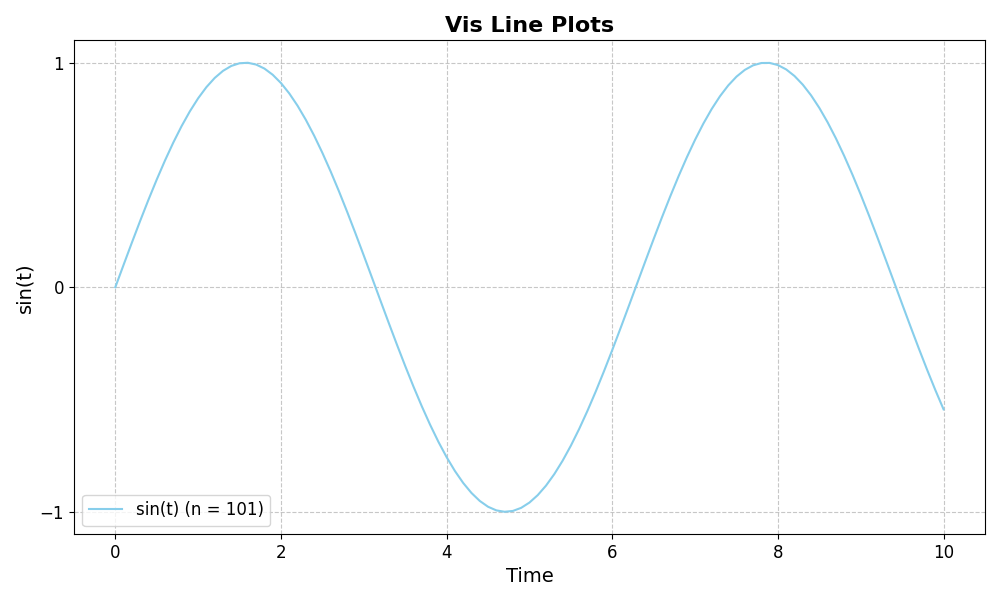
seq 0 0.1 10 | awk '{print $1, sin($1)}' | vis line --xlab "Time" --ylab "sin(t)"
Histogram: Kubernetes pod ages
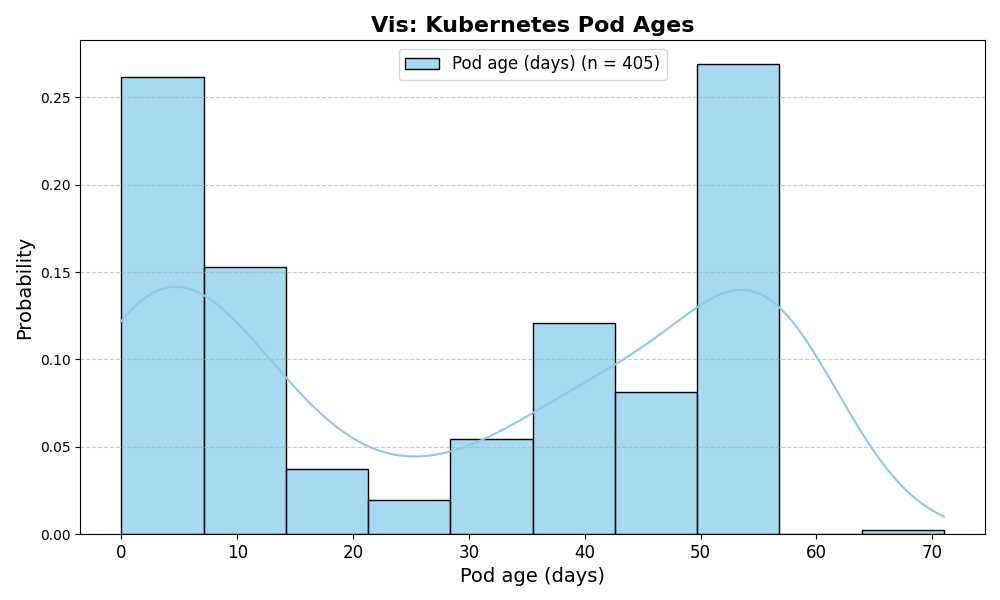
kubectl get pods --all-namespaces | vis hist --col 5 --sep ' ' --unit day --kde --xlab 'Pod age (days)'
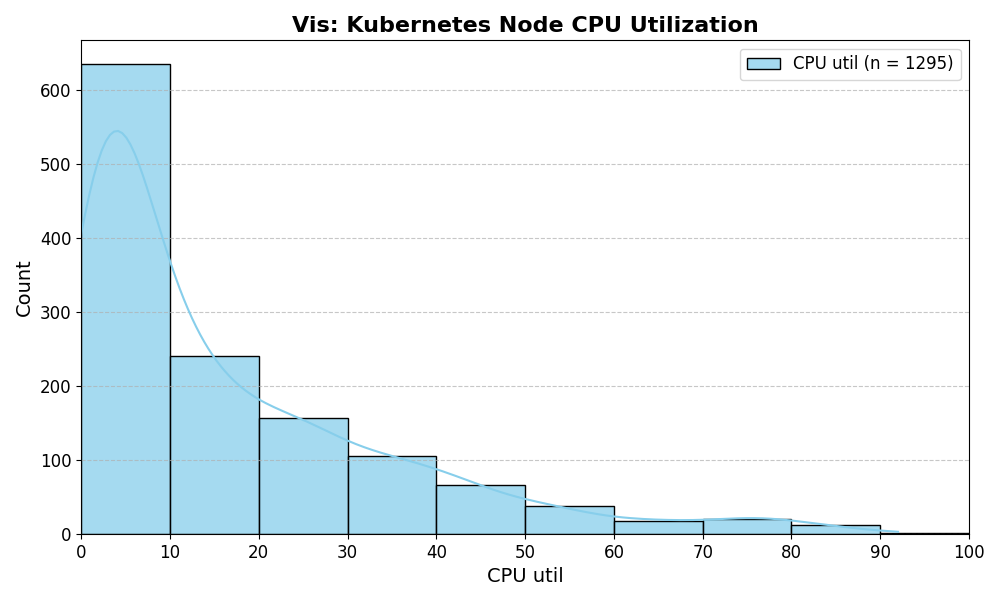
Histogram: Kubernetes CPU utilization
kubectl top nodes | vis hist --static --col 2 --bins 10 --xmax 100 --xlab 'CPU util' --kde
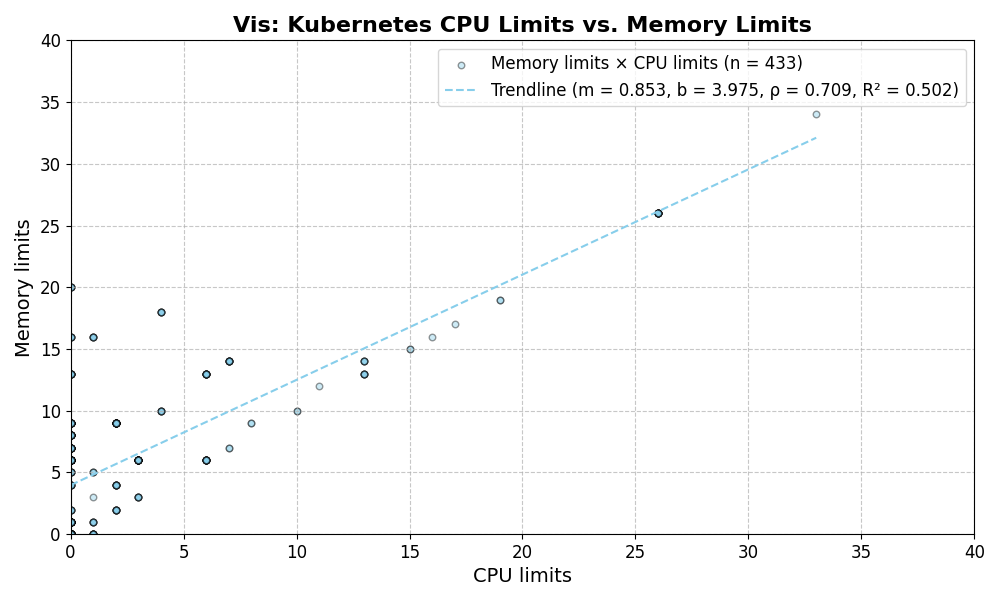
Scatter plot: Kubernetes pod CPU vs memory limits
kubectl resource-capacity --pods | grep -v '\*.*\*' | vis scatter --static --cols 4 6 --xlab "CPU limits" --ylab "Memory limits" --trend
Usage
$ vis --help
Usage: vis [OPTIONS] COMMAND [ARGS]...

  A fuzzy tabular data visualization tool.

Options:
  -h, --help  Show this message and exit.

Commands:
  clean    Clean the data from a file or stdin and print it to stdout.
  hist     Create a histogram from numerical data.
  line     Create a line plot from tabular data.
  scatter  Create a scatter plot from tabular data.
How I use vis
I mainly use vis to investigate issues in Kubernetes clusters.
Check for large replica counts
kubectl get pinapps | vis hist --col 2 --sep ' '
Check for lagging jobs
kubectl get pinterestjobset | vis hist --time --col 1 --sep ' ' --xmax '1 week ago'
See also
1 maintainer

Release files for vis_cli 0.8.0
For a detailed explanation of source distributions (sdists) and built distributions (wheels), please see the package formats documentation.
Source distribution (sdist)
| File | Size | Uploaded | |
|---|---|---|---|
| vis_cli-0.8.0.tar.gz | 9.3 kB | Details |
Built distribution (wheel)
| File | Interpreter | ABI | Platform | Reset |
|---|---|---|---|---|
| vis_cli-0.8.0-py3-none-any.whl | Python 3 | none | any | Details |
Total release size: 18.4 kB
Release files / vis_cli-0.8.0.tar.gz
| Download URL | vis_cli-0.8.0.tar.gz |
|---|---|
| Size | 9.3 kB |
| Tags | Source |
|
SHA-256 checksum How to use checksums |
e25cf4b6cf7878d16d0a56e5f5a717ce2d3248f953fc966be73f2091440f0440
|
|
BLAKE2b-256 checksum How to use checksums |
bb74d650050f4f68ac4ae4b9eee5dc551a0b01e4efd236cdf403382fae31900b
|
| Upload date | |
|
Uploaded using Trusted Publishing? What is trusted publishing? |
No |
| Uploaded via |
poetry/1.8.3 CPython/3.12.12 Darwin/25.3.0
|
Release files / vis_cli-0.8.0-py3-none-any.whl
| Download URL | vis_cli-0.8.0-py3-none-any.whl |
|---|---|
| Size | 9.0 kB |
| Tags | Python 3 |
|
SHA-256 checksum How to use checksums |
5c79e8d8860e9b20af9ccc79566c5251fe74c4ad73a60631c7b953c8d4caeefa
|
|
BLAKE2b-256 checksum How to use checksums |
0cc31ffb179414bf20cc473e6337974cfa62db7a532370ffa5292197a8cb9d69
|
| Upload date | |
|
Uploaded using Trusted Publishing? What is trusted publishing? |
No |
| Uploaded via |
poetry/1.8.3 CPython/3.12.12 Darwin/25.3.0
|














