Vis visualizes fuzzy tabular data, no script required

Project description
Vis
vis is a CLI for visualizing fuzzy tabular data without leaving the terminal.

Features
vis provides quick, on-the-fly visualizations of tabular data that may not be perfectly structured. Whether it's output from a command, log file, messy CSV, or more, vis can parse and visualize it with a short one-liner.
- Visualize 1D data as histograms and 2D data as scatter/line plots, via Matplotlib-based visualizations managed by Seaborn
- Fuzzy parsing extracts numbers from messy data, no strict columns or formats required
- Units and time parsing convert human-friendly formats like
5GB,2h30m, or3 days agointo numbers for plotting - Boundary control with options to filter outliers or set axis limits
- Trend lines and KDE for deeper insights into data distributions and relationships
- Clean-only mode to just extract and print the parsed numbers without plotting, perfect for data cleaning
Install
pip install vis_cli
Examples
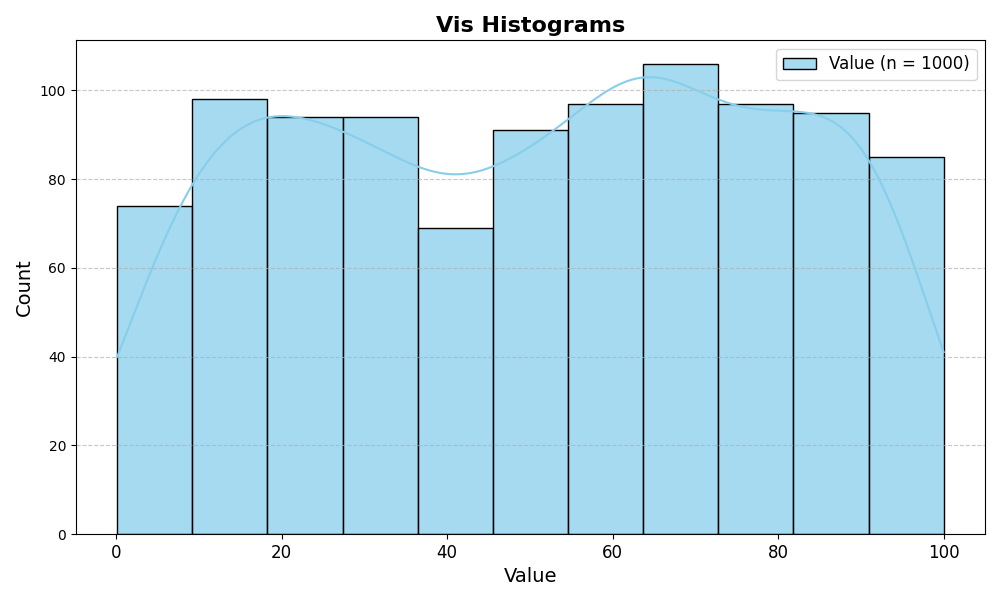
Histograms
awk 'BEGIN { for (i = 0; i < 1000; i++) print rand() * 100 }' | vis hist --kde
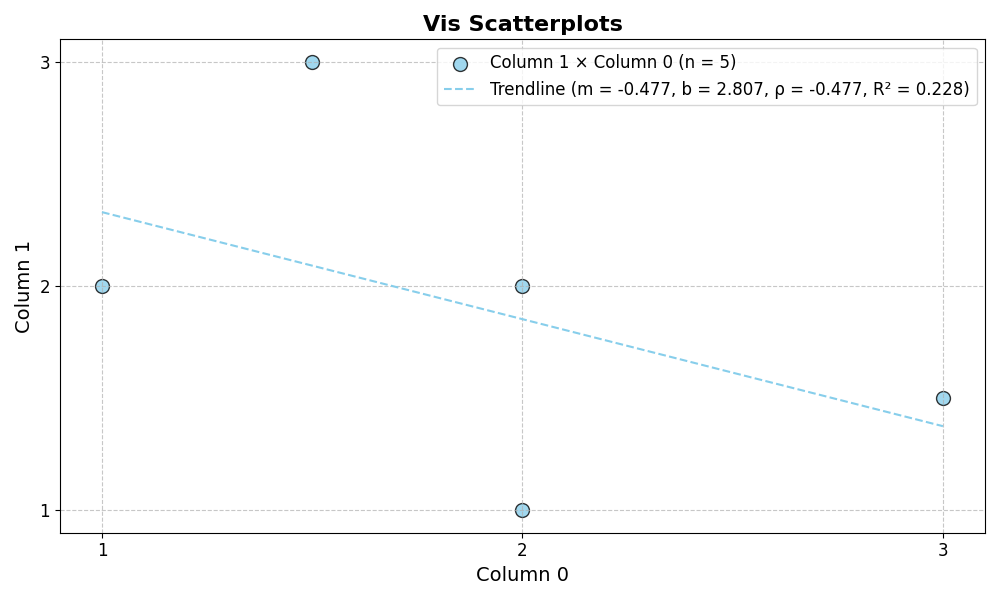
Scatter plots
echo -e 'messy 1 data2\nstill1.5results3\n2 1 in\n3 1.5\n2clean2 outputs' | vis scatter --trend
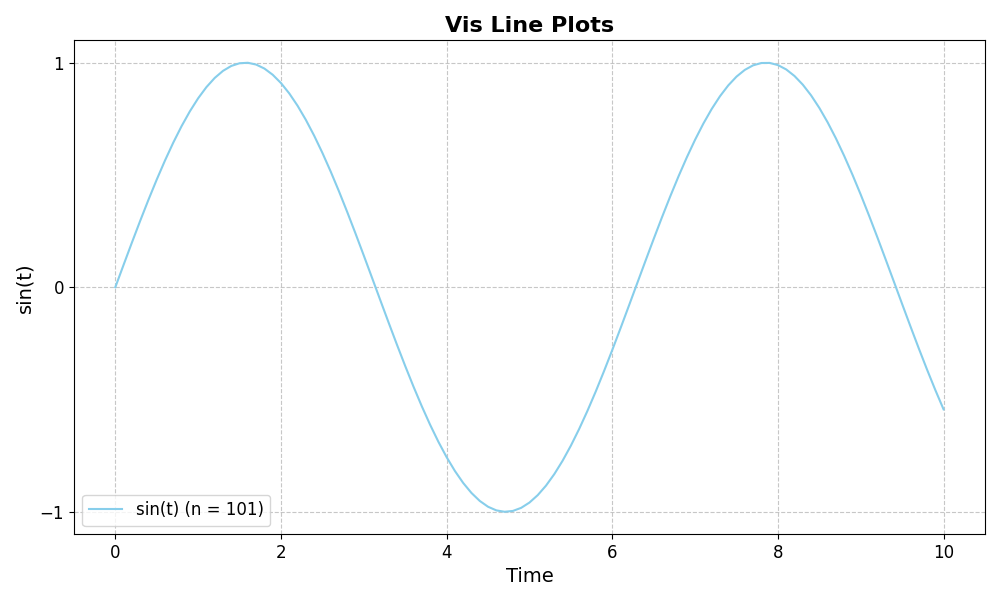
Line plots
seq 0 0.1 10 | awk '{print $1, sin($1)}' | vis line --xlab "Time" --ylab "sin(t)"
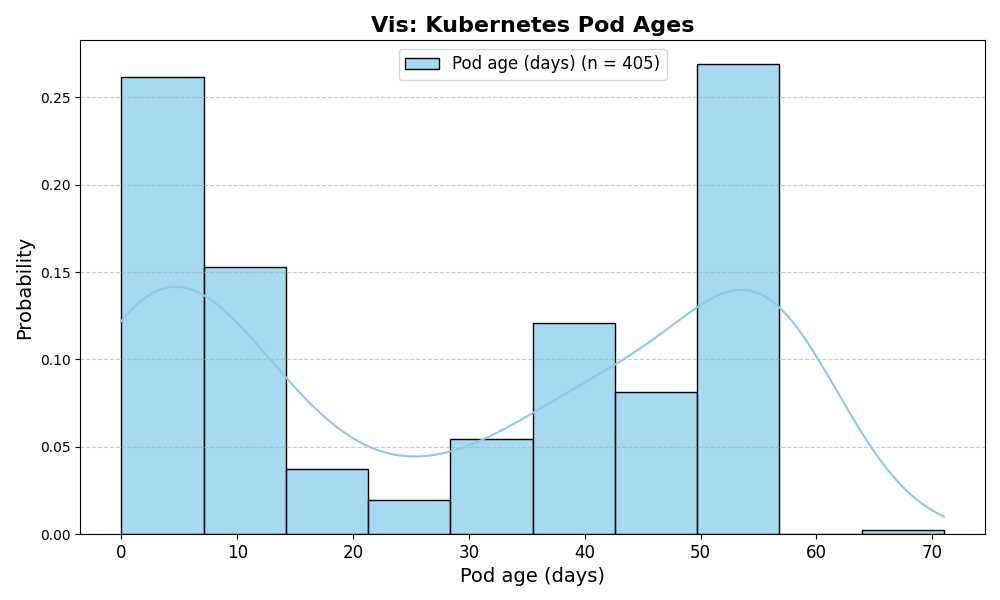
Histogram: Kubernetes pod ages
kubectl get pods --all-namespaces | vis hist --col 5 --sep ' ' --unit day --kde --xlab 'Pod age (days)'
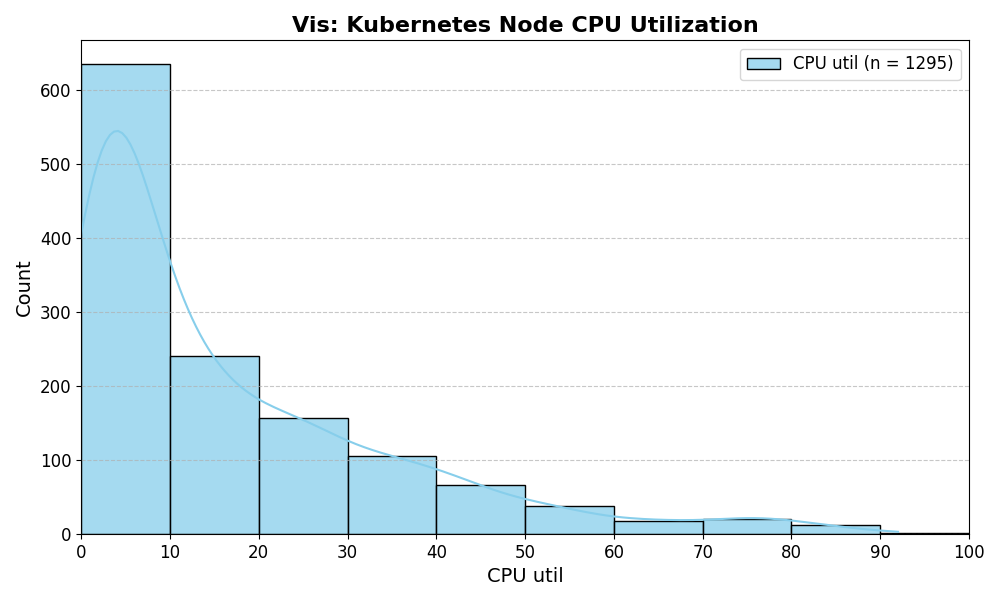
Histogram: Kubernetes CPU utilization
kubectl top nodes | vis hist --static --col 2 --bins 10 --xmax 100 --xlab 'CPU util' --kde
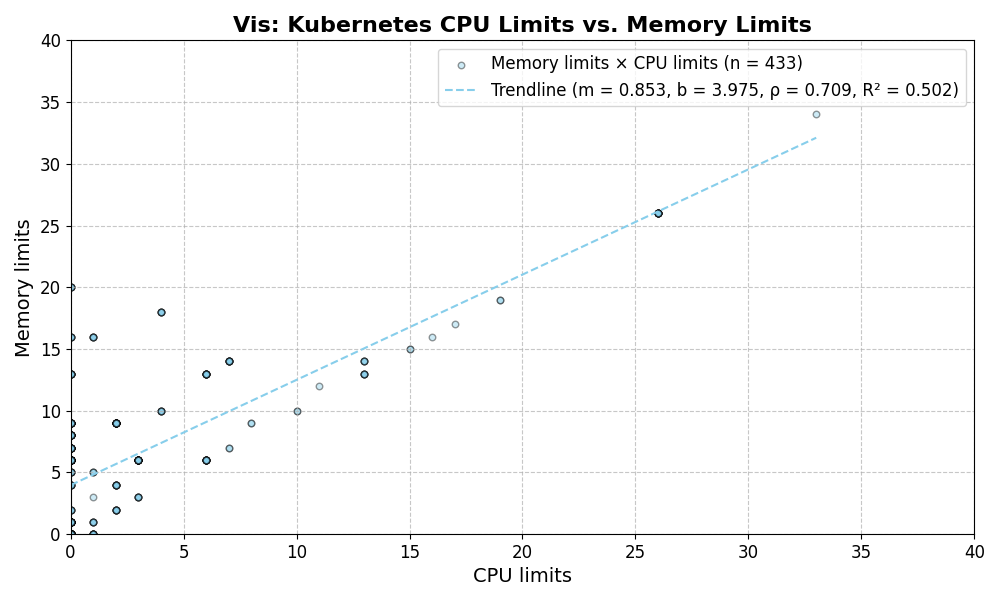
Scatter plot: Kubernetes pod CPU vs memory limits
kubectl resource-capacity --pods | grep -v '\*.*\*' | vis scatter --static --cols 4 6 --xlab "CPU limits" --ylab "Memory limits" --trend
Usage
$ vis --help
Usage: vis [OPTIONS] COMMAND [ARGS]...

  A fuzzy tabular data visualization tool.

Options:
  -h, --help  Show this message and exit.

Commands:
  clean    Clean the data from a file or stdin and print it to stdout.
  hist     Create a histogram from numerical data.
  line     Create a line plot from tabular data.
  scatter  Create a scatter plot from tabular data.
How I use vis
I mainly use vis to investigate issues in Kubernetes clusters.
Check for large replica counts
kubectl get pinapps | vis hist --col 2 --sep ' '
Check for lagging jobs
kubectl get pinterestjobset | vis hist --time --col 1 --sep ' ' --xmax '1 week ago'
See also


Download files
Download the file for your platform. If you're not sure which to choose, learn more about installing packages.
Source Distribution
Built Distribution
Filter files by name, interpreter, ABI, and platform.
If you're not sure about the file name format, learn more about wheel file names.
Copy a direct link to the current filters
File details
Details for the file vis_cli-0.8.0.tar.gz.
File metadata
- Download URL: vis_cli-0.8.0.tar.gz
- Upload date:
- Size: 9.3 kB
- Tags: Source
- Uploaded using Trusted Publishing? No
- Uploaded via: poetry/1.8.3 CPython/3.12.12 Darwin/25.3.0
File hashes
| Algorithm | Hash digest | |
|---|---|---|
| SHA256 |
e25cf4b6cf7878d16d0a56e5f5a717ce2d3248f953fc966be73f2091440f0440
|
|
| MD5 |
b9179e9f9a4328e319a5dead383e23a2
|
|
| BLAKE2b-256 |
bb74d650050f4f68ac4ae4b9eee5dc551a0b01e4efd236cdf403382fae31900b
|
File details
Details for the file vis_cli-0.8.0-py3-none-any.whl.
File metadata
- Download URL: vis_cli-0.8.0-py3-none-any.whl
- Upload date:
- Size: 9.0 kB
- Tags: Python 3
- Uploaded using Trusted Publishing? No
- Uploaded via: poetry/1.8.3 CPython/3.12.12 Darwin/25.3.0
File hashes
| Algorithm | Hash digest | |
|---|---|---|
| SHA256 |
5c79e8d8860e9b20af9ccc79566c5251fe74c4ad73a60631c7b953c8d4caeefa
|
|
| MD5 |
385daedd9621609d340be0c3938575dc
|
|
| BLAKE2b-256 |
0cc31ffb179414bf20cc473e6337974cfa62db7a532370ffa5292197a8cb9d69
|


