
VisualMetrics
See the theory. Change the assumptions. Understand the model.
An interactive visual laboratory for statistics, statistical inference, econometrics, causal inference, machine learning and modern AI — in English, Arabic and French.





Source code, issues and the full documentation live on GitHub: https://github.com/merwanroudane/visualmetrics · Documentation site · Changelog · Report a problem
See it in one minute
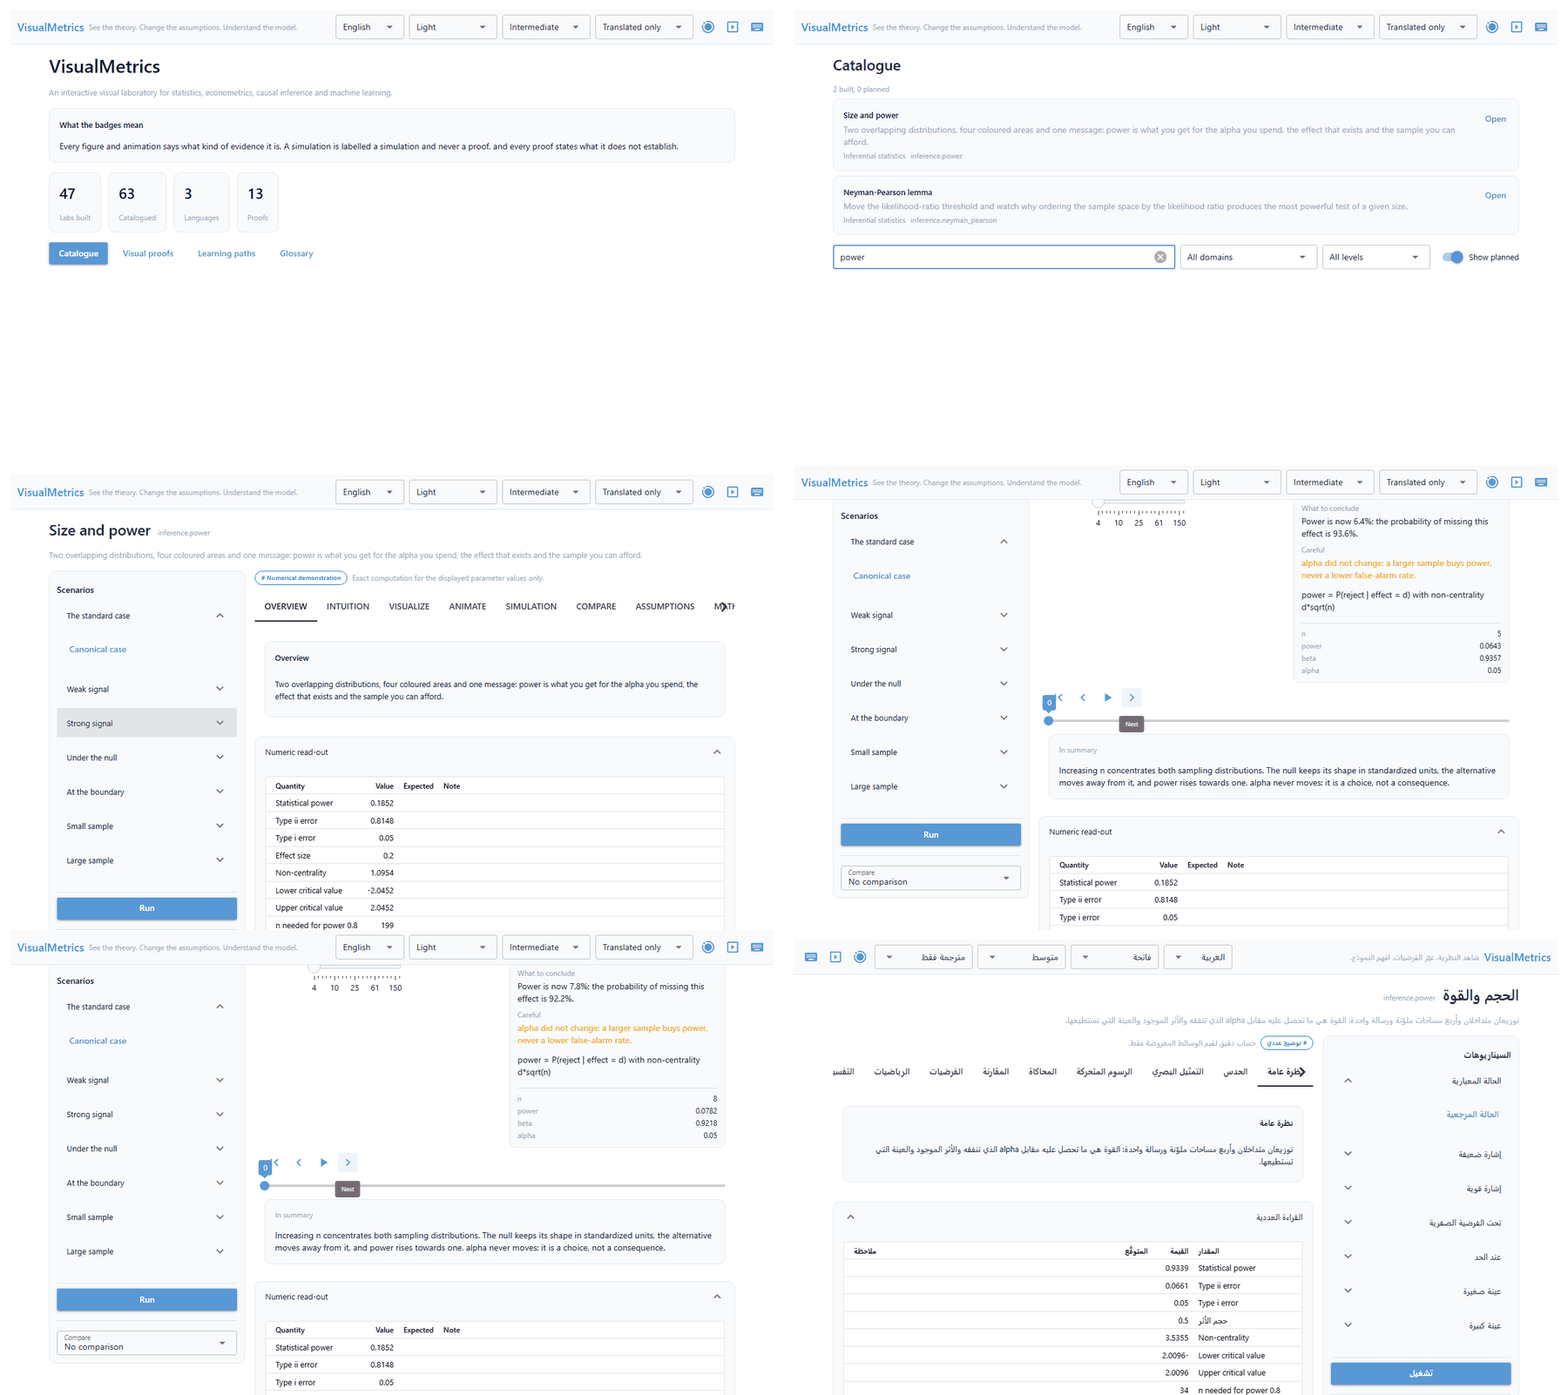
A real recording: open the catalogue → search → open a lab → change the assumption → watch the animation explain itself frame by frame → read a proof → switch to Arabic.
Table of contents
- What it is · What it is not
- Install · Run it
- How to use it, step by step ← start here
- The Python API · Notebooks
- Working in three languages
- The three rules
- The catalogue · Scenarios · Proofs
- Exporting · Extras · Troubleshooting
- Accessibility · Contributing · Citation
What it is
A laboratory where a statistical idea is something you operate rather than read about. Each concept is a lab: you move the assumptions, watch what the estimator does, and read the consequence in words and in numbers at the same time.
It is a Python library, not a website. pip install visualmetrics gives you
a package; visualmetrics gui starts a local application on your own machine,
the same way Jupyter does. Nothing is hosted and nothing leaves your computer.
What it is not
- Not a proof assistant. The 13 proofs are human-written arguments, checked for internal consistency, not machine-verified.
- Not a substitute for a textbook. It is built to sit beside one.
- Not a research output package. It uses real estimators and reports honest
numbers, but its purpose is understanding. For publication tables use
statsmodels,linearmodelsor R. - Not an assessment system. The self-checks explain their answers and grade nothing.
- Not a claim that a simulation proves anything. That distinction is enforced in code and in the test suite.
Install
pip install "visualmetrics[gui]"
That is the normal install: the application, the figures and all 47 labs.
Just the library, without the interface
pip install visualmetrics
Pulls only NumPy, SciPy and platformdirs. You get the catalogue, trilingual
search, the glossary, the proofs, the teaching material and the whole numeric
engine — every estimator, test and covariance matrix.
Drawing a figure needs the viz extra. Ask for one without it and the error
tells you exactly what to install rather than crashing:
>>> vm.lab("inference.power")
MissingDependencyError: 'plotly' is required for interactive figures but is not
installed. Install the 'viz' extra:  pip install "visualmetrics[viz]"
Everything, or from source
pip install "visualmetrics[all]"     # every extra that installs from wheels

git clone https://github.com/merwanroudane/visualmetrics
cd visualmetrics
pip install -e ".[dev,gui]"
pytest -m "not slow"
all deliberately excludes the proofs extra: Manim needs cairo and ffmpeg on
the system, and folding it in would make pip install visualmetrics[all] fail
on a clean machine.
Run it
visualmetrics
Open http://localhost:8080. That is the whole setup.
How to use it, step by step
1. Start at the catalogue
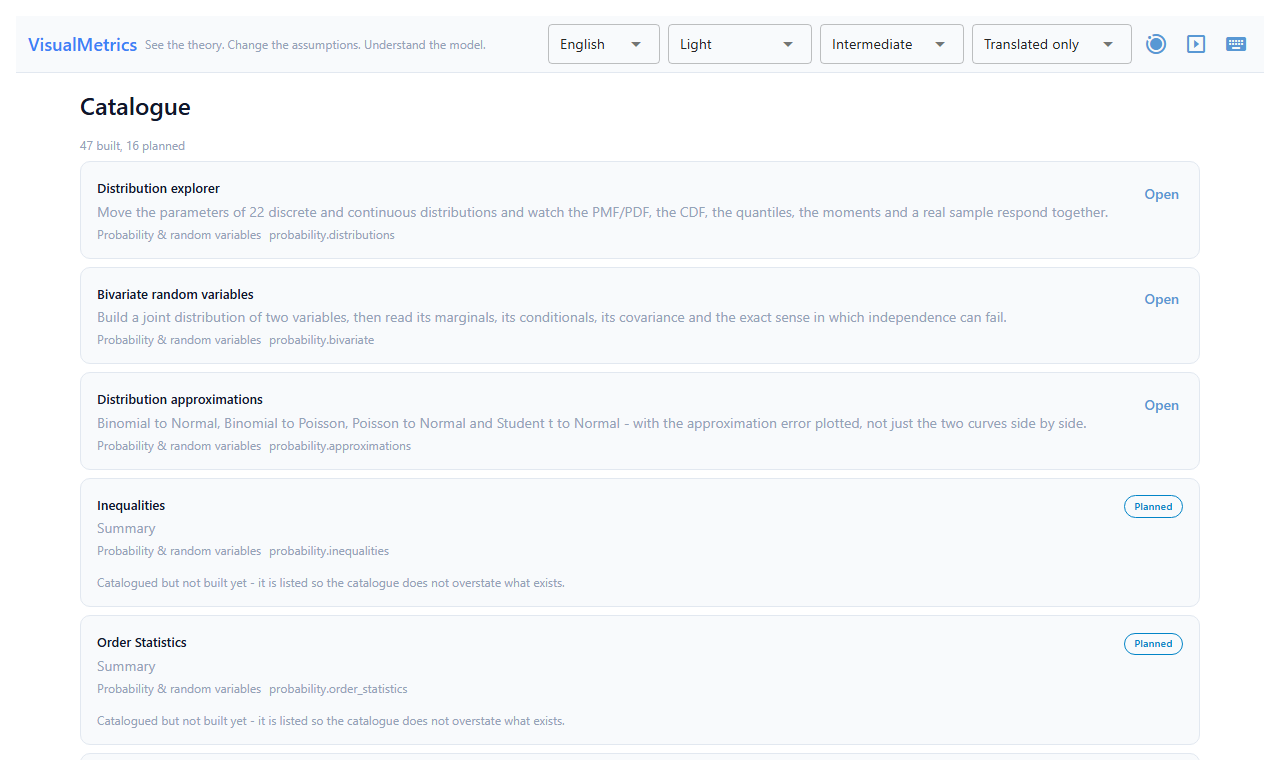
Every concept the package knows about — 47 built and 16 planned. The planned ones are shown, marked, and refuse to open. Nothing is hidden to make the count look better.
Search works in any of the three languages at once, including Arabic typed without diacritics. Filter by domain or by level.
2. Open a lab
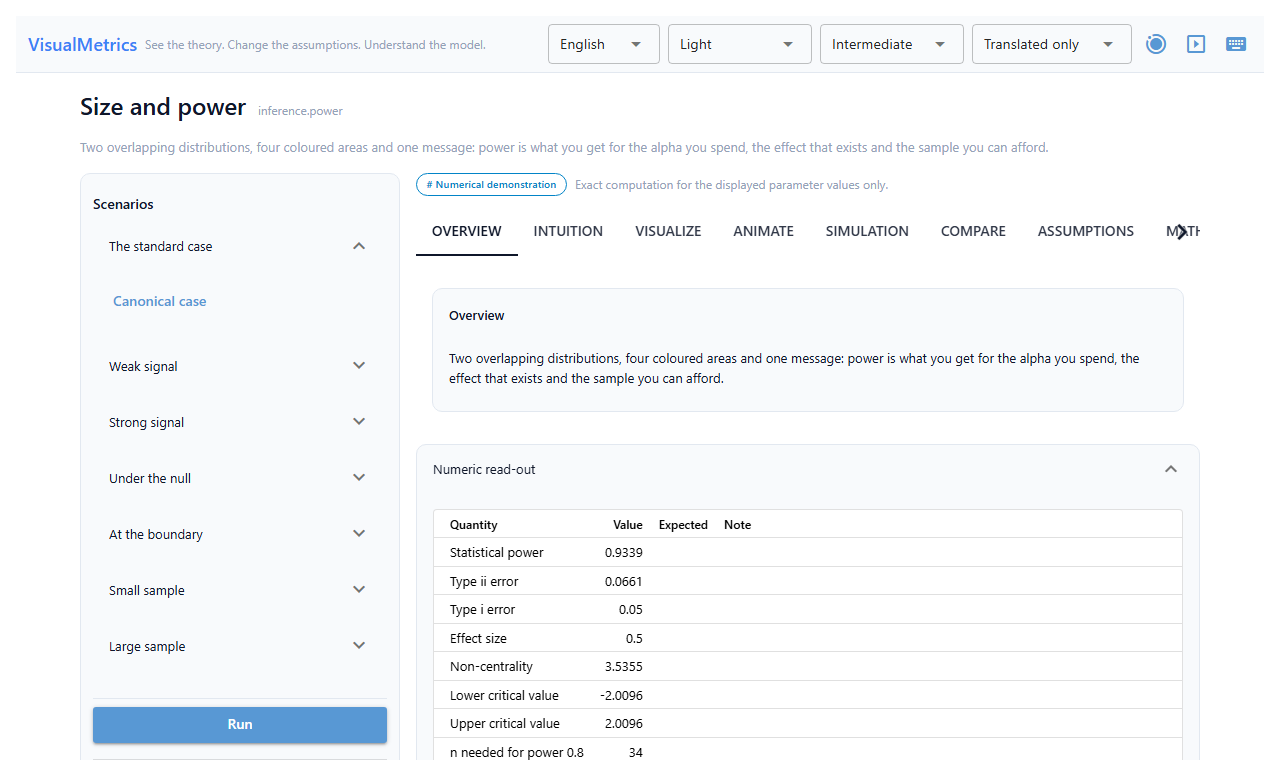
Three things to notice before you touch anything:
| The evidence badge, above the tabs | Says what kind of claim this figure makes — here # Numerical demonstration, with its caveat beside it. It is never decoration |
| The knowledge tabs | Overview, Intuition, Visualize, Animate, Simulation, Compare, Assumptions, Mathematics, Interpretation, Common mistakes, Warnings, Code. A tab appears only when the lab has something to put in it |
| The scenarios panel, on the left | Grouped by what they are for, not listed flat |
3. Change the assumption
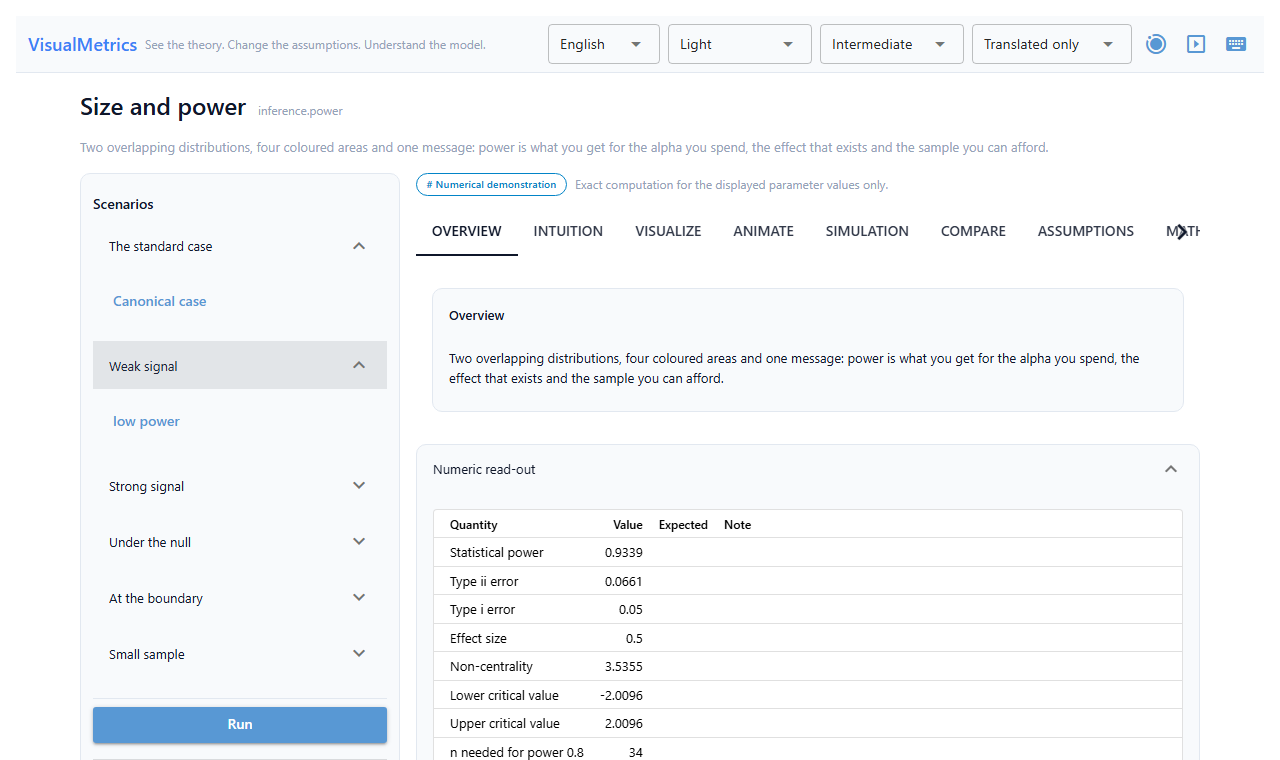
This is the point of the whole package. Scenarios are grouped as the standard case, weak signal, strong signal, under the null, at the boundary, small sample, large sample, sensitivity, compare methods — and, in labs where a method can break, assumption violated and counterexample.
Every lab is required to offer at least one case where the method fails. A lab that only shows the happy path is rejected by the test suite.
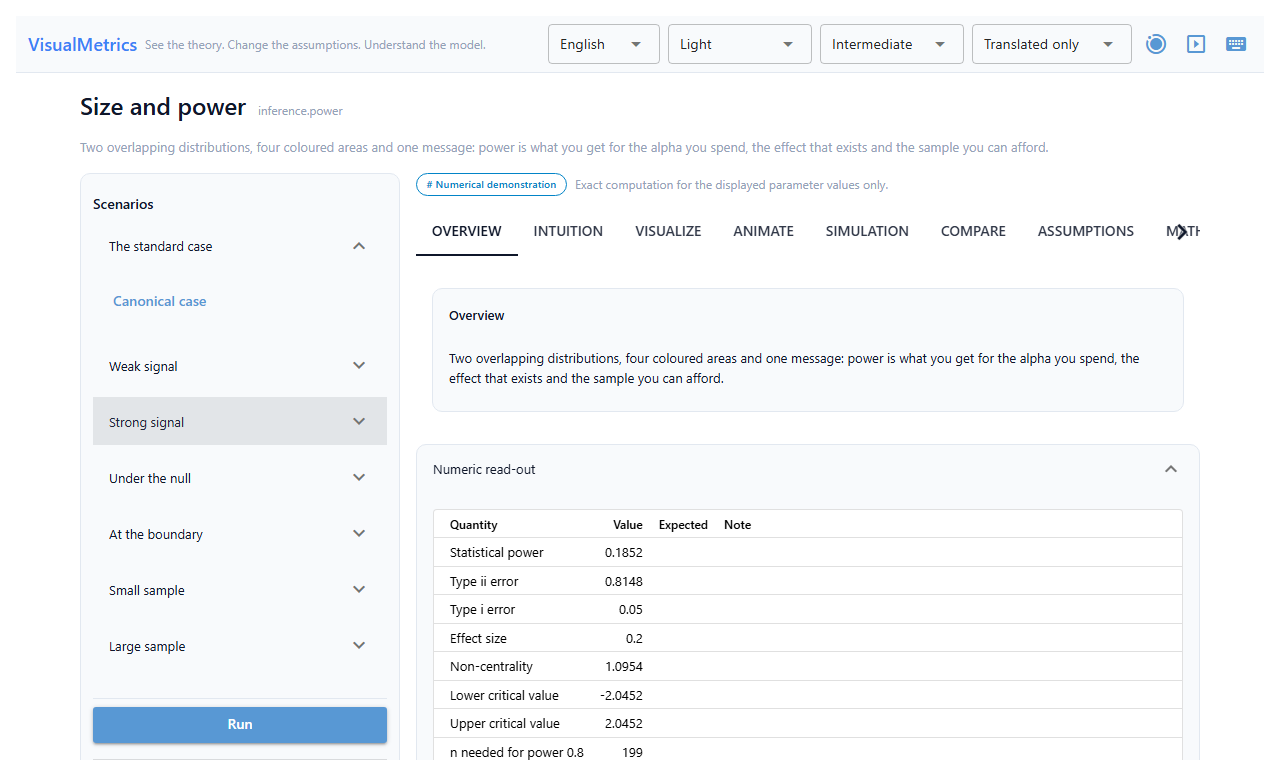
Pick one and the figures, the numbers, the assumptions and the warnings all re-compute. Below the controls you can set a seed, copy a link that reproduces exactly this view, or export the whole thing.
4. Watch the animation explain itself
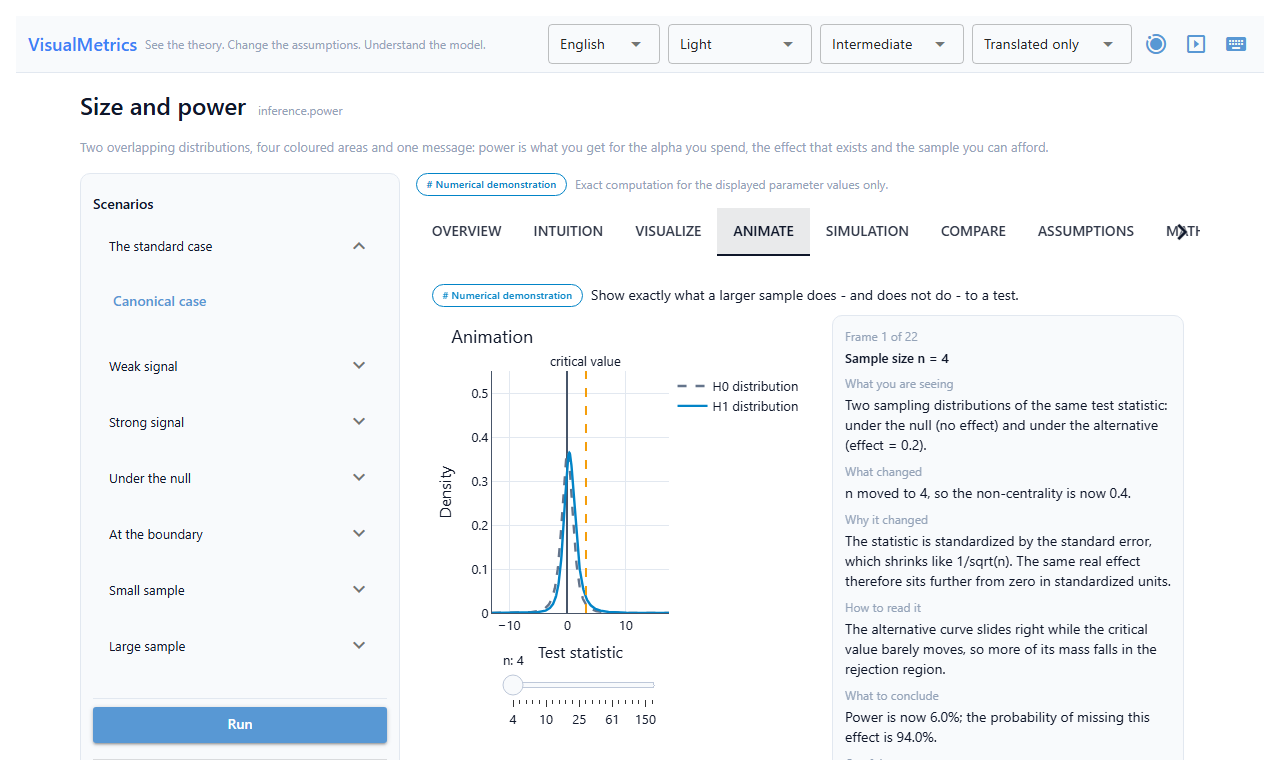
This is the feature the package exists for. The figure is on the left; the commentary is beside it, not in a caption underneath, and it changes with every frame:
- What you are seeing — what is on screen right now
- What changed — what moved since the last frame
- Why it changed — the mechanism, not a description of the picture
- How to read it — what the movement means
- What to conclude — what you may take away
- Careful — what you may not take away
Plus the equation the frame illustrates and the numbers at that frame. Step with the arrows, scrub the slider, or press play.
An animation that arrives without that layer is refused, not played silently — in the application and in every exporter.
5. Read the proof behind the lab
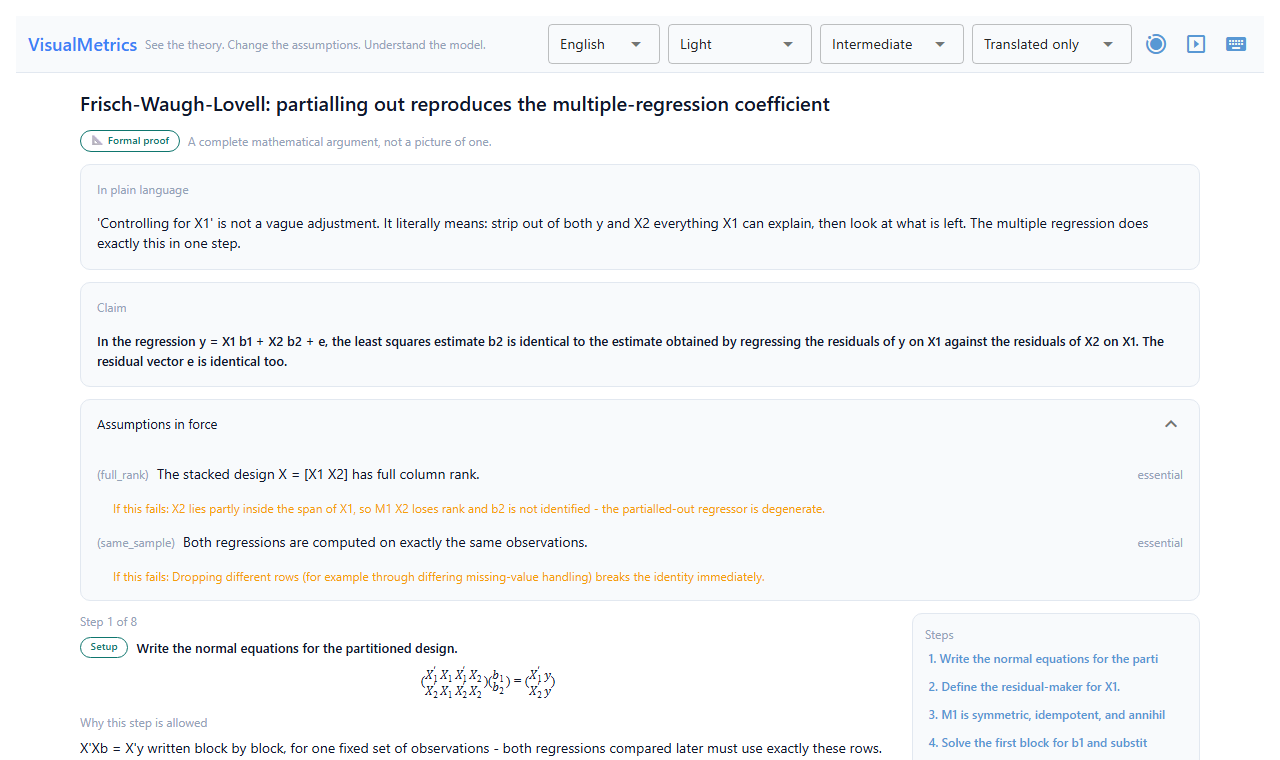
Labs that rest on a theorem link to it. A proof gives you:
- the idea in plain language before any symbol appears;
- the claim, stated precisely;
- the assumptions in force, each marked essential or relaxable, each saying what breaks if it fails;
- the steps one at a time, each with why that move is legal — the justification is the part that teaches;
- the conclusion, and then, always on screen, what this does NOT establish.
Where an identity can be checked numerically, a button runs the check and labels it as a test of the code — never as evidence for the theorem.
6. Switch language mid-sentence
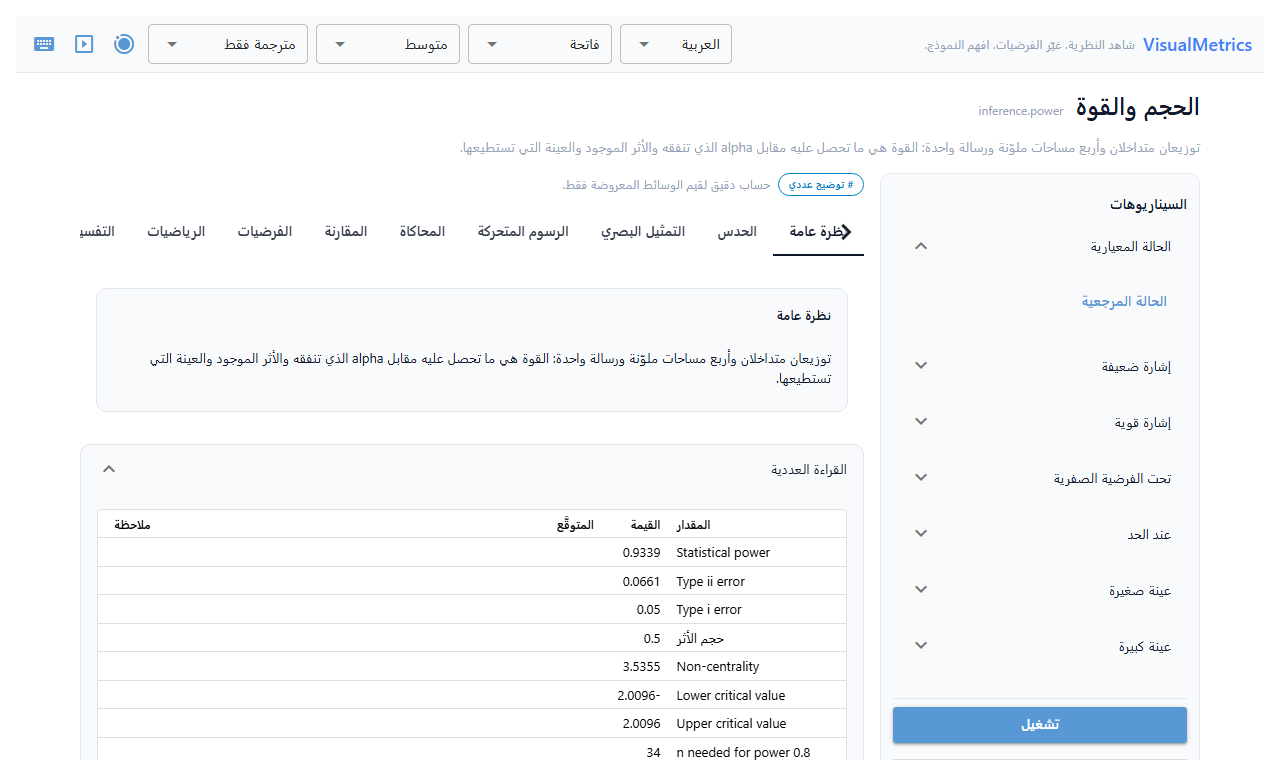
The same lab, one click later. The layout mirrors, the tabs reverse, the scenario groups translate, and you keep your figure, your parameters and your scroll position. A teacher can switch language mid-explanation without losing the class's place.
The interface, catalogue, glossary, scenarios, errors and proof structure are fully translated. The lab narrative still falls back to English in Arabic and French — about 2,400 keys remain. That is the honest state, and contributions there are the most valuable thing anyone can add.
The Python API
Everything the interface does is available directly; the GUI has no privileged access.
import visualmetrics as vm

result = vm.lab("inference.power", effect_size=0.4, n=60, alpha=0.05)

result.figure                  # the primary figure
result.metric_dict()["power"]  # the numbers behind it
result.evidence                # EvidenceType.SIMULATION — stated, not implied
result.warnings                # what this run wants you to notice
print(result.code)             # the exact Python that reproduces this run
A LabResult carries the whole scientific layer:
| Attribute | What it holds |
|---|---|
panels |
Figures, each with a title, caption and evidence type |
metrics |
Numbers, with labels and reference values |
explanations |
Prose blocks, each tagged with a knowledge tab |
assumptions |
Each with its status and, when violated, the consequence |
animations |
Each with its per-frame explanation layer |
warnings |
What the run raised |
evidence |
What kind of evidence this is |
code / dgp |
How to reproduce it, and how the data were made |
# browse
vm.list_concepts(domain="econometrics")
vm.search("hétéroscédasticité")         # any of the three languages
vm.explain("regression.fwl")
vm.concept("causal.did").scenarios

# proofs
print(vm.proof("regression.fwl.theorem").to_text())

# teaching material
vm.objectives("inference.power")        # what to take away, and how to check it
vm.misconceptions("inference.power")    # the plausible wrong beliefs
vm.quiz("inference.power", count=3)     # a self-check, never a grade

# settings
vm.configure(language="ar", theme="dark", level="advanced", seed=7)
Every lab is deterministic given a seed:
assert vm.lab("inference.bootstrap", seed=42).metric_dict() == \
       vm.lab("inference.bootstrap", seed=42).metric_dict()
Notebooks
import visualmetrics as vm
from visualmetrics import notebook

notebook.setup()
vm.lab("econometrics.heteroskedasticity", scenario="severe")
After setup() a result displays as a small report — badge, warnings, violated
assumptions and numbers — rather than a bare figure. Notebook cells get pasted
into drafts, and a figure without its context is exactly what this package
exists to prevent.
notebook.interact("inference.power") # live controls (needs the notebook extra)
Working in three languages
vm.configure(language="ar")             # for the session
vm.lab("inference.clt", language="fr")  # for one call
Technical vocabulary can be shown three ways, because a class that will go on to read English papers needs the English term even when working in Arabic:
| Mode | What you see |
|---|---|
translated |
The translated term only |
bilingual |
The translated term with the English one beside it |
english_technical |
Prose in your language, technical terms in English |
Arabic is right-to-left by architecture: document direction, layout
mirroring, figure axes, a real Naskh font stack, and Unicode isolation so
R-squared does not scramble the sentence around it. Search normalises
diacritics, tatweel and the alef/yeh/teh-marbuta variants.
The three rules this package keeps
1. A simulation is never a proof
Every figure and animation declares its evidence type. Nine of them, from
formal_proof through simulation to counterexample. Only three count as
proof, and no amount of visual polish promotes the others.
This is enforced, not intended: a ProofSpec refuses a non-proof evidence kind,
a lab may not wear a proof badge unless it points at a real proof, and the badge
travels with the figure into every export.
2. Every animation explains itself
Every frame answers what you see, what changed, why, and how to read it. The exporter and the player both refuse an animation without that layer.
3. The catalogue never overstates itself
47 built, 16 planned. The planned ones appear with a badge, are not clickable, and refuse to open with an explanation. Concepts are named for the science — there is no "Statistics 3" anywhere in an id, a title or the interface, and a test enforces it.
The catalogue
15 canonical domains:
| Mathematical foundations | Probability and random variables |
| Descriptive statistics | Inferential statistics |
| Regression and linear models | Econometrics |
| Time series econometrics | Panel data econometrics |
| Causal inference | Multivariate statistics |
| Spatial econometrics | Machine learning |
| Deep learning | Modern AI |
| Explainable AI |
The full list is generated from the registry, so it cannot drift from what is installed.
Scenarios
519 scenarios across the 47 built labs:
canonical · positive · negative · null · weak · strong ·
boundary · violation · counterexample · sensitivity · small_sample ·
large_sample · high_noise · low_noise · robustness ·
misspecification · compare_methods
vm.lab("econometrics.heteroskedasticity", scenario="severe")
vm.lab("causal.did", scenario="violated_trends")
vm.lab("timeseries.cointegration", scenario="spurious")
Proofs
13, each with named assumptions, per-step justifications and an explicit statement of its limits — Frisch-Waugh-Lovell, Gauss-Markov, Neyman-Pearson, Cramér-Rao, the CLT, IV consistency, OLS orthogonality, the projection theorem, PCA variance maximisation, lasso sparsity, backpropagation, omitted variable bias and restricted least squares.
Exporting
from visualmetrics.export import export_html_report, export_result, export_animation

export_html_report(result, "report.html")   # figures + the whole scientific layer
export_result(result, "figure.png")         # static images (needs kaleido)
export_result(result, "result.json")        # everything as data
export_animation(result.animations[0], "animation.html")
Every exporter carries the evidence badge, the assumptions, the warnings and the
frame commentary. There is no exporter that strips them — exporting an animation
to a static format is refused for exactly that reason, and
export_animation_frames writes the commentary beside the images.
Configurations round-trip, so a result is shareable:
from visualmetrics.export import save_config, load_config

save_config(state, "lesson-1.json")
vm.run_state(load_config("lesson-1.json"))   # same figures, same numbers
Optional extras
| Extra | Enables |
|---|---|
gui |
The application |
viz |
Plotly and Matplotlib figures |
symbolic |
SymPy derivations |
econometrics |
statsmodels, linearmodels, arch cross-checks |
causal |
networkx DAG tooling |
ai |
scikit-learn, SHAP |
proofs |
Manim, for exported proof animations |
notebook |
ipywidgets controls |
data |
pandas, openpyxl, pyarrow |
export |
kaleido, for static images |
Troubleshooting
visualmetrics doctor
Reports the Python version, every optional backend with its status and version, which extra provides it, the languages available, the catalogue counts and whether the config and cache directories are writable. A package that is installed but unusable — a NumPy ABI mismatch, say — is reported as unusable rather than as missing, because the two have different fixes.
Accessibility
- Never colour alone. Every series carries a dash pattern or marker shape; an assumption's status is shown by icon, word and colour together.
- All seven themes meet WCAG AA contrast for body text;
high_contrastreaches 21:1. A colourblind-safe palette is included, and contrast is checked by the test suite rather than by eye. - Reduced motion is obeyed as a rule: transitions disabled, autoplay refused with an explanation, every frame still reachable by hand.
- Every figure carries a text alternative; assumptions expose ARIA status.
- Full keyboard navigation with a visible focus ring.
Supported Python versions
3.11, 3.12 and 3.13, on Linux, macOS and Windows.
Contributing
See CONTRIBUTING.md. The rules above are not negotiable and are enforced by tests. Where help is most useful:
- Translating a lab. ~2,400
labs.*keys are still English-only in Arabic and French. One lab is a complete contribution. - Building a planned concept. Sixteen are catalogued and waiting.
- Reporting a wrong number. The most serious kind of bug here — worth reporting even when you are not certain.
Adding a concept
- Add a
ConceptSpecstub tocatalog/builtin.py(Status.PLANNED). - Write
concepts/<domain>/<name>.pyexportingSPECandLAB. - Declare controls and at least five scenarios, one where the method fails.
- Produce panels, metrics, explanations, assumptions and one animation whose every frame explains itself.
- Add the text to
i18n/{en,ar,fr}/concepts.json. - Flip the status and run
pytest.
The interface needs no changes at all — it renders whatever the spec declares.
Citation
@software{roudane_visualmetrics,
  author  = {Roudane, Merwan},
  title   = {VisualMetrics: an interactive visual laboratory for statistics,
             econometrics, causal inference and machine learning},
  year    = {2026},
  url     = {https://github.com/merwanroudane/visualmetrics},
  license = {MIT}
}
See CITATION.cff.
License
MIT — see LICENSE.
Contact
Dr Merwan Roudane — merwanroudane920@gmail.com Issues: https://github.com/merwanroudane/visualmetrics/issues
1 maintainer

Download files
Download the file for your platform. If you're not sure which to choose, learn more about installing packages.
Source Distribution
Built Distribution
Filter files by name, interpreter, ABI, and platform.
If you're not sure about the file name format, learn more about wheel file names.
Copy a direct link to the current filters
File details
Details for the file visualmetrics-0.1.1.tar.gz.
File metadata
- Download URL: visualmetrics-0.1.1.tar.gz
- Upload date:
- Size: 1.6 MB
- Tags: Source
- Uploaded using Trusted Publishing? No
- Uploaded via:
twine/7.0.0 CPython/3.12.3
File hashes
| Algorithm | Hash digest | |
|---|---|---|
| SHA256 |
67dad85600b18557b92a15acba74ff3cc8449da7f1cefced4460ea12e92a6fe2
|
|
| MD5 |
1e345a72e6015e0b58e97649f68232ec
|
|
| BLAKE2b-256 |
1d8946e12c94649bc7bea8293c7e6c7a192c772234cc423f057e2530eb8f320d
|
File details
Details for the file visualmetrics-0.1.1-py3-none-any.whl.
File metadata
- Download URL: visualmetrics-0.1.1-py3-none-any.whl
- Upload date:
- Size: 666.9 kB
- Tags: Python 3
- Uploaded using Trusted Publishing? No
- Uploaded via:
twine/7.0.0 CPython/3.12.3
File hashes
| Algorithm | Hash digest | |
|---|---|---|
| SHA256 |
0a605eb68a5d71bac544a112a371a7a18b533b23a0adce663e197778a1e09541
|
|
| MD5 |
293264a7e1910551bab4514f711a2ae6
|
|
| BLAKE2b-256 |
40b1b0819600d7557a619f9a92644017ba02ee8147c4102e7e27e73bc8e02815
|














