
vit-attention-bench
Spectral theory says ViT attention is low-rank. In practice, pure low-rank fails — and semantic landmark selection wins. This repo lets you measure it yourself.




vitattn is a small library of attention-approximation methods for Vision Transformers —
SVD truncation, Nyström, Nyströmformer, Performer (FAVOR+), Linformer, semantic-landmark
Nyström — behind one unified AttentionApprox API, plus a reproducible benchmark harness
that measures what each approximation actually costs and breaks when you drop it into a
pretrained ViT with no retraining.
It exists to interrogate a specific, seductive claim from the efficient-attention literature: learned attention matrices are approximately low-rank, so you can approximate them cheaply. The spectra say that's true. The predictions say it's a trap — until you stop reading the spectrum in aggregate and start reading it per layer.
TL;DR — the finding
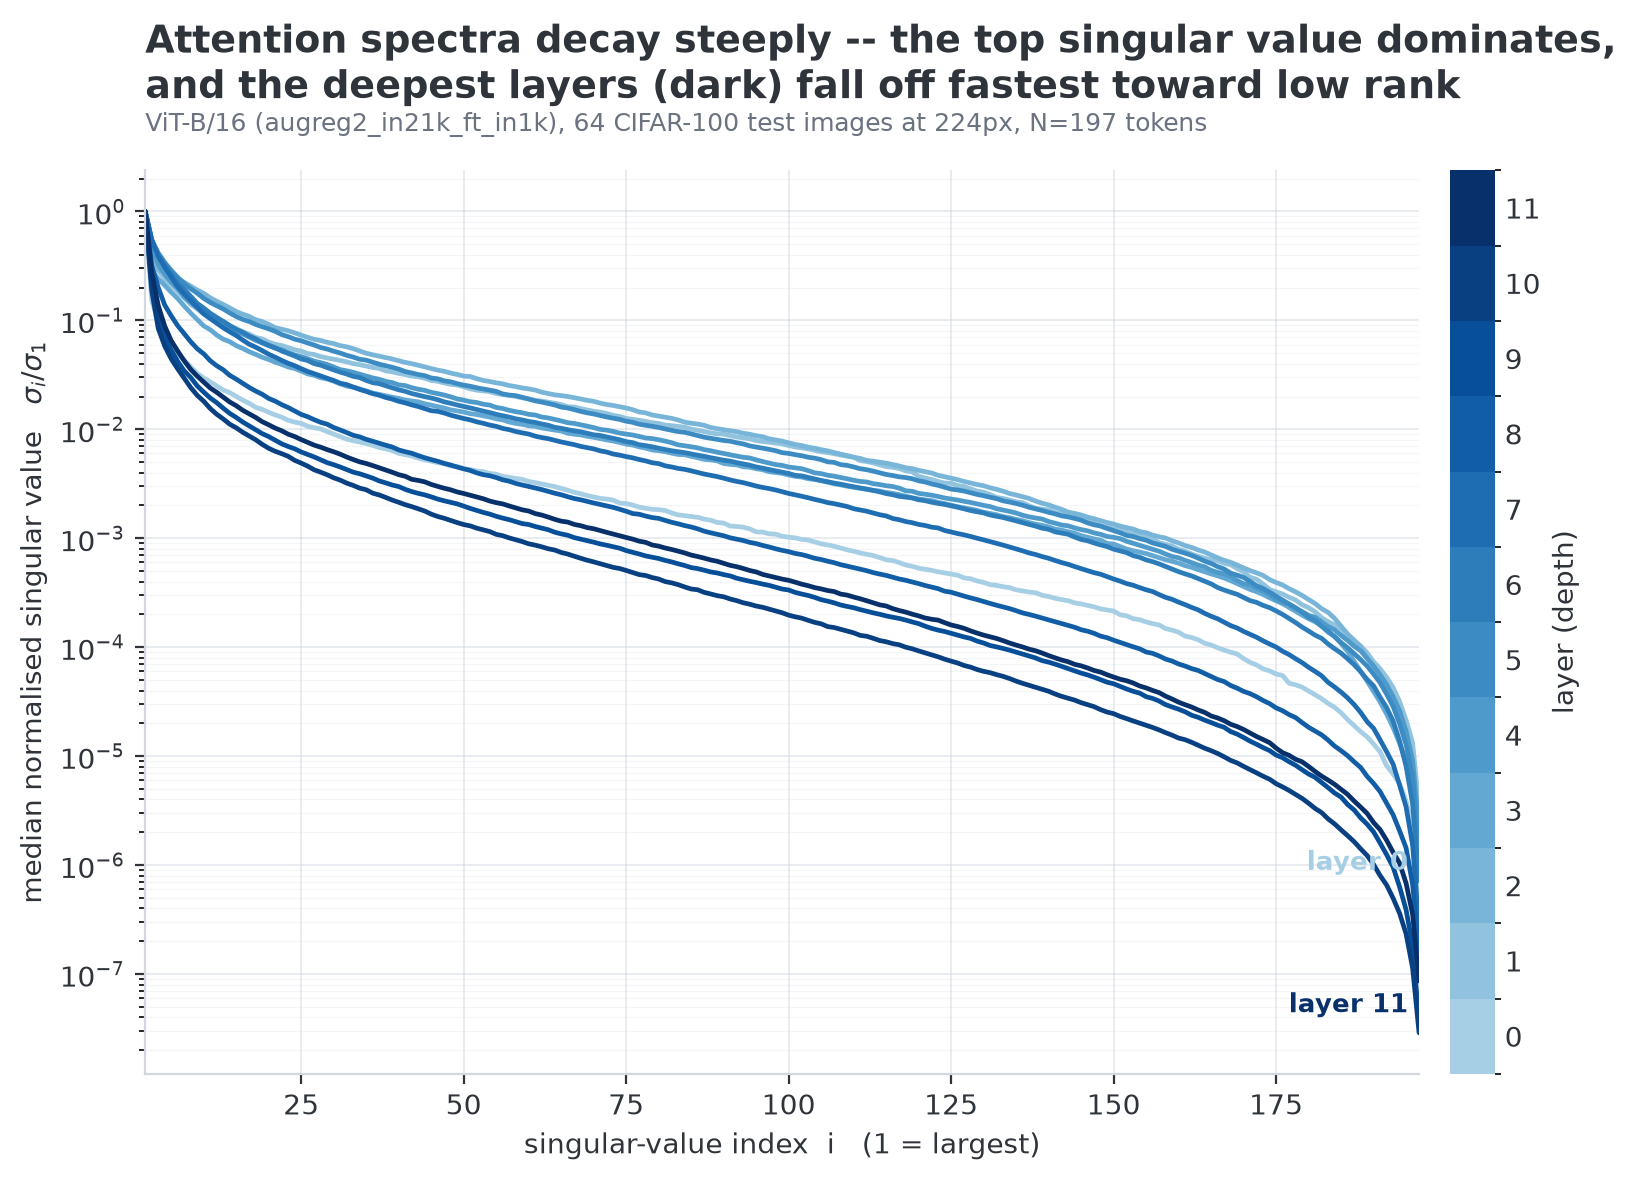
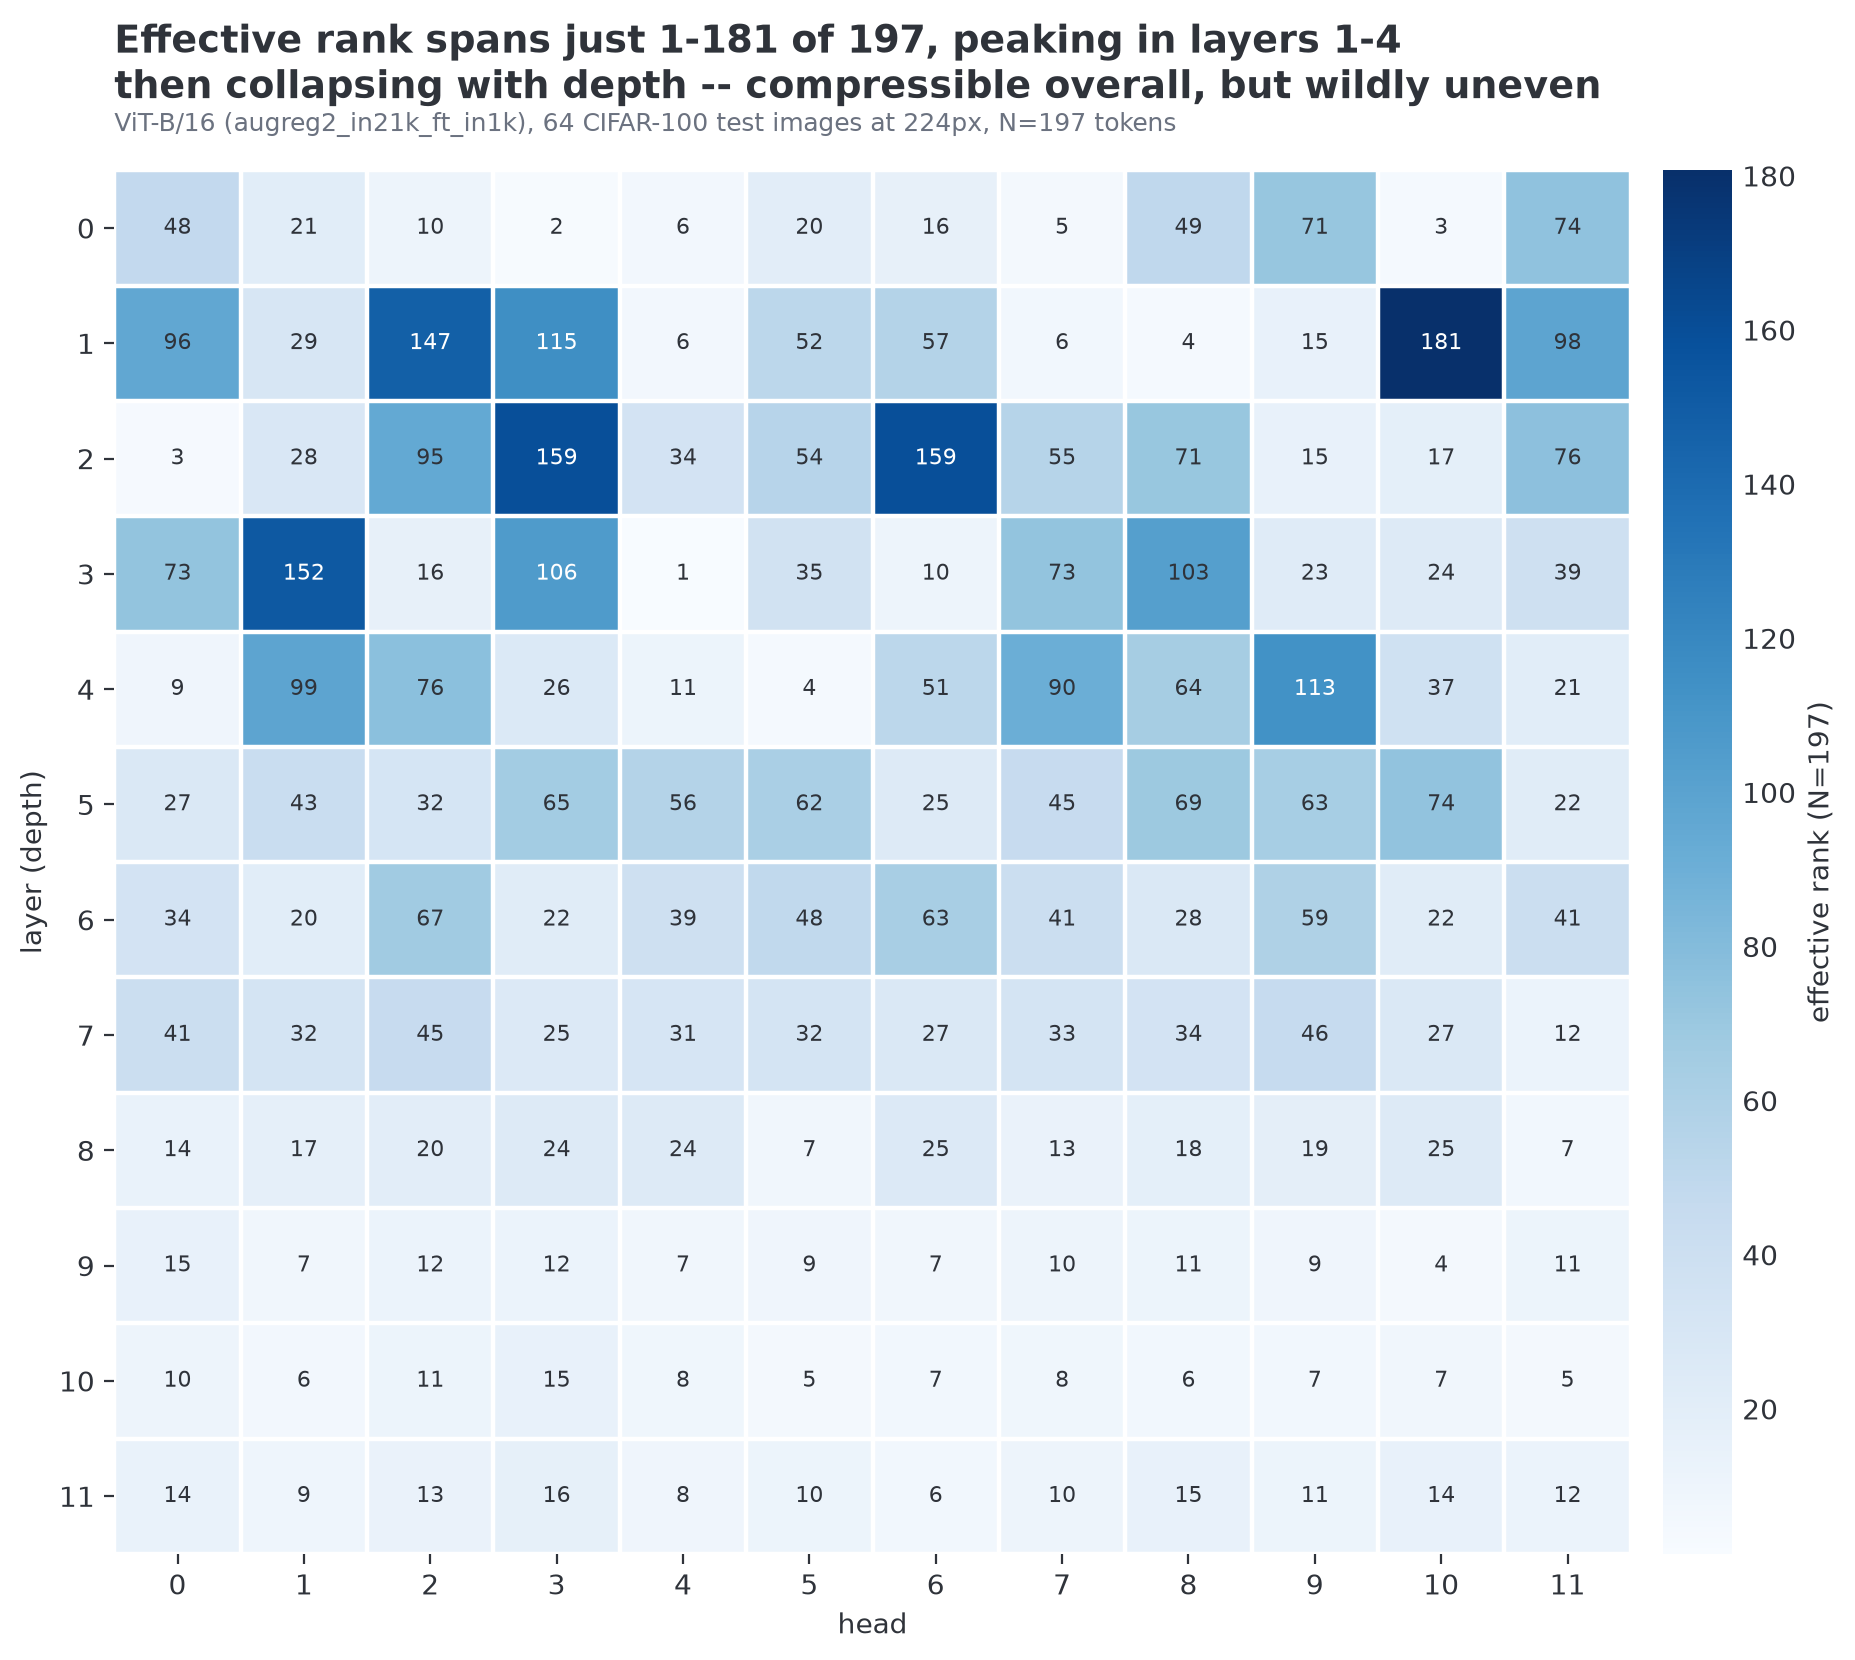
1. In aggregate, spectral theory looks right. Across all 144 heads of ViT-B/16, attention spectra decay steeply: the top singular value dominates, and the per-layer median effective rank is only ~7–54 out of 197 tokens. On paper, everything is compressible.
2. In practice, pure low-rank breaks the model. Truncating each attention matrix to its
Frobenius-optimal rank-64 approximation (the best any rank-64 scheme could ever do, by
Eckart–Young–Mirsky) still flips 23% of top-1 predictions vs the exact model. Every
full-model Nyström variant we tried — 3-softmax and Williams–Seeger formulations, with/without
pseudo-inverse regularisation, uniform and semantic landmarks, m from 32 to 160 — flips
between 27% and 99% of predictions. Frobenius error near zero, decisions destroyed.
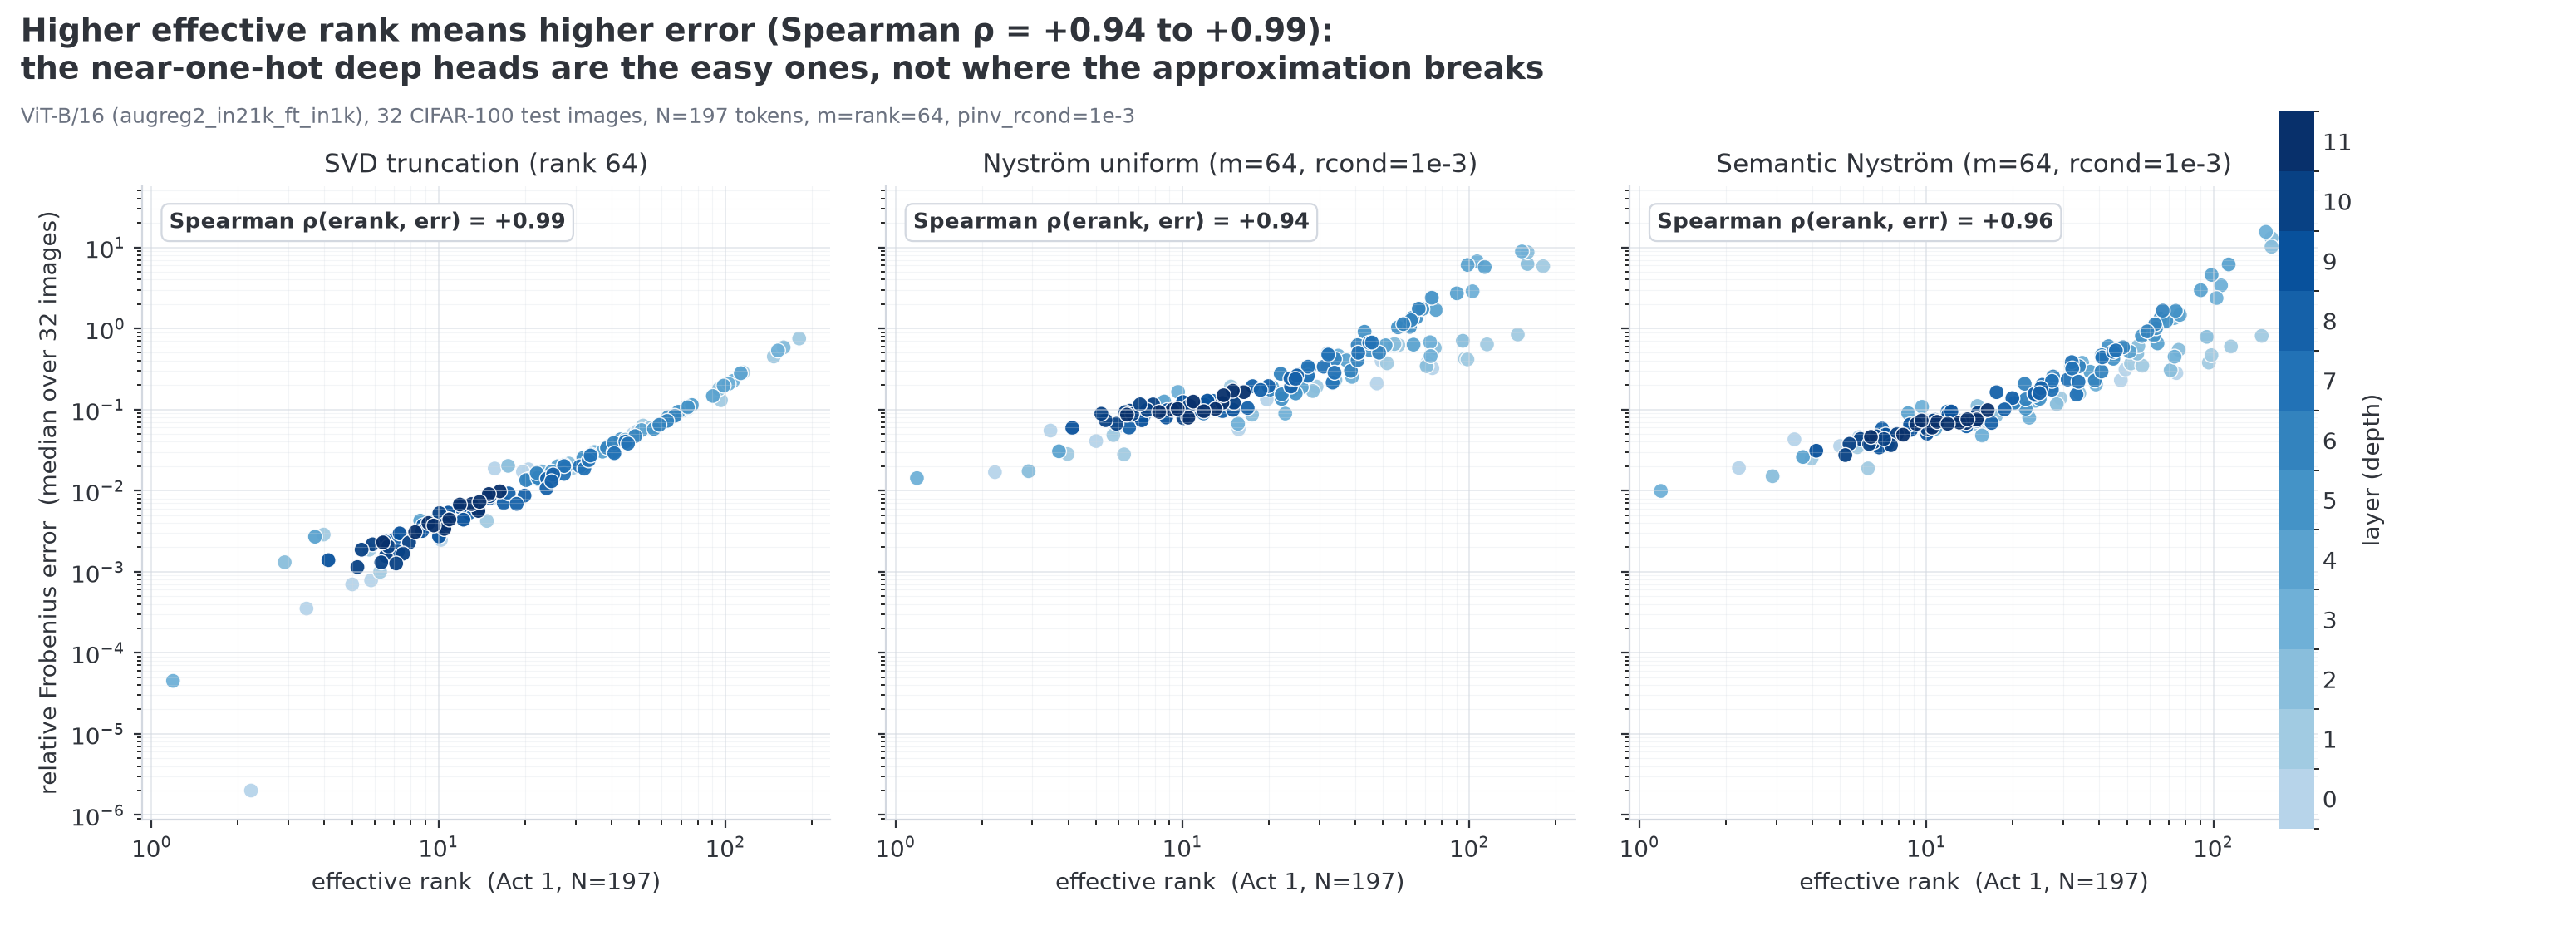
3. The mechanism: per-head error tracks effective rank almost perfectly. The heads that break the model are the near-full-rank ones in the early layers; the near-one-hot deep heads are trivial. Approximation error vs effective rank has Spearman ρ = +0.94 to +0.99.
4. The redemption: read the spectrum per layer and it tells you exactly where to cut. Approximate only the layers the error profile flags as safe (the shallow layer 0 plus the deep layers 8–11) and prediction flips collapse from ~66% to ~9% — and there, where approximation is actually viable, semantic landmark selection finally beats uniform (9.0% vs 10.4% flips). Approximate the hard middle layers {1–7} instead and you're back to 66%.
| What you patch (ViT-B/16, N=197, 512 CIFAR-100 images) | Method | Prediction flips ↓ |
|---|---|---|
| All 12 layers | SVD rank-64 (Frobenius-optimal ceiling) | 23% |
| All 12 layers | Nyström, m=64 | 92% |
| All 12 layers | Nyström, m=64, regularised pinv | 66% |
| Only low-rank layers {0, 8–11} | Nyström, m=64 | 10.4% |
| Only low-rank layers {0, 8–11} | Semantic-landmark Nyström, m=64 | 9.0% |
| Only high-rank layers {1–7} (inverse control) | Nyström, m=64 | 66% |
Punchline. Spectral theory doesn't lie uniformly — it lies in aggregate. Read per layer, it tells you exactly where approximation is safe.
5. And it survives real accuracy, not just decision-agreement. On real Tiny-ImageNet top-1 (the 182 of 200 classes that exist in the ImageNet-1k head, logits restricted to them, images upscaled 64→224, n≈500), spectrum-guided semantic patching is statistically indistinguishable from the exact baseline — 74.4% vs 74.0% — while approximating the full model collapses to 39.5% (Nyström) / 25.8% (semantic), a 35–48 point drop. Same lesson, now in accuracy points: approximate where the spectrum says it's safe and the model is untouched; approximate everywhere and it falls apart. Details in Results → v0.2.
6. On real ImageNet-1k, nothing is a bargain. The full grid on a seeded 1024-image slice of
ImageNet-1k validation, GPU, ten methods — and the two failure modes turn out to be disjoint.
Methods that never materialise A are genuinely cheap (1.1–1.5×) and destroy the task
(Linformer: 0.2%, chance level over 1000 classes). The one method that holds accuracy,
rank-64 SVD at −1.6 points, costs 223×. The single defensible trade in the whole table
is Nyströmformer: −10.1 points for 1.42× — and it comes from the published method, not from
any variant built here. Details in Results → v0.3.
(Every number above is re-measured by the harness in this repo, not quoted from anywhere —
see Reproducibility. ImageNet top-1 uses this repo's shared squash
transform, so absolute values sit below published timm figures — read the Δ columns; see
Scope & limitations.)
Quickstart
git clone https://github.com/matisdsp/vit-attention-bench
cd vit-attention-bench
pip install -e ".[dev]"        # PyPI package `vitattn` coming at first release
Swap the softmax attention of any pretrained timm ViT for an approximation — no retraining,
learned weights untouched:
import torch, timm
from vitattn import patch_vit, NystromAttention, is_patched

# 1. any pretrained timm ViT
model = timm.create_model("vit_base_patch16_224.augreg2_in21k_ft_in1k", pretrained=True).eval()

# 2. reroute the softmax core through an AttentionApprox (fresh instance per block)
patch_vit(model, lambda: NystromAttention(num_landmarks=64))
print("patched:", is_patched(model))          # -> True

# 3. forward pass, identical model API
with torch.no_grad():
    logits = model(torch.randn(1, 3, 224, 224))
print(logits.shape)                            # -> torch.Size([1, 1000])
patch_vit takes a zero-argument factory (not an instance) so every patched block gets its
own independent state; unpatch_vit(model) restores the original attention exactly. Pass
layer_indices=[...] to patch only selected blocks — that is the whole basis of the
spectrum-guided partial-patching result above.
Methods
All seven implementations subclass a single narrow contract, AttentionApprox:
forward(q, k, v, mask=None, *, return_attn=False) over per-head, already-projected
(B, H, N, d) tensors. The return_attn flag gates whether the O(N²) matrix  is ever
materialised, so the latency path pays exactly what native attention pays. Each method declares
materializes_attn — whether it can hand back the N×N matrix at all — and the harness skips
the approximation-error metric for those that structurally cannot.
| Method | Class | Family | Target complexity | materializes_attn |
Origin |
|---|---|---|---|---|---|
| Exact softmax (baseline) | ExactAttention |
fused SDPA | O(N²d) | ✅ | reference (F.scaled_dot_product_attention) |
| SVD truncation | SVDTruncatedAttention |
low-rank ceiling | O(N²d + N³) | ✅ | Eckart–Young–Mirsky (1936/1960) |
| Nyström (vanilla) | NystromAttention |
landmark low-rank | O(Nmd) | ✅ | Williams & Seeger, NeurIPS 2001 |
| Nyströmformer | NystromformerAttention |
landmark, sub-quadratic | O(Nmd) | ✅ | Xiong et al., AAAI 2021 (2102.03902) |
| Performer (FAVOR+) | PerformerAttention |
positive random features | O(NMd) | ✅ (diagnostic) | Choromanski et al., ICLR 2021 (2009.14794) |
| Linformer | LinformerAttention |
token-axis projection | O(Nkd) | ❌ | Wang et al., 2020 (2006.04768) |
| Semantic Nyström | SemanticNystromAttention |
landmark + semantic selection | O(Nmd) + selection | ✅ | author's MSc thesis idea, re-measured here |
Patching with ExactAttention reproduces the original model's logits to floating-point
tolerance — the "truth test" that validates the whole patching layer. SVDTruncatedAttention
and the diagnostic Nyström formulations form  on purpose (to measure error), so they are
reference instruments, not accelerators; the genuinely sub-quadratic fast paths live in
Nyströmformer, Performer, Linformer and semantic-Nyström's fast selector.
The benchmark
vitattn bench --config <yaml> patches a pretrained ViT method-by-method and writes one CSV row
per method. The measured columns that matter:
pred_change_rate— the headline metric: fraction of images whose argmax prediction disagrees with the exact model. Train-free, and the honest choice here (see Scope & limitations): an ImageNet-1k head scores ~0.2% top-1 against raw CIFAR-100 labels, so top-1 is uninterpretable — but decision agreement with the exact model is exactly what an approximation is supposed to preserve.approx_rel_frobenius— median relative Frobenius error ‖Â − A‖/‖A‖ of the approximated attention matrix vs exact, when the method materialises it.latency_p50_ms/latency_p95_ms— wall-clock per forward pass (warmup + repeats).top1/top5— reported for completeness; see the caveat above.flops_total/flops_attention— traced withfvcore.
Two honesty caveats, stated up front:
- FLOPs (
flops_note = sdpa-uncounted). The fused SDPA kernel is invisible tofvcore, so the exact baseline's attention FLOPs are not traced — FLOP counts understate the baseline and should be read as method-to-method deltas, not absolute costs. Latency is the honest cost signal. - Latency, and why "efficient" attention loses here. At N=197 tokens a fused SDPA kernel beats every approximation on wall-clock — the sub-quadratic methods are simply not supposed to win at this sequence length, and this benchmark says so plainly rather than hiding it. The point of the harness is accuracy fidelity, not a latency victory lap: it measures what low-rank approximation breaks, and at what rank the breakage starts.
Results
(ViT-B/16 augreg2_in21k_ft_in1k, CIFAR-100, 512 images, CPU — the quick protocol.)
Act 1 — the spectra are compressible, but wildly uneven
Median effective rank is low, but individual heads span ~1 to 181 out of 197: near-one-hot in the deep layers, near-full-rank in layers 1–4. Aggregate low-rank hides enormous per-head variance — the first hint that a uniform low-rank budget is the wrong tool.
Act 2 — full-model approximation fails, Frobenius error notwithstanding
| Method | Prediction flips ↓ | Rel. Frobenius | p50 latency | vs SDPA |
|---|---|---|---|---|
| Exact (SDPA baseline) | 0% | 0.000 | 288 ms | 1.0× |
| SVD truncation, rank 16 | 60% | 0.175 | 4685 ms | 16× |
| SVD truncation, rank 64 | 23% | 0.063 | 4546 ms | 16× |
| Nyström, m=32 | 99% | — | 467 ms | 1.6× |
| Nyström, m=64 | 92% | — | 770 ms | 2.7× |
| Nyström, m=64, regularised pinv | 66% | 0.92 | 876 ms | 3.0× |
| Nyström, m=160, regularised pinv | 27% | 0.21 | 3882 ms | 12× |
Even the Frobenius-optimal rank-64 truncation flips ~1 prediction in 4 at 0.063 relative
error. Nyström only reaches the ballpark of tolerable when m=160 — that is, when it stops
being a compression at all (160 of 197 tokens).
Act 3 — spectrum-guided partial patching, and where semantic selection finally wins
Patch only the low-rank / low-error layers {0, 8, 9, 10, 11} and the picture flips:
| Layers patched | Method | Prediction flips ↓ | Rel. Frobenius |
|---|---|---|---|
| {0, 8–11} (low-rank) | Nyström, m=64 | 10.4% | 0.183 |
| {0, 8–11} (low-rank) | Semantic Nyström, m=64 | 9.0% | 0.104 |
| {1–7} (high-rank, inverse control) | Nyström, m=64 | 66.2% | 1.45 |
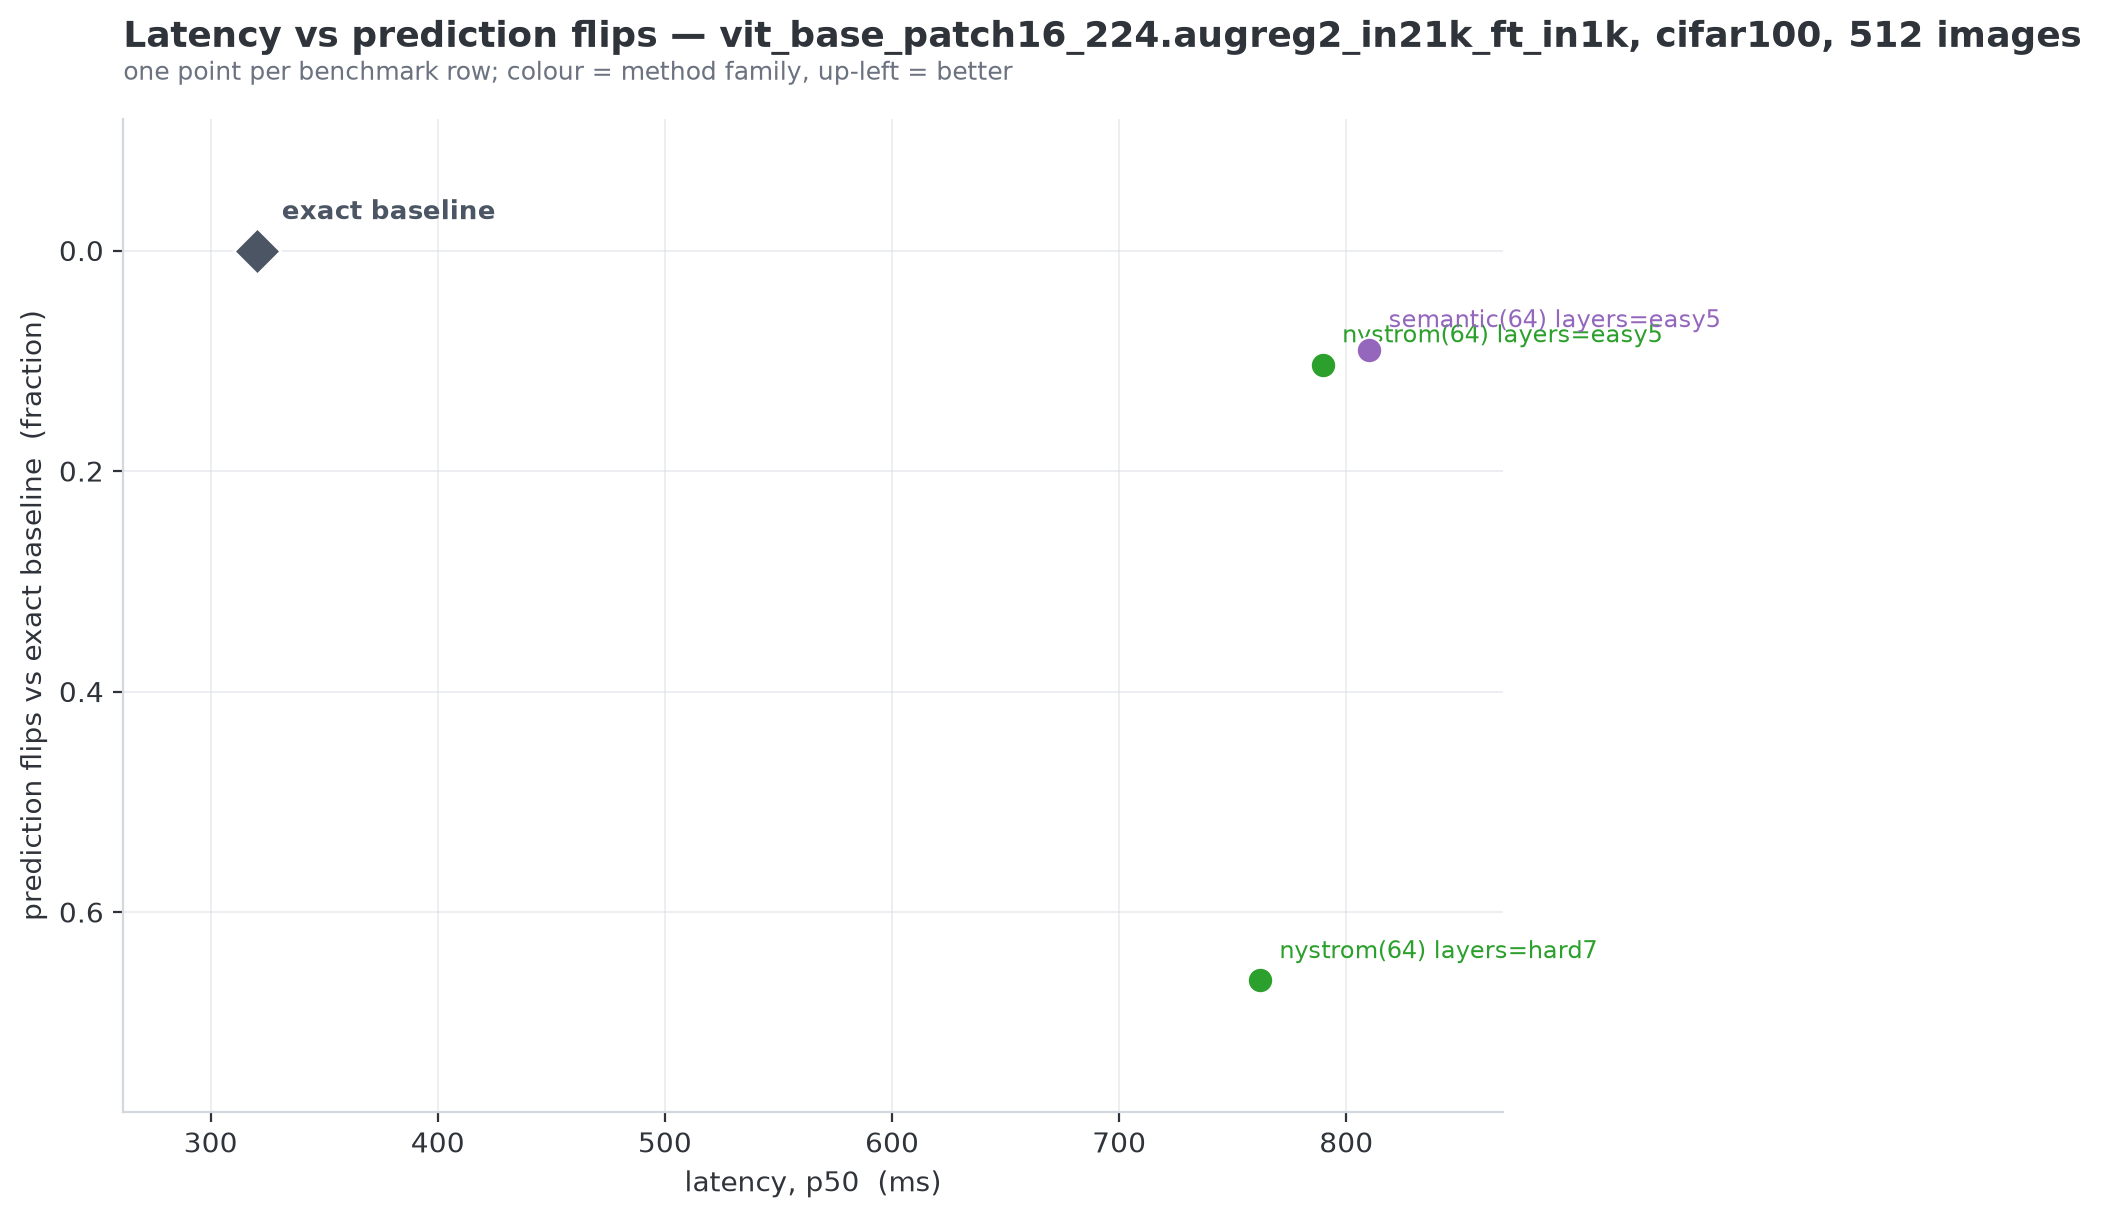
Two things land here. First, which layers you approximate matters far more than the method: the same Nyström kernel goes from 66% flips (hard layers) to 10% (easy layers). Second, once you're operating where approximation is viable, the semantic landmark selection pays off — 9.0% vs 10.4%, at lower Frobenius error too. On the full model that advantage was buried under catastrophic failure; restricting to the safe layers is what surfaces it.
v0.2 — real accuracy, more architectures, and a sequence-length sweep
Three follow-ups turn the CIFAR-100 decision-agreement story into (a) real classification accuracy, (b) a cross-architecture check, and (c) a latency sweep that measures — rather than asserts — why efficient attention doesn't win at these lengths.
Real accuracy (Tiny-ImageNet). The prediction-flips metric exists because an ImageNet-1k head scores ~0.2% top-1 on raw CIFAR-100. Tiny-ImageNet removes that mismatch: 182 of its 200 classes exist in the ImageNet-1k head, so we drop the other 18, restrict logits to the 182, upscale the 64×64 images to 224, and evaluate 512 seed-0 images (n≈500 after the class filter). Now top-1 is a real number:
| What you patch (ViT-B/16, Tiny-ImageNet, 182-class head, n≈500) | Real top-1 ↑ |
|---|---|
| Exact baseline | 74.0% |
| SVD rank-64, all 12 layers (Frobenius-optimal ceiling) | 69.7% |
| Nyström m=64, all 12 layers | 39.5% |
| Semantic Nyström m=64, all 12 layers | 25.8% |
| Nyström m=64, only easy layers {0, 8–11} | 73.4% |
| Semantic Nyström m=64, only easy layers {0, 8–11} | 74.4% |
Approximating the full model sheds 35–48 accuracy points. Restricted to the five easy layers, semantic patching lands at 74.4% vs the baseline's 74.0% — statistically indistinguishable at n≈500 (it also flips only 6.3% of predictions vs 8.2% for uniform landmarks). This is not "beating" the baseline; it is matching it while approximating five of twelve attention layers — which is exactly the claim the whole repo is trying to earn.
Architecture robustness (ViT-S/16, DeiT3-S/16). The failure mode is not a ViT-B artifact — it reproduces and worsens on smaller models (CIFAR-100, all 12 layers, m=64, 512 images, prediction flips):
| Method (all 12 layers, m=64) | ViT-S/16 | DeiT3-S/16 |
|---|---|---|
| SVD rank-64 (Frobenius-optimal ceiling) | 38.9% | 53.1% |
| Nyström, regularised pinv | 98.2% | 96.3% |
| Semantic Nyström, regularised pinv | 99.6% | 99.6% |
The Frobenius-optimal rank-64 ceiling flips 38.9% (ViT-S) and 53.1% (DeiT3) of predictions, versus 22.9% on ViT-B — the smaller the model, the less redundancy there is to give away, so pure low-rank bites harder. Full-model Nyström/semantic variants sit at 96–99.6% flips on both, just as on ViT-B. (The per-architecture easy-layer profile is not re-derived here — the partial-patch map is ViT-B specific; extending it per model is future work.)
Sequence-length sweep (latency-only). Does the latency verdict flip if the sequence grows? Measured over a complete ViT-B forward in eager mode on CPU (batch 4), sweeping N ∈ {197, 577, 785} via image size {224, 384, 448} — speedup vs exact SDPA:
| N (image size) | Linformer | Nyströmformer | Performer | Semantic-fast |
|---|---|---|---|---|
| 197 (224²) | 0.84× | 0.53× | 0.62× | 0.35× |
| 577 (384²) | 0.98× | 0.78× | 0.70× | 0.63× |
| 785 (448²) | 0.99× | 0.75× | 0.72× | 0.72× |
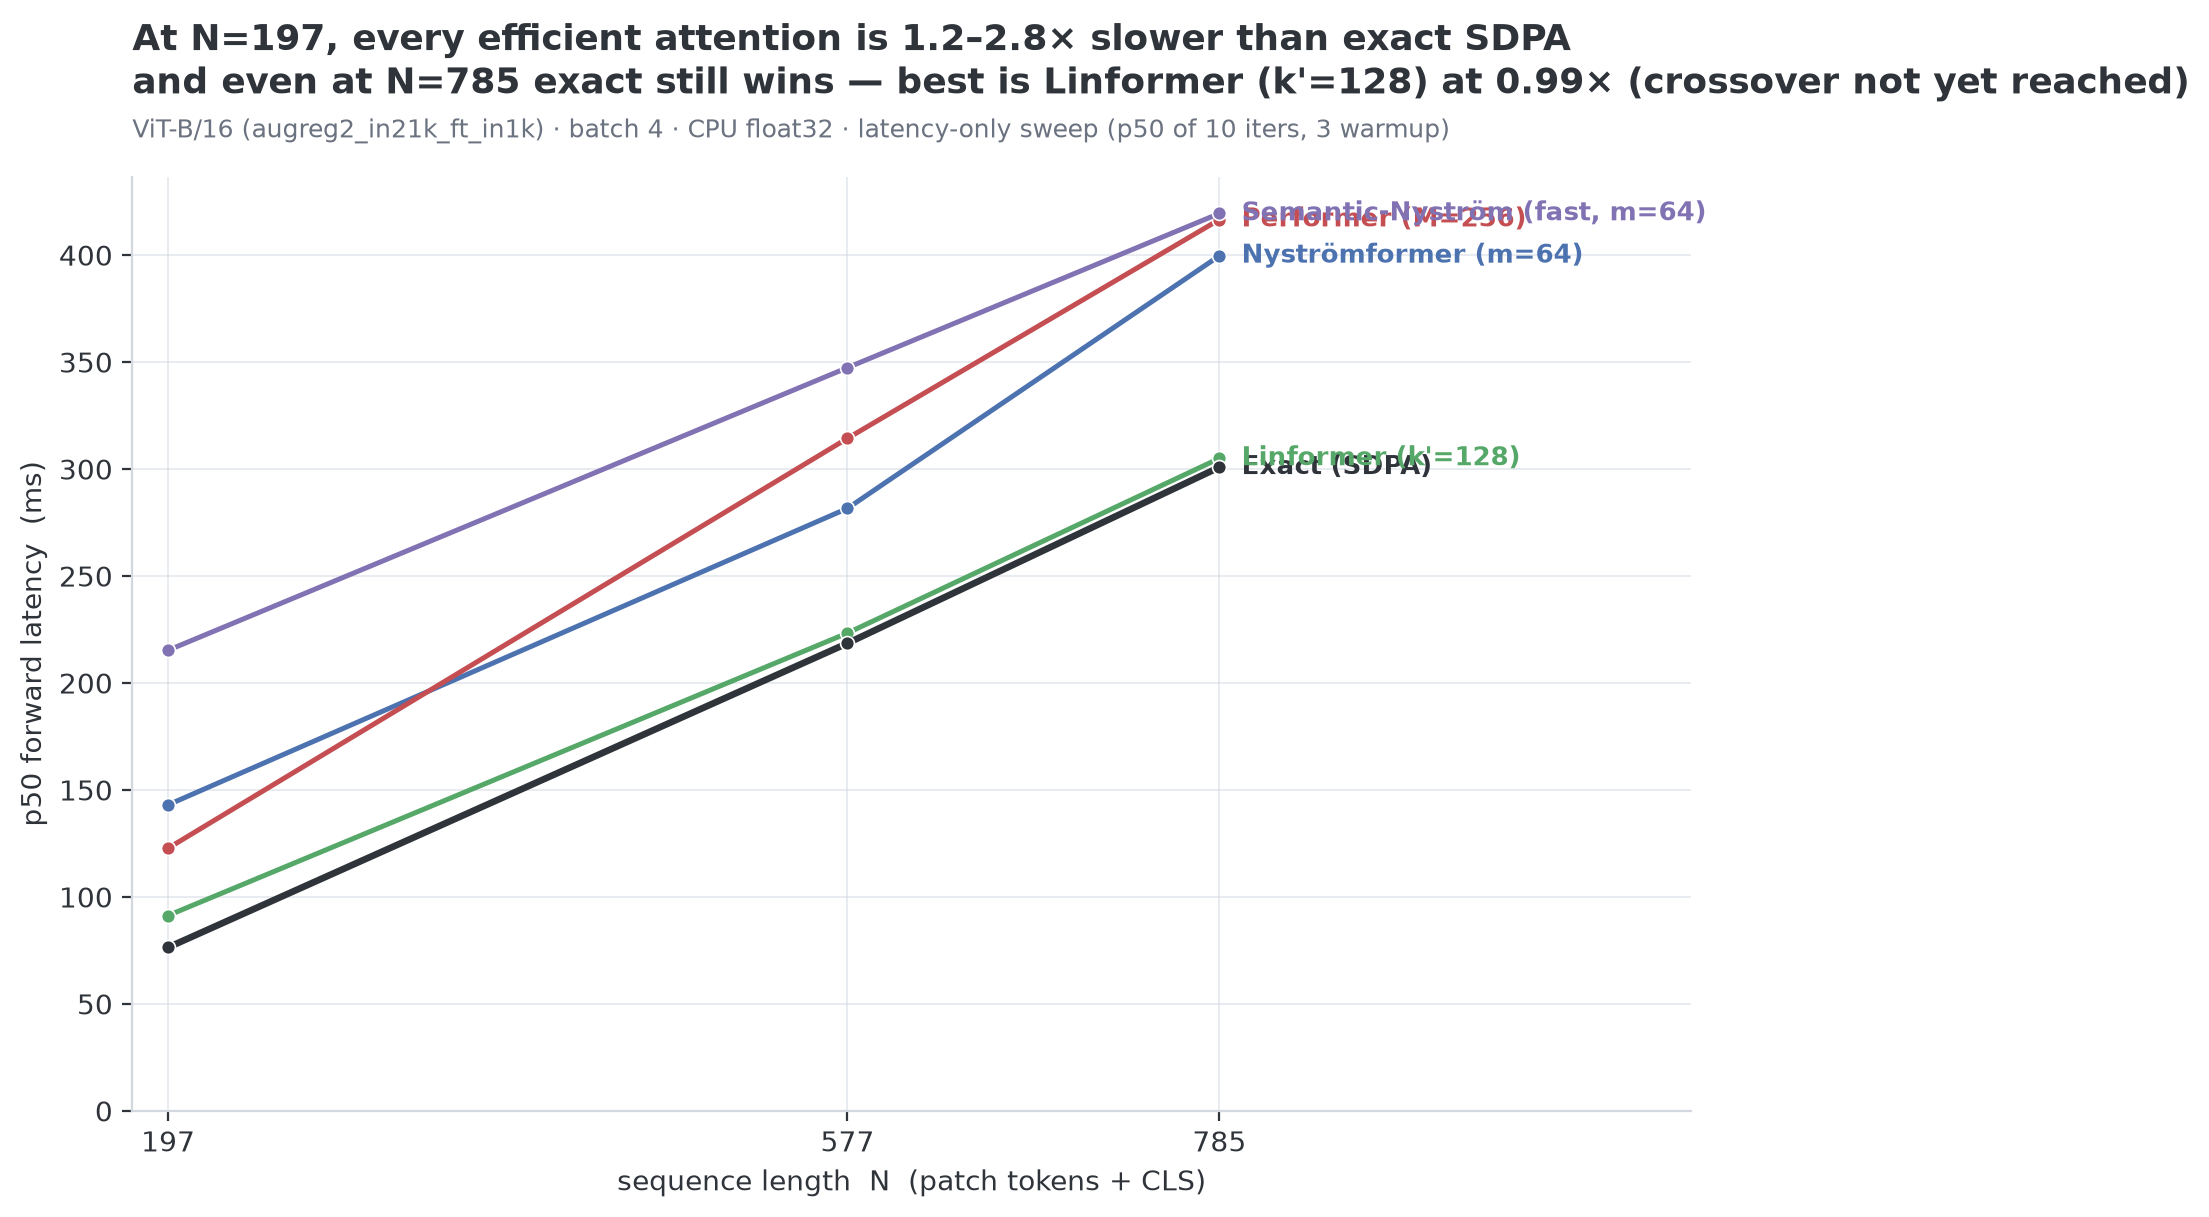
No method crosses 1.0× at any tested length, but every trend closes the gap monotonically (Nyströmformer 0.53→0.75, semantic-fast 0.35→0.72, Linformer already 0.99× at N=785). The honest read: in eager mode on CPU, over a full ViT-B forward, the fixed overhead of the efficient kernels still dominates their asymptotic savings at these lengths; a linear extrapolation puts the crossover past N>1000. This is the same "short sequences don't favour efficient attention" caveat as before — now measured across length instead of asserted at a single point.
v0.3 — the real ImageNet-1k validation set, on GPU
Everything above runs on stand-ins: CIFAR-100 upscaled from 32×32, or Tiny-ImageNet restricted
to a 182-class head. The measurement that actually counts for a ViT-B/16 pretrained at 224² is
ImageNet-1k itself, on the head it was trained for. Here it is — all ten methods, one seeded
1024-image slice of timm/imagenet-1k-wds (validation), one RTX A4000:
| Method (all 12 layers) | Real top-1 ↑ | Δ vs exact | p50 latency | vs SDPA | Rel. Frobenius |
|---|---|---|---|---|---|
| Exact (SDPA baseline) | 79.7% | — | 296 / 282 ms | 1.0× | — |
| SVD truncation, rank 64 (Frobenius-optimal ceiling) | 78.1% | −1.6 | 66 119 ms | 223× | 0.087 |
| Nyströmformer, m=64 | 69.6% | −10.1 | 401 ms | 1.42× | 0.43 |
| SVD truncation, rank 16 | 68.3% | −11.4 | 66 219 ms | 223× | 0.247 |
| Nyström, m=64 | 31.1% | −48.6 | 11 647 ms | 39× | 7.17 |
| Semantic Nyström, m=64 (fast) | 17.6% | −62.1 | 12 005 ms | 43× | 39.8 |
| Performer, 256 features | 14.6% | −65.0 | 424 ms | 1.50× | 1.05 |
| Semantic Nyström, m=64 (k-means) | 10.0% | −69.7 | 12 295 ms | 41× | 16.9 |
| Nyström, m=32 | 4.4% | −75.3 | 347 ms | 1.23× | 14.0 |
| Linformer, proj 64 | 0.2% | −79.5 | 309 ms | 1.10× | — |
The two failure modes are now explicit, and they are disjoint. Methods that never
materialise A are genuinely cheap — 1.1× to 1.5× — and destroy the task: Linformer lands at
0.2%, i.e. chance level over 1000 classes, because its fixed JL projection is untrained
(as its docstring warns). Conversely the only method that preserves accuracy, rank-64 SVD at
−1.6 points, costs 223×. There is no configuration in this table where compressing
attention is a win over just running SDPA.
One exception, and it is the repo's actual Pareto point: Nyströmformer, −10.1 points for 1.42×. It is the only line here that reads like a defensible trade, and it comes from the published, peer-reviewed method rather than from any variant built for this benchmark. Even so, at N=197 the honest verdict stands: paying 42% more latency to lose 10 accuracy points is not a bargain — it is merely the least-bad option.
Semantic landmark selection loses to uniform again (10.0% vs 31.1% at m=64), reproducing on ImageNet what CIFAR-100 and Tiny-ImageNet already showed. The thesis' contribution does not rescue full-model approximation on any of the three datasets; it only wins inside the spectrum-guided partial patch of Act 3.
Protocol: 1024 seeded images (95% CI ≈ ±2.5 pt; the gaps above run from 1.6 to 79.5 pt). The
grid ran as two GPU sessions, so the baseline was measured twice — 296 ms (SVD and Nyström
rows) and 282 ms (Nyströmformer, Performer, Linformer rows); each vs SDPA ratio uses the
baseline from its own session. exact was re-run in both halves and reproduced
0.796875 / 0.950195 to the digit, which is what makes the two result files comparable.
Reproduce with scripts/runpod_bench.sh.
Why low-rank theory misleads
The spectral argument is not wrong — it's aggregated at the wrong granularity. Per head, approximation error rises monotonically with effective rank (Spearman ρ = +0.94 to +0.99 across SVD, uniform-Nyström and semantic-Nyström, all measured against the Act-1 ranks):
The trap is that the compressible heads (deep, near-one-hot, low rank) are already cheap and harmless to approximate — they contribute almost nothing to the error budget. The heads that actually decide the output are the high-effective-rank heads in the early layers, and those are precisely the ones a low-rank scheme cannot represent. Average the spectrum over all heads and it looks compressible; the model's decision, though, lives in the tail the average smooths away.
Concretely, that is why the partial-patch control works: the layers that survive approximation
{0, 8–11} are the ones dominated by low-rank heads, and the layers that don't {1–7} are the
ones carrying the high-rank heads. The effective-rank profile is a per-layer map of where
approximation is safe — and reading it that way is the difference between 9% and 66% flips.
📄 The long-form version of this story — how the finding was actually arrived at, including the dead ends — is in The low-rank lie.
Scope & limitations
Deliberately narrow, and honest about it:
- Three architectures, not one — but all ViT-family. ViT-B/16
augreg2_in21k_ft_in1kis the primary subject; v0.2 adds ViT-S/16 and DeiT3-S/16, where the full-model failure reproduces and worsens. All three use global self-attention. Swin and other windowed/hierarchical attentions are out of scope: their attention is local per shifted window, not one global N×N matrix, so the aggregate-vs-per-layer spectral story doesn't transfer without redefining the object being approximated — that's a separate study, not a knob to flip here. - Three datasets, and ImageNet-1k is a 1024-image slice, not the full 50k. CIFAR-100 test (512 images) for decision agreement, Tiny-ImageNet val for real top-1 via the 182-class shared-head protocol (n≈500), and v0.3's seeded 1024-image slice of ImageNet-1k validation (95% CI ≈ ±2.5 pt). The slice is a deliberate trade: the low-rank methods run ~400× slower than fused SDPA, so the full 50k split costs ~11 GPU-hours per method — and the gaps being measured (1.6 to 79.5 points) are one to two orders of magnitude wider than the interval. These are effect-size measurements, not a leaderboard entry.
- ⚠️ ImageNet top-1 is not comparable to published numbers. The baseline scores 79.7%
where
timmreports ~85% for this checkpoint, and the gap is protocol, not a bug: every dataset here goes through the sameResize((224, 224))squash, whereas the standard ImageNet eval isResize(256) + CenterCrop(224). Sharing one transform across CIFAR-100, Tiny-ImageNet and ImageNet is what makes the three sets of rows comparable to each other; it also costs a few points of absolute accuracy. Read the Δ columns, not the absolute top-1. - Latency is measured on two different machines. CIFAR-100 and the sequence-length sweep are eager-mode CPU (Apple M-series); the v0.3 ImageNet grid is CUDA (RTX A4000). Ratios are only meaningful within a table — each one is computed against the exact-SDPA baseline measured in the same session. Wall-clock is machine-, kernel- and mode-specific throughout.
- Train-free. Attention is swapped with no fine-tuning. Learned/trained variants (e.g. Linformer's trained projection, or fine-tuning the patched model) would very plausibly recover accuracy — measuring that is future work, not a current claim.
- Short-to-moderate sequences (N=197–785). The efficient-attention methods are not expected to win on latency at these lengths, and the v0.2 sweep confirms they don't (crossover extrapolated past N>1000). The interesting axis here is accuracy fidelity vs rank, not throughput.
- Real top-1 where a compatible head exists; prediction-flips otherwise. On Tiny-ImageNet the ImageNet-1k head is directly usable (shared classes), so top-1 is meaningful and reported. On CIFAR-100 there is no compatible head — top-1 against raw labels is uninformative — so agreement with the exact model's decision remains the honest, train-free fidelity metric.
Reproducibility
Everything above regenerates from the shipped configs. Fixed seeds, pinned dtype, deterministic landmark selection.
# Act 2 — full-model sweep (SVD / Nyström / semantic), 512 CIFAR-100 images
vitattn bench --config configs/quick_cifar.yaml

# Act 3 — formulations, landmark-count sweep, and the spectrum-guided partial patch
vitattn bench --config configs/act3_formulations.yaml
vitattn bench --config configs/act3_sweep_m.yaml
vitattn bench --config configs/act3_partial_patch.yaml

# v0.2 — real accuracy (Tiny-ImageNet, 182-class head), cross-architecture, seq-length sweep
vitattn bench --config configs/act5_tiny_imagenet.yaml
vitattn bench --config configs/act5_vit_small.yaml
vitattn bench --config configs/act5_deit3_small.yaml
python scripts/act5_seqlen_sweep.py    # latency-only sweep over N ∈ {197, 577, 785} -> docs/figures/act5_seqlen.png

# render the Pareto / heatmap figures from any results CSV
vitattn figures --csv results/quick_cifar.csv
- CSV outputs land in
results/, one row per method, each accompanied by a*.config.jsoncapturing the exact sweep that produced it. - Environment. Python ≥ 3.11, PyTorch ≥ 2.2,
timm≥ 1.0. CI (GitHub Actions) runs ruff + black + pytest on CPU-only PyTorch — see.github/workflows/ci.yml. - Dev loop.
make setup(venv + editable install + pre-commit),make test,make lint.
Extending
Adding a new approximation is a single subclass: set materializes_attn and implement
_forward_impl(q, k, v, mask, need_attn) -> (out, attn_or_none). The base class owns the
return_attn / materializes_attn contract so every method stays drop-in behind patch_vit.
See CONTRIBUTING.md for the full walkthrough, the test conventions, and how
to wire a new method into a benchmark config.
Context & author
Matis Despujols — computer vision, low-rank structure in transformers, and honest evaluation. GitHub @matisdsp.
The semantic-landmark selection idea originates from the author's MSc thesis; every number in this repo is independently re-measured by this benchmark from public data with from-scratch code — none of the thesis's own figures are reproduced here.
Despujols, M. (2025). Spectral Analysis and Low-Rank Approximation of Attention Matrices in Vision Transformers. MSc thesis, KTH Royal Institute of Technology.
Other published work:
racineai/UI-DETR-1— UI element detection.- IEEE BigData 2025.
Citation
@software{despujols_vitattn_2026,
  author  = {Despujols, Matis},
  title   = {vit-attention-bench: attention approximation for Vision Transformers
             with a reproducible speed/accuracy benchmark},
  year    = {2026},
  url     = {https://github.com/matisdsp/vit-attention-bench},
  license = {Apache-2.0}
}
License
Apache License 2.0 © 2026 Matis Despujols.
Apache-2.0 rather than MIT for the explicit patent grant (§3): contributors and users get a
licence to any patent claims the contribution reads on, which matters for a repo implementing
published algorithms. Releases up to and including v0.2.1 were published under MIT and stay
MIT — the change applies from v0.3.0 onward.
1 maintainer

Download files
Download the file for your platform. If you're not sure which to choose, learn more about installing packages.
Source Distribution
Built Distribution
Filter files by name, interpreter, ABI, and platform.
If you're not sure about the file name format, learn more about wheel file names.
Copy a direct link to the current filters
File details
Details for the file vitattn-0.4.0.tar.gz.
File metadata
- Download URL: vitattn-0.4.0.tar.gz
- Upload date:
- Size: 166.8 kB
- Tags: Source
- Uploaded using Trusted Publishing? No
- Uploaded via:
twine/6.2.0 CPython/3.14.5
File hashes
| Algorithm | Hash digest | |
|---|---|---|
| SHA256 |
7193b57bb15a7daef4f24a7e1b31c465c454905a553f349868b30a19ac10b84e
|
|
| MD5 |
a35cedb47768b5a482b28267744bf5ca
|
|
| BLAKE2b-256 |
57c4fd2d45234ea5642817572132f5b2b34da42bc4b4a6269be3c91004f39a28
|
File details
Details for the file vitattn-0.4.0-py3-none-any.whl.
File metadata
- Download URL: vitattn-0.4.0-py3-none-any.whl
- Upload date:
- Size: 114.7 kB
- Tags: Python 3
- Uploaded using Trusted Publishing? No
- Uploaded via:
twine/6.2.0 CPython/3.14.5
File hashes
| Algorithm | Hash digest | |
|---|---|---|
| SHA256 |
ab936c729d6b5c1d8fe3e31d2870f477427a76568b4b312f2ca2909a092986f5
|
|
| MD5 |
51f066373461fd2194097a32330466df
|
|
| BLAKE2b-256 |
0bf1cbd7f75b1070e22f158e7f9bb2d21a8380876a92083b024ffe71e4629595
|














