Easier data analysis and visualization based on pydeequ

Project description
Vivqu: easier data analysis and visualization based on pydeequ
1. Background
Feature quality is of great important to machine learing model performance, in order to insure the intactness of data that come from multiple upstream data sources, I devised a data quality checking library for post monitoring, which is named vivqu.
Based on PyDeequ, it gives data scientists deep insight into the data quality, and enable them to check whichever metrics they are insterested in. It also simplifies the intricate process when using PyDeequ directly and make users able to do the checking job within a few lines of code.
Vivqu consists of several parts:
- QualityChecker: provides simplified interfaces to measure the quality of a dataframe.
- DataLoader: provides different ways to load data from multiple sources.
- Visualizer: provides visualization for one analysis result or show differences for two or more results.
2. Requirement
-
python version >= 3.7
-
pyspark version < 3.1, >= 2.4
-
pydeequ version >= 1.0
-
heatmapz == 0.0.4
If you don't have a java runtime environment (jre) on your computer, please choose one from Latest releases | Adoptium.
3. Installation
This project has been packaged and uploaded to vivqu · PyPI.
You can install vivqu with pip, which will automatically download pyspark, pydeequ and matplotlib with appropriate version.
pip install vivqu
4. Example with Jupyter Notebook
You can follow this example in a jupyter notebook. Prepare a sample csv file, and let's start!
Import pyspark, pydeequ and vivqu.
import pyspark
from pyspark.sql import SparkSession
import pydeequ
from pydeequ.analyzers import *
import vivqu
Import matplotlib, change figure format to make it more clear.
import matplotlib.pyplot as plt
# add this command if you want to show chinese character
plt.rcParams['font.sans-serif'] = ['Arial Unicode MS']

%matplotlib inline
# you can choose from png, svg and retina
%config InlineBackend.figure_format = 'retina'
Create a spark session locally, you can also use a remote spark session.
spark_session = (
    SparkSession.builder
    .config("spark.jars.packages", pydeequ.deequ_maven_coord)
    .config("spark.jars.excludes", pydeequ.f2j_maven_coord)
    .getOrCreate()
)
Import DataLoader to load data from csv file.
from vivqu.loader import DataLoader

loader = DataLoader(spark_session)
df = loader.load_csv("transaction_100a.csv")
df.printSchema()

Create quality checker by providing it with a spark session.
from vivqu.checker import *

checker = QualityChecker(spark_session)
Assign default metrics to columns that you are interested, then start analyzing.
Add column names in string format means that they are analyzed in default way, which contain:
-
Completeness,CountDistinct,Histogramfor column of Category type; -
Completeness,ApproxQuantiles,Maximum,Minimumfor column of Numeric type.
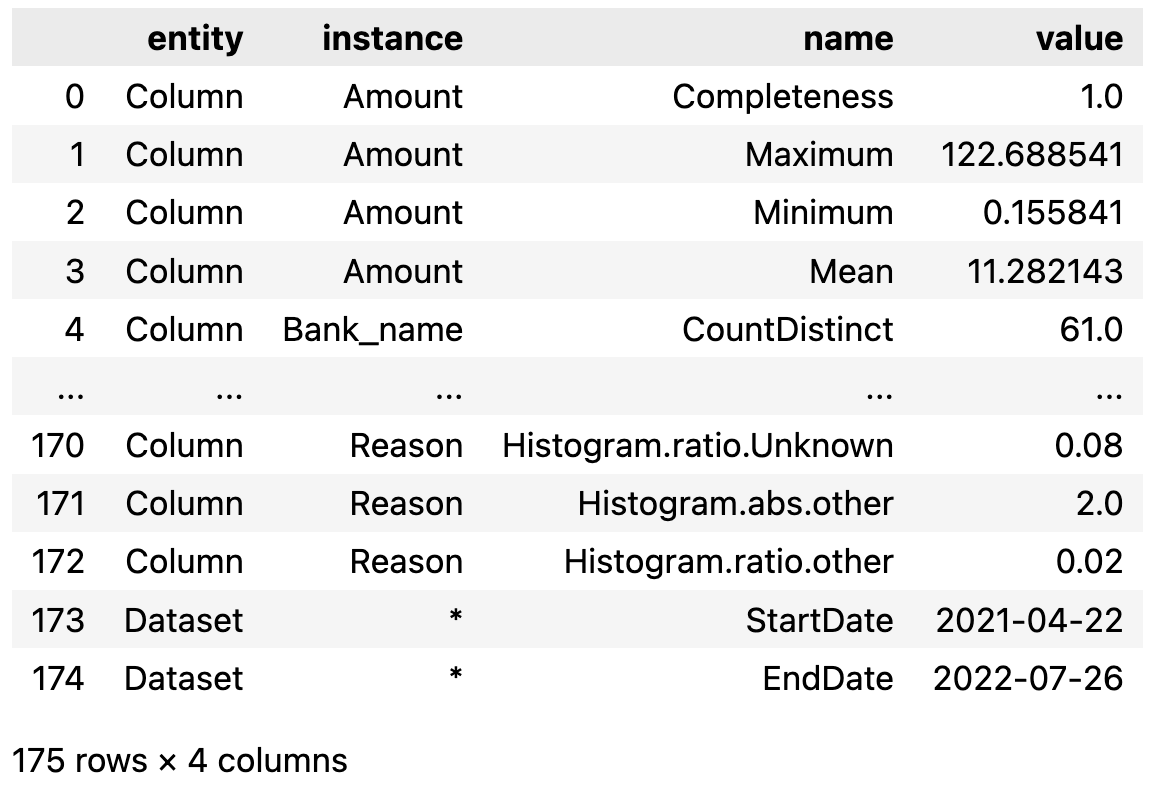
If you want to see the start and end date of this data frame, pass the column name of time information to analyze function.
result_all_default = checker.analyze(
    df, [
    "Transaction_reason",
    "Beneficiary_bank_name",
    "Original_amount_USD",
    ],
    "Datetime_created"
)
result_all_default
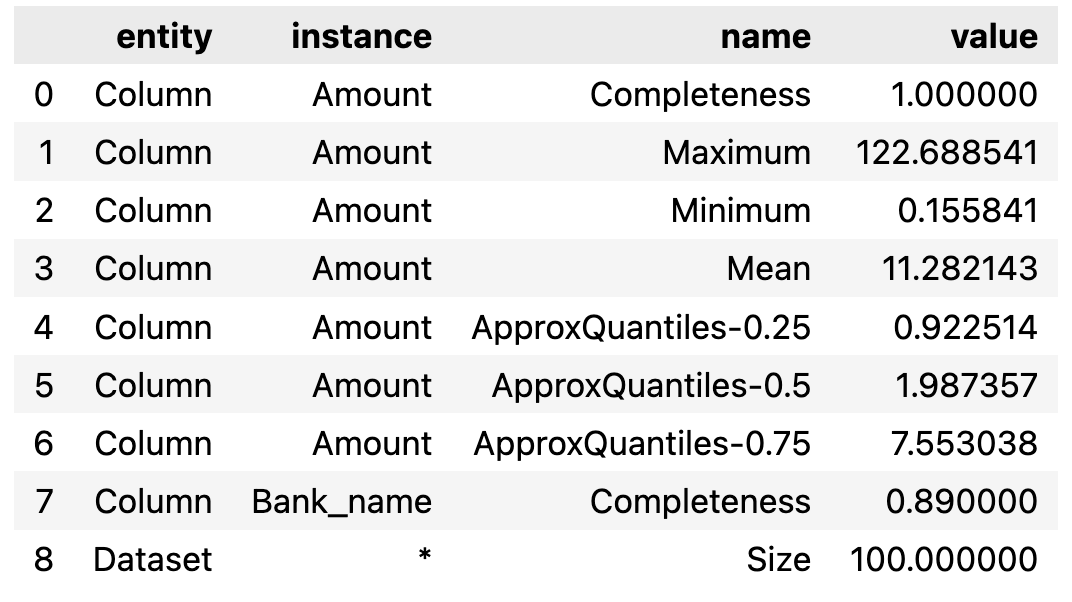
You can also add some other metrics and run.
result_add_metric = checker.analyze(
    df, [
    "Original_amount_USD",
    Size(),
    Completeness("Beneficiary_bank_name"),
    ]
)
result_add_metric
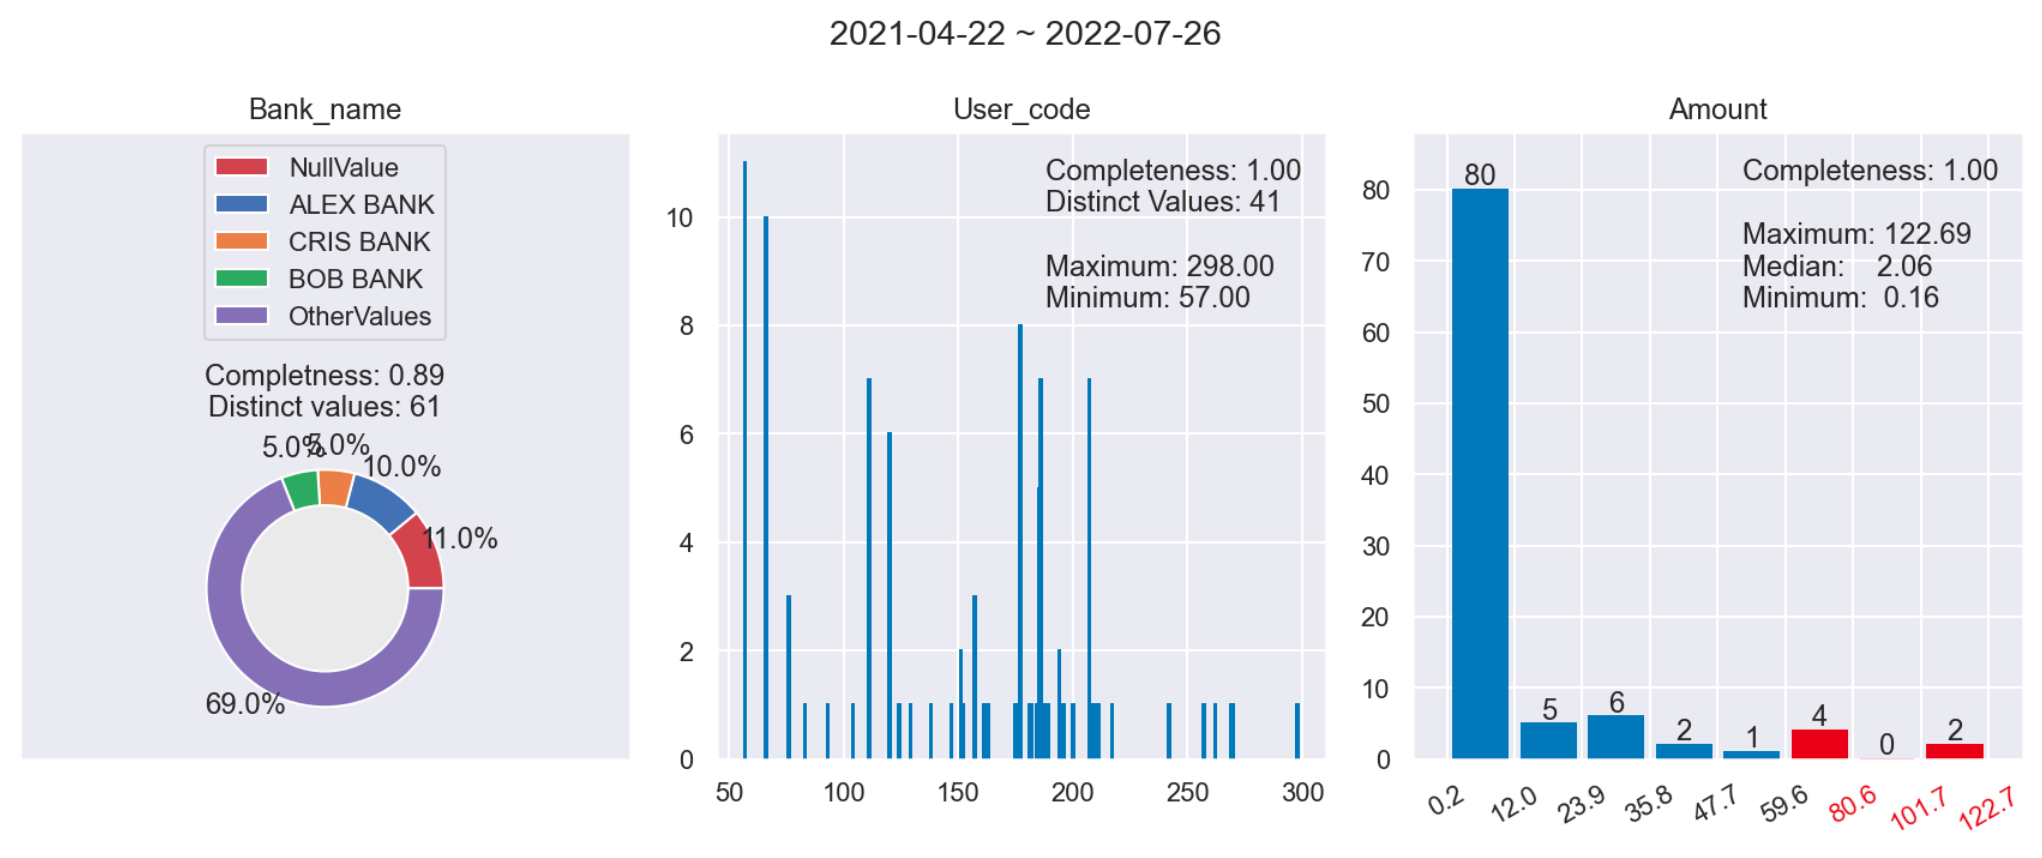
To visualize, you need to specify checker, dataframe, columns and date_column(Optional) parameter in visualize() function.
from vivqu.visualize import *

visualize(
    checker, df, [
    "Beneficiary_bank_name",
    "Originator_category_code",
    "Original_amount_USD",
    ],
    "Datetime_created"
)
Use diff() function to visualize specific columns between several dataframes.
df1 = loader.load_csv("transaction_100a.csv")
df2 = loader.load_csv("transaction_100b.csv")
df3 = loader.load_csv("transaction_100c.csv")

diff(
    checker,
    [df1, df2], [
    "Beneficiary_bank_name",
    "Originator_category_code",
    "Original_amount_USD",
    ]
)
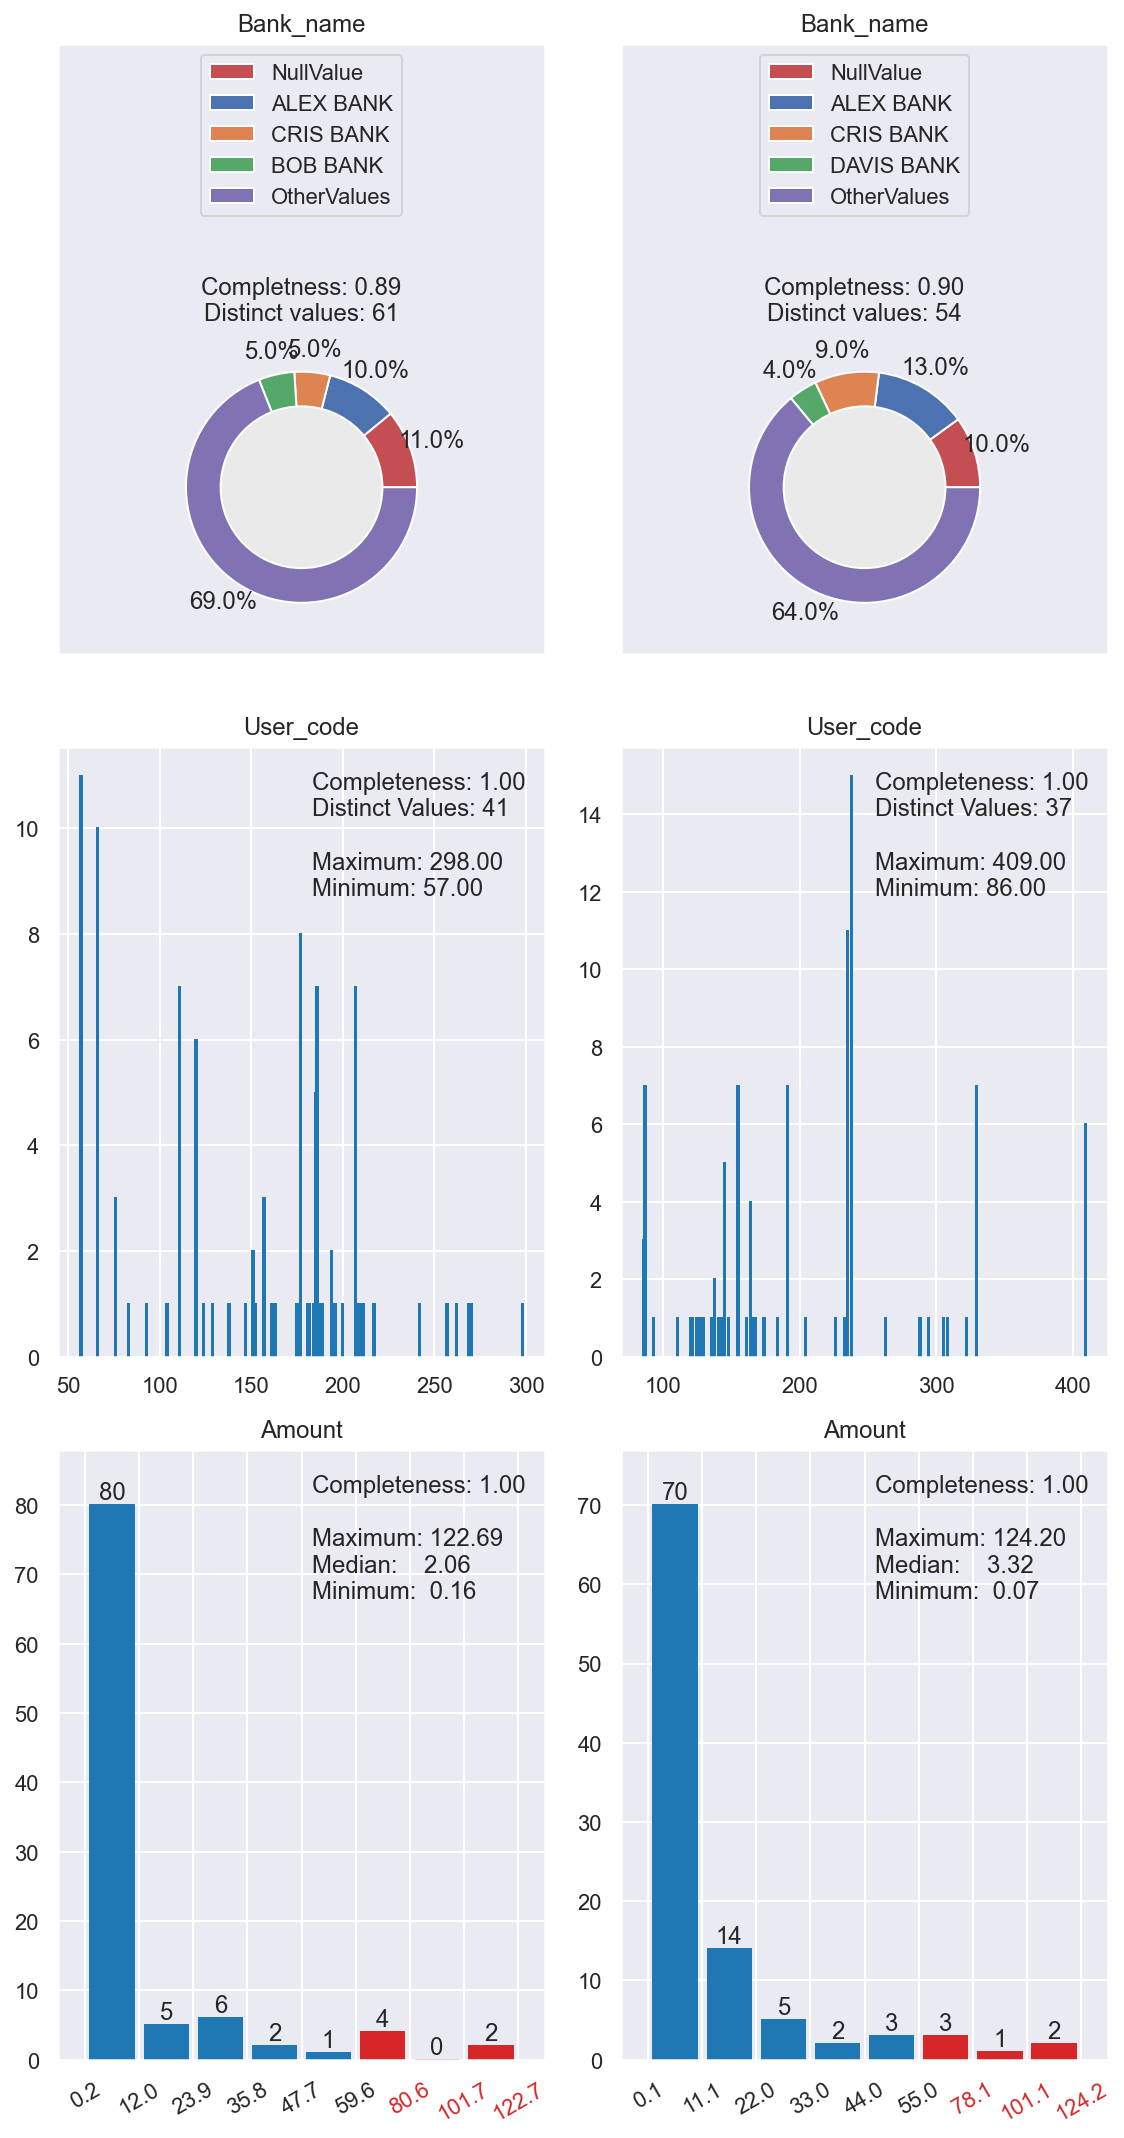
If you pass date_column parameter to diff(), the start and end date of each data frame will be shown.
diff(
    checker,
    [df1, df2, df3], [
    "Beneficiary_bank_name",
    "Original_amount_USD",
    "Transaction_reason",
    ],
    "Datetime_created"
)

You can use Verifier to set constraints and see. verification result on given dataframe
verifier = Verifier(checker)

result = verifier.verify(
    df1, [
    (Uniqueness(["ID"]), lambda x: x == 1, "ID has no duplicate"),
    (Completeness("Booking_Legal_Entity_ID"), lambda x: x == 1,
     		"Booking_Legal_Entity_ID has no null value"),
    (Completeness("Transaction_reason"), lambda x: x == 1,
     		"Transaction_reason has no null value"),
    (Size(), lambda x: x > 50, "Dataset size is larger than 50")
])

print(result)
[True, True, False, True]
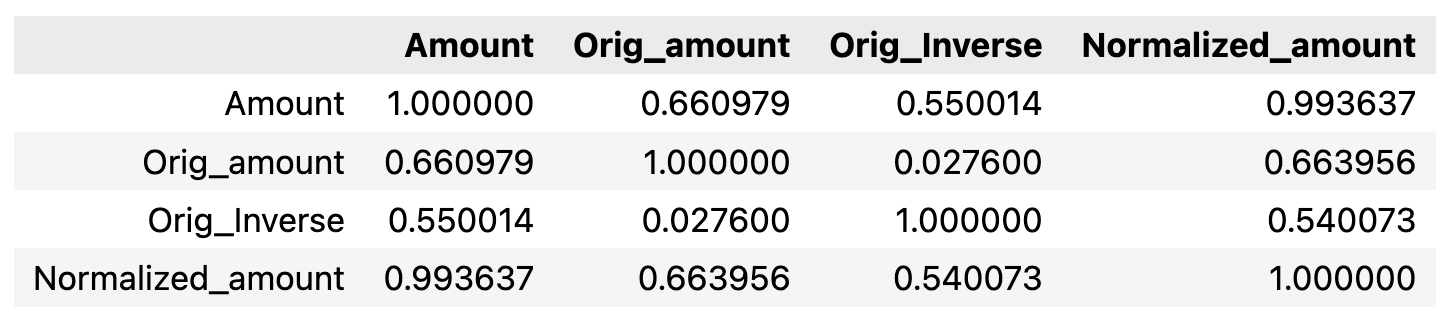
You can calculate correlation matrix and visualize it.
corr_mat_df = checker.corr(
    df, [
    "Original_amount_USD",
    "Original_amount_orig_ccy",
    "Original_Inverse_USD",
    "Normalized_amount_USD",
    ]
)
corr_mat_df
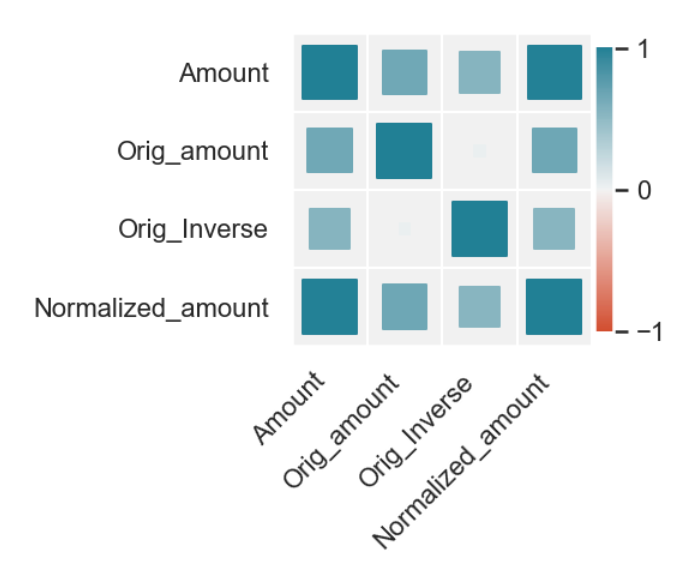
The color indicate whether the correlation coefficient is postive or negtive, the size of each square indicate the absolute value of each coefficient.
visualize_corr(
    checker, df, [
    "Original_amount_USD",
    "Original_amount_orig_ccy",
    "Original_Inverse_USD",
    "Normalized_amount_USD",
    ]
)
5. Metrics
Here are the detailed explanations and examples of all metrics provided in pydeequ.
Reference: https://aws.amazon.com/cn/blogs/big-data/test-data-quality-at-scale-with-deequ/
| Metric | Description | Example |
|---|---|---|
| ApproxCountDistinct | Approximate number of distinct value, computed with HyperLogLogPlusPlus sketches. | ApproxCountDistinct("review_id") |
| ApproxQuantile | Approximate quantile of a distribution. | ApproxQuantile("star_rating", quantile = 0.5) |
| ApproxQuantiles | Approximate quantiles of a distribution. | ApproxQuantiles("star_rating", quantiles = [0.25, 0.5, 0.75]) |
| Completeness | Fraction of non-null values in a column. | Completeness("review_id") |
| Correlation | Pearson correlation coefficient, measures the linear correlation between two columns. The result is in the range [-1, 1], where 1 means positive linear correlation, -1 means negative linear correlation, and 0 means no correlation. | Correlation("total_votes", "star_rating") |
| CountDistinct | Number of distinct values. | CountDistinct("review_id") |
| Distinctness | Fraction of distinct values of a column over the number of all values of a column. Distinct values occur at least once. Example: [a, a, b] contains two distinct values a and b, so distinctness is 2/3. | Distinctness("review_id") |
| Entropy | Entropy is a measure of the level of information contained in an event (value in a column) when considering all possible events (values in a column). It is measured in nats (natural units of information). Entropy is estimated using observed value counts as the negative sum of (value_count/total_count) * log(value_count/total_count). Example: [a, b, b, c, c] has three distinct values with counts [1, 2, 2]. Entropy is then (-1/5*log(1/5)-2/5*log(2/5)-2/5*log(2/5)) = 1.055. | Entropy("star_rating") |
| Maximum | Maximum value. | Maximum("star_rating") |
| Mean | Mean value; null values are excluded. | Mean("star_rating") |
| Minimum | Minimum value. | Minimum("star_rating") |
| MutualInformation | Mutual information describes how much information about one column (one random variable) can be inferred from another column (another random variable). If the two columns are independent, mutual information is zero. If one column is a function of the other column, mutual information is the entropy of the column. Mutual information is symmetric and nonnegative. | MutualInformation(["total_votes", "star_rating"]) |
| Size | Number of rows in a DataFrame. | Size() |
| Sum | Sum of all values of a column. | Sum("total_votes") |
| UniqueValueRatio | Fraction of unique values over the number of all distinct values of a column. Unique values occur exactly once; distinct values occur at least once. Example: [a, a, b] contains one unique value b, and two distinct values a and b, so the unique value ratio is 1/2. | UniqueValueRatio("star_rating") |
| Uniqueness | Fraction of unique values over the number of all values of a column. Unique values occur exactly once. Example: [a, a, b] contains one unique value b, so uniqueness is 1/3. | Uniqueness("star_rating") |
Release history Release notifications | RSS feed


Download files
Download the file for your platform. If you're not sure which to choose, learn more about installing packages.
Source Distribution
Built Distribution
Filter files by name, interpreter, ABI, and platform.
If you're not sure about the file name format, learn more about wheel file names.
Copy a direct link to the current filters
File details
Details for the file vivqu-0.0.6.tar.gz.
File metadata
- Download URL: vivqu-0.0.6.tar.gz
- Upload date:
- Size: 932.4 kB
- Tags: Source
- Uploaded using Trusted Publishing? No
- Uploaded via: twine/4.0.1 CPython/3.9.12
File hashes
| Algorithm | Hash digest | |
|---|---|---|
| SHA256 |
69b1566d2f6bf980eae4c5b0c42139c928d11a99677d1b75610334748e8cbcca
|
|
| MD5 |
b2c9884722bcf1a49be53bcae85a9ec9
|
|
| BLAKE2b-256 |
4dedcd96b0138661521e2d7a01207bd4136397efea7df501aa496f39c9d7ccc0
|
File details
Details for the file vivqu-0.0.6-py3-none-any.whl.
File metadata
- Download URL: vivqu-0.0.6-py3-none-any.whl
- Upload date:
- Size: 24.4 kB
- Tags: Python 3
- Uploaded using Trusted Publishing? No
- Uploaded via: twine/4.0.1 CPython/3.9.12
File hashes
| Algorithm | Hash digest | |
|---|---|---|
| SHA256 |
7d0b7d58b9e99cab7a9344e94bff1576880fc5def40e1b2449437b3cb24575e9
|
|
| MD5 |
807b07b57ea73367047d40d939e273da
|
|
| BLAKE2b-256 |
03c7e2409e7aa6553f0dce15ca97b7f28e24d90eedb98a2357a5bf35dcd1252b
|


