A lightweight, high-performance transactional web-dashboard designed for advanced data flow analytics, multi-stage routing visualization, and statistical risk audit, and AI Agent trace visualization. Built natively on top of Streamlit, Pandas, and Plotly.
Try It Out
- Interactive Demo: Streamlit stateless site
- Source Code: GitHub Repository
If you find this project useful, please drop a ⭐ to support its development!
Key Features
- Flat Transaction Processing Engine: Optimized for fast processing of un-aggregated logs.
- Global Session Synchronization: Seamlessly locks metric column selections, typography sizes, and alignments across all workspace views.
- Advanced Graph Matrix Analytics: Includes high-fidelity stacked charts, multi-dimensional Parcats layouts, Density Matrices, and automated IQR risk audit profiling tools.
- AI Agent Trace & Observability: Native templates designed to map LLM chain-of-thought routing, monitor token consumption footprints, and catch execution latency anomalies.
Supported Data Formats
VizzBreeze is engine-agnostic and designed to fit natively into standard AI development, LLM engineering, and data science workflows. It accepts un-aggregated raw logs in three major formats:
- JSON / JSONL (Recommended for LLM Ops): Direct export pipelines from frameworks like LangChain, CrewAI, AutoGen, or custom OpenAI/Anthropic API telemetry wrappers.
- CSV: High-performance, lightweight flat tabular traces optimized for rapid Pandas processing and memory efficiency.
- Excel (.xlsx / .xls): Native spreadsheet ingestion for transactional business analysis, enterprise risk audits, and manual log reviews.
(Note: Data Ingestion Tip: Regardless of the source format, the internal Streamlit ingestion engine normalizes all uploads into an optimized pandas.DataFrame configuration to guarantee backward compatibility with all graph matrices).
Built With
1 - Plotly - Core interactive charting engine. 2 - Streamlit - Cloud infrastructure and web UI framework. 3 - Pandas - High-performance data structures and data analysis engine.
Quick Start
1. Standard Python / Jupyter & Google Colab Usage
VizzBreeze functions process un-aggregated raw DataFrames and return native Plotly figures, making them fully compatible with Jupyter views and pipeline automation:
import vizzbreeze as vb
import pandas as pd
To explore the dashboard features instantly, you can use the pre-configured spreadsheet 1. sample_(ai_traces).xlsx or download the interactive Quickstart Jupyter Notebook directly from this repository to run all graph matrices in one click.

JupyterLab/ VS Code Layout Tip
If you are rendering massive multi-agent chains with a large width (e.g., width_px=1300) and notice that the chart gets clipped at the screen boundary without horizontal scrollbars, simply run this native cell macro in your notebook right before displaying the chart to force responsive layout scrolling:
%%html
<style>
.jp-OutputArea-output, .output_subarea {
    overflow-x: auto !important;
}
</style>
(Note: In cloud environments like Google Colab, horizontal scrolling works natively out-of-the-box without any tweaks).
2. Standalone Web Control Room Execution
If you prefer a full-scale interactive UI with global layout sync, just open your local terminal and run:
vizzbreeze-run
(Note: If you explicitly need to run VizzBreeze in cloud environments like Google Colab, please use a secure SSH/Port-forwarding tunnel to bypass iframe infrastructure limits).
To explore the dashboard features instantly, you can use the pre-configured spreadsheet 1. sample_(ai_traces).xlsx located in the root folder of this repository. Just drag and drop it into the sidebar upload zone!
Accessing Built-in Color Palettes
You don't need to hardcode HEX styles. Access the corporate design system directly from the package configuration:
import vizzbreeze as vb

# View all available palette names
print(vb.COLOR_PALETTES.keys())

# Extract a specific synchronized list of colors
chosen_colors = vb.COLOR_PALETTES["Consulting Premium"]
Core Analytical Tabs
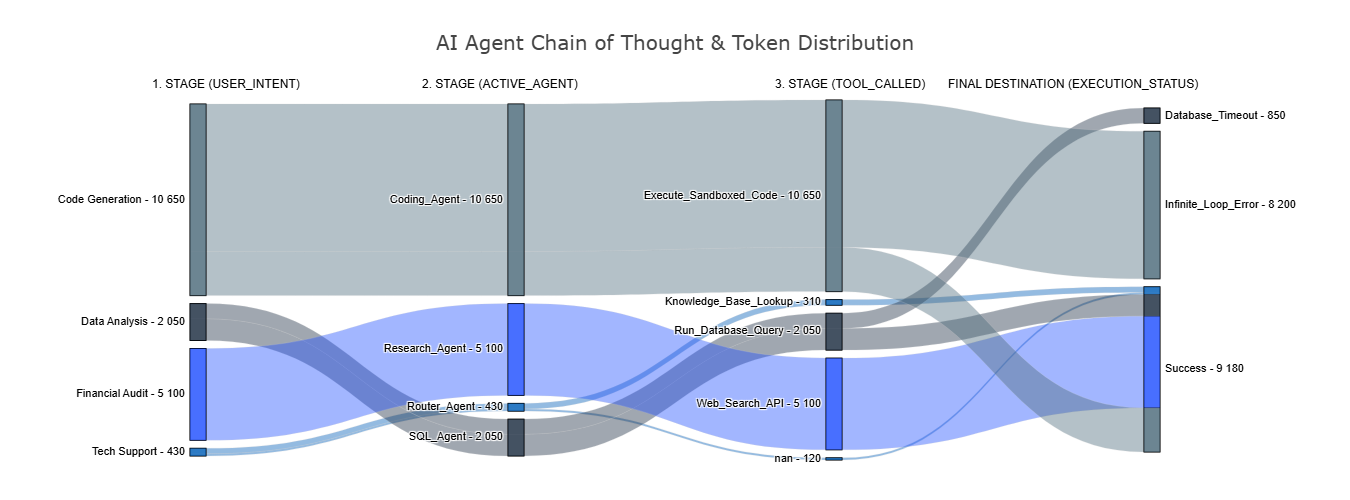
- Flows: Explore multi-stage category paths (e.g., LLM chain-of-thought: Intent ➔ Agent ➔ Tool) with thin, light axis labels and custom high-contrast hover tooltips.
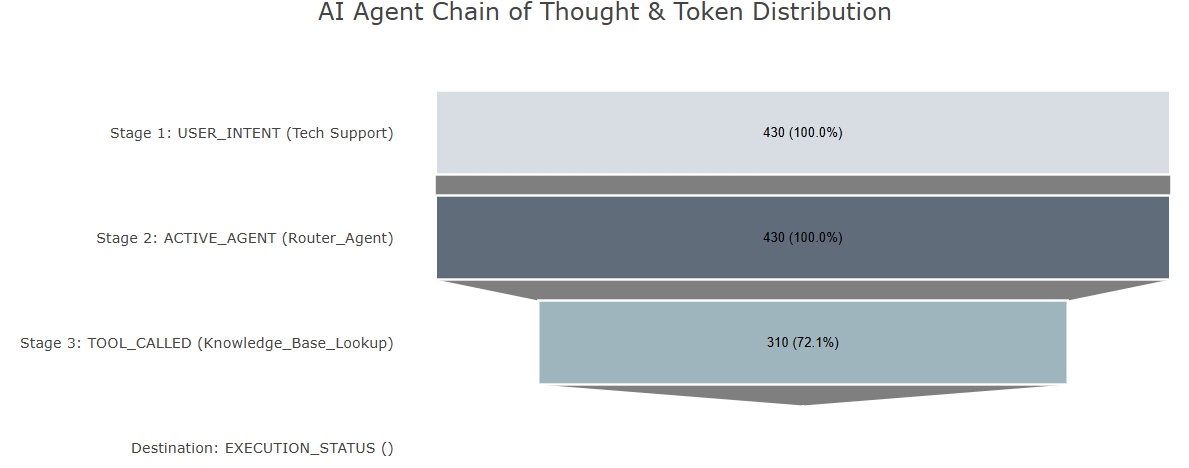
- Funnel: Track progressive conversion drops along specific workflow layers.
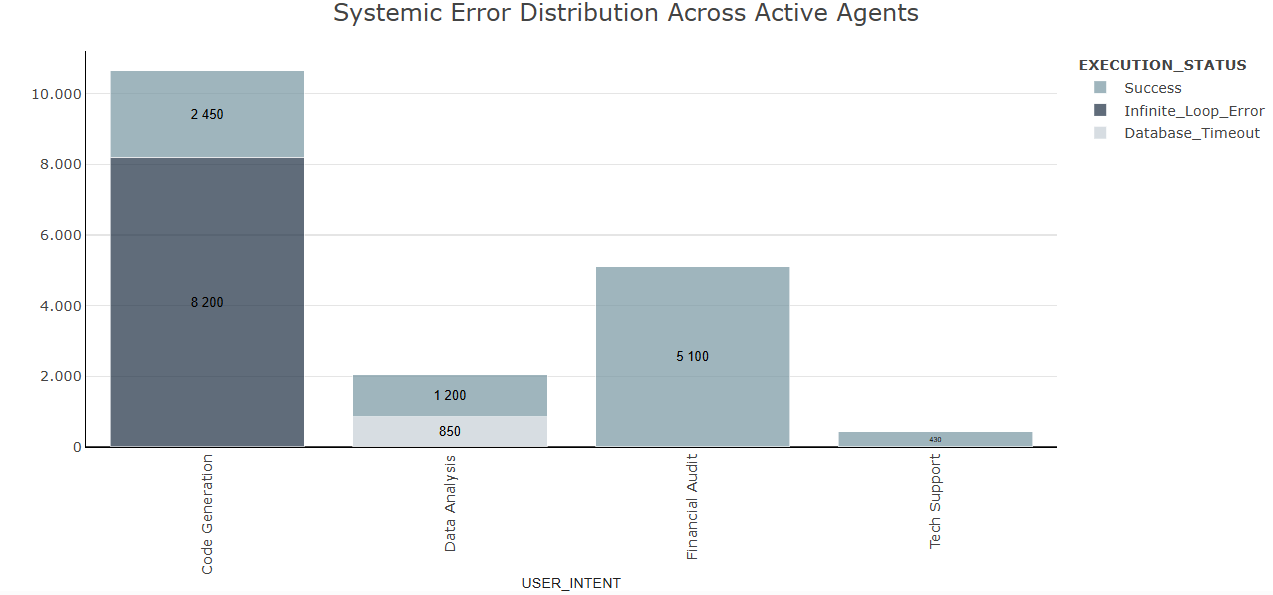
- Structural Breakdown: Classic stacked column bar charts configured with responsive axis titles that update on the fly based on active filters.
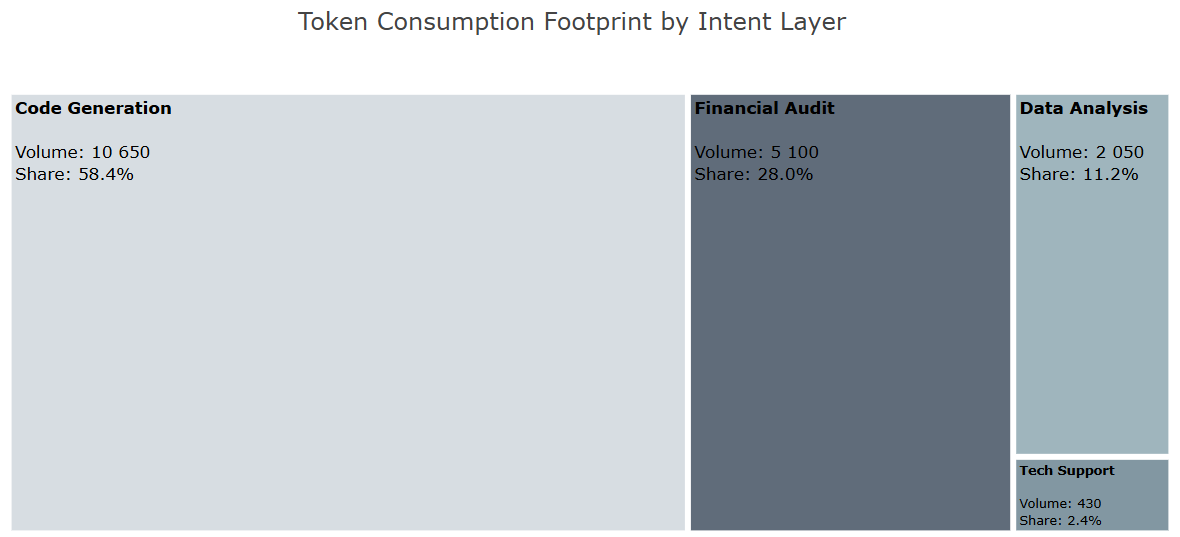
- Bento: An asymmetrical modular tile framework designed to compress complex multi-level dimensions (like Token Consumption Footprints) into a clean, prioritized grid dashboard.
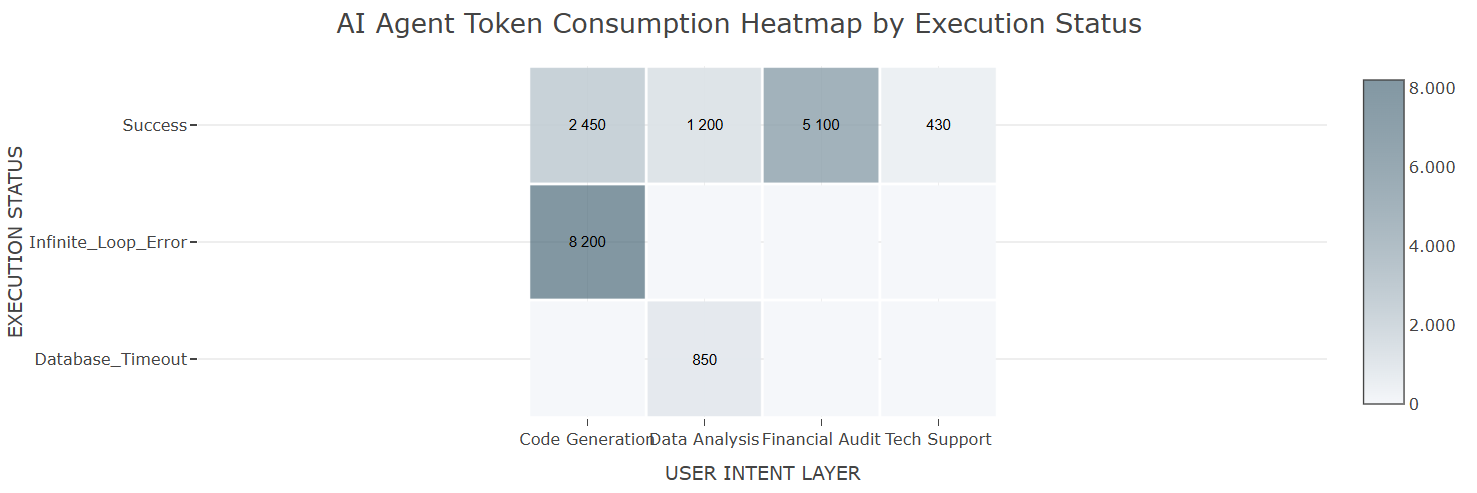
- Heatmap: High-density dashboard to scan cluster intersections instantly.
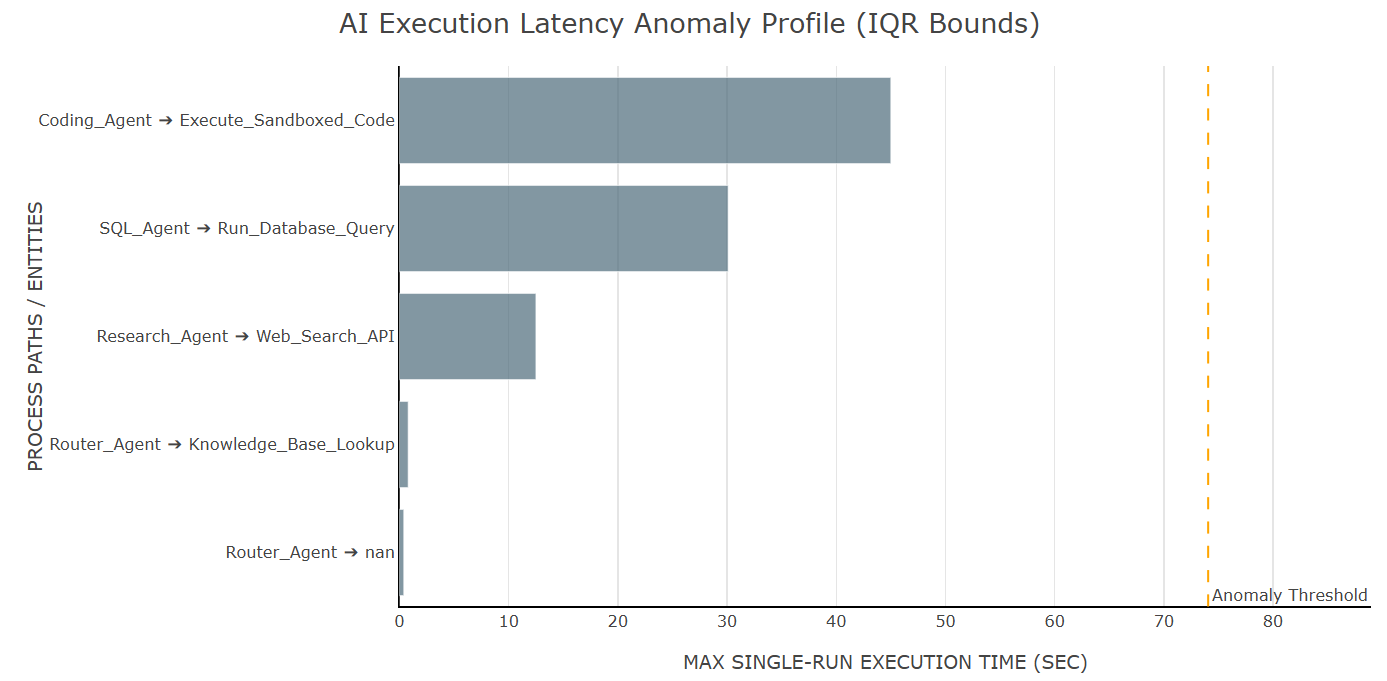
- Anomaly & Risk Audit: Automated statistical anomaly profiling that detects execution latency spikes and infinite loop outliers without freezing the browser engine.
Core Functions API Reference & Parameter Mapping
All visualization engines are fully modular, accept un-aggregated raw pandas.DataFrame inputs, and return native plotly.graph_objects.Figure interactive objects.
1. Flows
flow_fig = vb.generate_parcats(
    df=df,
    stage_nodes=['user_intent', 'active_agent', 'tool_called'],
    target_node='execution_status',
    value_col='tokens_used',  # Flows will scale by token consumption!
    chart_title="AI Agent Chain of Thought & Token Distribution",
    selected_palette=chosen_colors,
    title_size=20,
    width_px=1600,
    height_px=500,
    title_x = 0.5
)

flow_fig.show()
https://raw.githubusercontent.com/mila-alex-cloud/my-project-assets/main/pic1.png
2. Funnel
fig = vb.generate_funnel_chart(
    df=df,
    stage_nodes=['user_intent', 'active_agent', 'tool_called'],
    target_node='execution_status',
    value_col='tokens_used',

    selected_route_dict={
        'user_intent':'Tech Support', 'active_agent':'Router_Agent', 'tool_called':'Knowledge_Base_Lookup'

    },
    selected_palette=chosen_colors,
    unit_divider=1.0,
    force_shuffle=True,
    chart_title="AI Agent Chain of Thought & Token Distribution",
    width_px=1050,
    height_px=500,
    title_x=0.5
)

fig.update_layout(
    margin=dict(l=350, r=20, t=100, b=50)
)
https://raw.githubusercontent.com/mila-alex-cloud/my-project-assets/main/pic2.png
3. Structural Breakdown
stage_nodes=['user_intent']
target_node='execution_status'
value_col='tokens_used'

fig = vb.generate_stacked_bar_chart(
    df=df,
    stage_nodes=stage_nodes,
    target_node=target_node,
    value_col=value_col,
    selected_palette=chosen_colors,
    unit_divider=1.0,
    force_shuffle=True,
    chart_title="Systemic Error Distribution Across Active Agents",
    width_px=1600,
    height_px=500,
    title_x = 0.5
)
fig.update_layout(
    margin=dict(l=100, r=20, t=50, b=120),
    yaxis=dict(title="")
)

fig.show()
https://raw.githubusercontent.com/mila-alex-cloud/my-project-assets/main/pic3.png
4. Bento
fig = vb.generate_bento_treemap(
    df=df,
    id_col='user_intent',
    value_col=value_col,
    selected_palette=chosen_colors,
    unit_divider=1.0,
    force_shuffle=True,
    chart_title="Token Consumption Footprint by Intent Layer",
    width_px=1050,
    height_px=500,
    title_x = 0.5
)
fig.update_layout(
    margin=dict(l=50, r=20, t=50, b=50)
    )
fig.show()
https://raw.githubusercontent.com/mila-alex-cloud/my-project-assets/main/pic4.png
5. Heatmap
fig = vb.generate_heatmap(
    df=df,
    x_col='user_intent',
    y_col='execution_status',
    value_col='tokens_used',
    selected_palette=chosen_colors,
    chart_title="AI Agent Token Consumption Heatmap by Execution Status",
    show_annot=True,
    width_px=1050,
    height_px=500,
    title_x=0.5
)

fig.update_xaxes(title_text="USER INTENT LAYER")
fig.update_yaxes(title_text="EXECUTION STATUS")

fig.update_layout(
    margin=dict(l=150, r=20, t=50, b=50)
)
fig.show()
https://raw.githubusercontent.com/mila-alex-cloud/my-project-assets/main/pic5.png
6. Anomaly & Risk Audit
anomaly_fig = vb.generate_outliers_chart(
    df=df,
    stage_col='active_agent',
    target_col='tool_called',
    value_col='execution_time_sec',
    agg_func='max',
    chart_title="AI Execution Latency Anomaly Profile (IQR Bounds)",
    selected_palette=chosen_colors,
    width_px=1050,
    height_px=500,
    title_x=0.5
)

anomaly_fig.update_xaxes(title_text="MAX SINGLE-RUN EXECUTION TIME (SEC)")

anomaly_fig.update_layout(
    margin=dict(l=310, r=20, t=50, b=50)
)
anomaly_fig.show()
https://raw.githubusercontent.com/mila-alex-cloud/my-project-assets/main/pic6.png
Requirements
- Python >= 3.9
- Streamlit >= 1.35.0
- Pandas >= 2.1.0
- Plotly >= 5.18.0
Roadmap
- Advanced Data Preprocessing Pipeline: Implementing automated anomaly tracking and missing value imputation optimized for multi-source financial and operational data arrays.
- Interactive Risk Metrics: Adding features for deep data analysis, including volatility tracking, anomaly detection, and custom structural breakdown widgets.
- Large-Scale Data Engineering: Adding chunks-based data loading and optimization widgets to seamlessly process unaggregated corporate and industrial datasets exceeding 500MB.
- Enterprise Stability & Testing: Expanding code verification with an extensive pytest suite to achieve 85%+ test coverage for secure local CLI execution.
License
This project is licensed under the GNU General Public License v3 (GPLv3) - see the LICENSE file for details.
1 maintainer

Metadata
1 maintainer
Release files for vizzbreeze 1.1.4
For a detailed explanation of source distributions (sdists) and built distributions (wheels), please see the package formats documentation.
Source distribution (sdist)
| File | Size | Uploaded | |
|---|---|---|---|
| vizzbreeze-1.1.4.tar.gz | 3.1 MB | Details |
Built distribution (wheel)
| File | Interpreter | ABI | Platform | Reset |
|---|---|---|---|---|
| vizzbreeze-1.1.4-py3-none-any.whl | Python 3 | none | any | Details |
Total release size: 3.1 MB
Release files / vizzbreeze-1.1.4.tar.gz
| Download URL | vizzbreeze-1.1.4.tar.gz |
|---|---|
| Size | 3.1 MB |
| Tags | Source |
|
SHA-256 checksum How to use checksums |
c02ea3a90e879643b06ec8c4fd1a9d784bacdcf1e67c9005511c6252f64b2fe7
|
|
BLAKE2b-256 checksum How to use checksums |
74e71238a730b722cfef2785569881e7a9c089bed132e12485f83f29118f803a
|
| Upload date | |
|
Uploaded using Trusted Publishing? What is trusted publishing? |
No |
| Uploaded via |
twine/7.0.0 CPython/3.12.7
|
Release files / vizzbreeze-1.1.4-py3-none-any.whl
| Download URL | vizzbreeze-1.1.4-py3-none-any.whl |
|---|---|
| Size | 41.8 kB |
| Tags | Python 3 |
|
SHA-256 checksum How to use checksums |
105501664c3513b1189b8fd23593b61e6d649bb857bffc532bc9a0ef2f7f96be
|
|
BLAKE2b-256 checksum How to use checksums |
c9bdd7f5cd88e18acf698db1bdd923687e43f872c15a4830aa714946fc695673
|
| Upload date | |
|
Uploaded using Trusted Publishing? What is trusted publishing? |
No |
| Uploaded via |
twine/7.0.0 CPython/3.12.7
|