
nvtop for vLLM — an interactive terminal dashboard for vLLM serving performance

Project description
vllmstat
nvtop for vLLM — a zero-infrastructure interactive terminal dashboard for vLLM serving performance.
Why vllmstat?
The standard observability stack for vLLM is Prometheus + Grafana: powerful, but heavyweight. You need a running Prometheus instance, a Grafana server, a dashboard JSON import, and a browser tab — all just to see whether your inference server is busy.
vllmstat replaces that for day-to-day monitoring. One command, no infrastructure. It scrapes the vLLM server's built-in /metrics endpoint directly and renders everything in your terminal, refreshing every second.
There is one other terminal tool (vllm-top on PyPI), but it is a basic watch-style metrics printer: no interactivity, no GPU panel, no latency percentiles, no speculative-decoding acceptance, no KV-compression ratio. vllmstat fills that gap — it is closer to nvtop than to watch.
Install
pip install vllmstat
Or with pipx (isolated install, globally available):
pipx install vllmstat
Or run it ephemerally without installing:
uvx vllmstat
Usage
Point it at your vLLM server and it starts immediately:
vllmstat
# Different host / port
vllmstat --url http://my-gpu-host:8000
# Try the dashboard without a real server (uses synthetic data)
vllmstat --mock
# Print a single snapshot as JSON and exit — useful for scripting / alerting
vllmstat --once --json
Key bindings
| Key | Action |
|---|---|
q |
Quit |
p |
Pause / resume polling |
g |
Toggle GPU panel on/off |
r |
Reset the SESSION averages |
+ / = |
Halve the refresh interval (faster) |
- |
Double the refresh interval (slower) |
Flags
| Flag | Default | Description |
|---|---|---|
-u / --url |
http://localhost:8000 |
vLLM server base URL |
--metrics-path |
/metrics |
Prometheus metrics path |
-i / --interval |
1.0 |
Refresh interval in seconds |
--api-key |
— | Bearer token (VLLM_API_KEY env var also accepted) |
--no-gpu |
— | Disable the GPU panel entirely |
--mock |
— | Use synthetic data — no server required |
--once --json |
— | Print one snapshot as JSON and exit |
--version |
— | Print version and exit |
What it shows
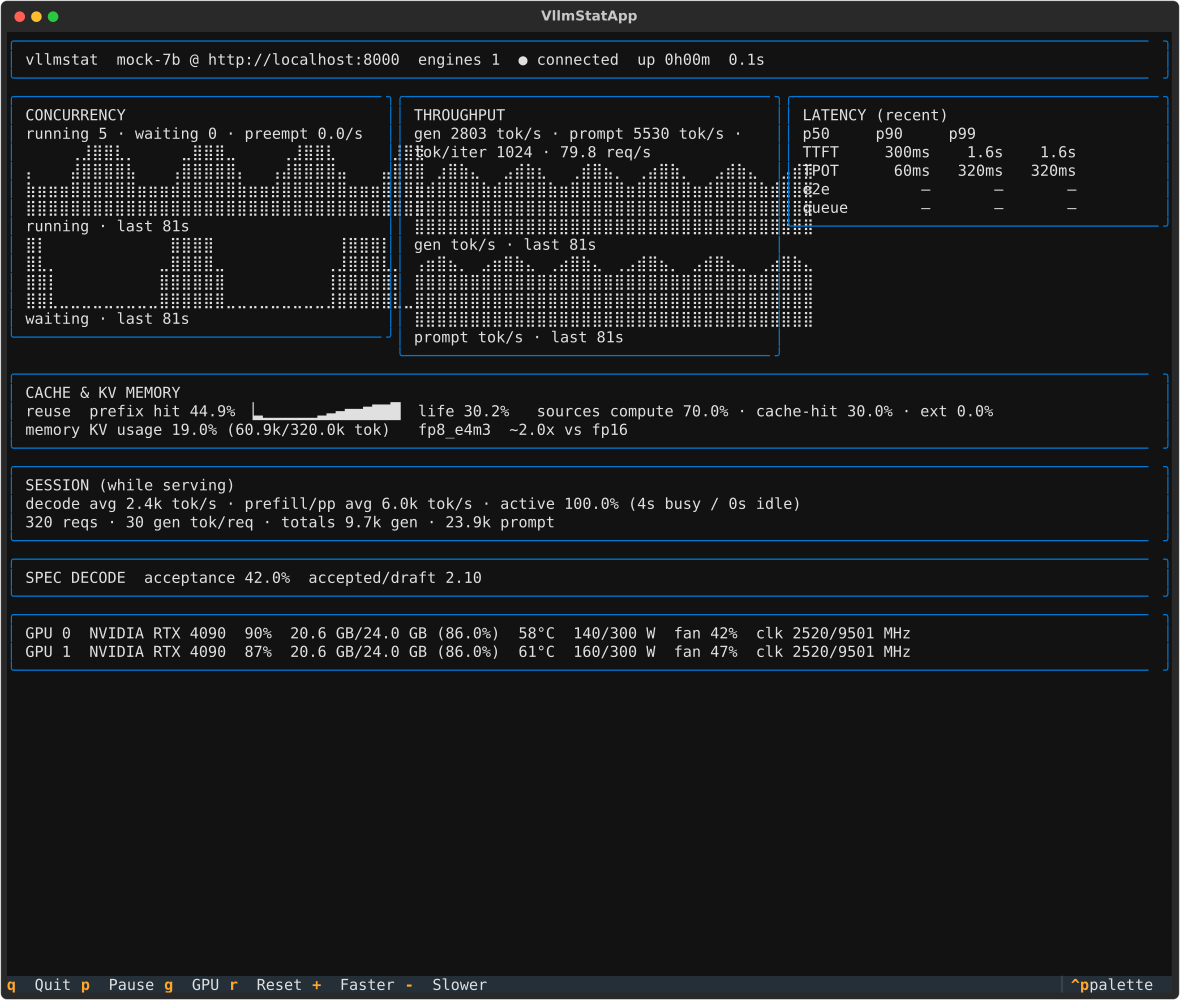
- Concurrency — running requests, waiting queue depth, preemption rate, with mini sparklines.
- Throughput — generation tok/s, prompt tok/s, tokens per iteration, requests per second.
- Session (while serving) — running averages accumulated only while the server is actively serving (i.e. requests in flight, so idle gaps don't dilute the numbers): average decode and prefill/pp tok/s, the busy/idle split with the fraction of time spent serving, total requests completed, average generated tokens per request, and cumulative generated/prompt token totals. Press
rto reset these counters at any time. - Cache & KV memory — prefix-cache hit rate (windowed and lifetime), token-source breakdown (compute vs. cache-hit vs. external KV transfer), KV-cache utilisation percentage, KV-cache capacity in tokens, and — when a quantised KV dtype is detected — the dtype (
fp8_e4m3,turboquant_k3v4_nc, …), effective compression ratio vs. fp16, and how much fp16 memory the model's full context would require. For example, aturboquant k3v4cache shows ~4.6× compression and a note that the full context would need 25.8 GB in fp16. - Latency percentiles — TTFT, TPOT, end-to-end, and queue-wait time, each at p50 / p90 / p99, computed over a rolling window so recent spikes are visible immediately.
- Speculative decoding — acceptance rate, accepted tokens per draft, per-position acceptance (when the server reports it). The panel is hidden when spec-decode is not active.
- Per-GPU stats — utilisation %, VRAM used / total, temperature, power draw vs. limit, clocks, fan. Works on NVIDIA, AMD, and Intel GPUs (see GPU support for what each vendor reports). Multi-GPU and mixed-vendor hosts show every GPU.
GPU support
vllmstat detects each GPU's vendor from its DRM device and reads stats from the best source available. Every field degrades to — when its source is unavailable, and a missing driver, tool, or sysfs file never crashes the dashboard — it just shows less.
| Vendor | What works | Prerequisite |
|---|---|---|
| NVIDIA | Full: util %, VRAM used/total, temperature, power draw/limit, SM & memory clocks, fan %. | NVIDIA driver. The bundled nvidia-ml-py uses NVML; nvidia-smi on PATH is used as a fallback. |
| AMD | Full: util %, VRAM used/total, temperature, power draw/limit, fan RPM, clock — via the amdgpu kernel driver's sysfs. |
amdgpu kernel driver (in-tree on modern Linux). Install ROCm's amd-smi (or rocm-smi) for richer data; it's used automatically when on PATH. |
| Intel | Utilisation %, temperature, power draw/limit, GPU clock, fan RPM, and total VRAM out of the box via the xe/i915 sysfs — no root. VRAM used via DRM fdinfo — see the note below for the root requirement. The xe driver exposes no memory clock, so the clock shows just the GPU clock (clk 2800 MHz, no /mem). |
xe or i915 kernel driver. No extra tools needed; util/temp/power/clock/fan/total-VRAM work as a normal user. Root (or matching UID) is only needed for VRAM used. |
Intel utilisation (no root): the xe driver exposes no gpu_busy_percent, but it does expose a world-readable, cumulative GT-idle counter at …/device/tile*/gt*/gtidle/idle_residency_ms. vllmstat reads it each refresh and derives util % as 100 × (1 − Δidle_ms / Δwall_ms), taking the busiest GT (a card can have a render/compute gt0 and a media gt1). No root, no extra tools. Utilisation needs two refreshes to produce its first delta; Intel power is derived from the energy1_input counter, so it likewise appears one refresh after the panel opens.
Intel VRAM (DRM fdinfo, root-gated): the xe driver exposes no mem_info_vram_* in sysfs, so vllmstat reads VRAM used the way nvtop does — by summing each GPU client's drm-resident-vram0 from /proc/<pid>/fdinfo/<fd>. Reading another process's fdinfo requires a matching UID or root, so VRAM used appears only when vllmstat can read the vLLM worker processes (see Getting GPU stats below). Without that access used-VRAM shows — with a (VRAM needs root) hint. Total VRAM, however, comes from the GPU's largest prefetchable PCI BAR (…/device/resource) — world-readable, no root — so the memory percentage and used/total render as soon as used-VRAM is available.
Getting GPU stats
The GPU panel works with no configuration on all three vendors — but each vendor sources its data differently, and one case (Intel VRAM) can need elevated permissions. Here's how to get the full set.
NVIDIA
Install the NVIDIA driver. Utilisation, VRAM used/total, temperature, power draw/limit, and SM/memory clocks all come from NVML via the bundled nvidia-ml-py; if NVML isn't importable, vllmstat falls back to nvidia-smi on your PATH. No root required.
AMD
The in-tree amdgpu kernel driver (present on modern Linux) exposes utilisation, VRAM used/total, temperature, power, and fan via sysfs out of the box — no root, no extra tools. For richer data, install ROCm's amd-smi (or the older rocm-smi); vllmstat uses whichever is on your PATH automatically.
Intel (Arc / xe or i915)
Utilisation, temperature, power, clocks, and fan work out of the box, no root — they come from world-readable sysfs (utilisation from the GT idle-residency counter; see GPU support above for details).
VRAM is the one exception. It's read per-process from DRM fdinfo, so it only appears when vllmstat can read the GPU process. If your vLLM runs as root (e.g. inside Docker) while you run vllmstat as a normal user, VRAM shows — with a (VRAM needs root) hint. To get VRAM, either:
-
Run
vllmstatas the same user as vLLM (simplest if you launched vLLM yourself), or -
Run
vllmstatas root to match a root-owned vLLM:sudo $(which vllmstat) # for a pipx install: sudo ~/.local/bin/vllmstat
Note:
kernel.yama.ptrace_scopedoes not help here. Reading another user'sfdinfois blocked by a cross-UIDptrace_may_accesscheck that requires a matching UID or root — relaxingptrace_scopedoes not change it.
Keeping vllmstat current
pipx upgrade vllmstat
Remote and containerised setups
vllmstat does not need to run on the GPU machine. If no GPU is reachable from the machine you run it on — no NVML/nvidia-smi, no amdgpu/xe sysfs — for example when monitoring a remote server or when vLLM is isolated in its own GPU container, the GPU panel shows "unavailable" and all the vLLM telemetry panels (concurrency, throughput, cache, latency, spec-decode) continue to work normally. Pass --no-gpu to suppress the panel entirely.
Requirements
- Python ≥ 3.10
- A running vLLM server that exposes its Prometheus
/metricsendpoint (all vLLM ≥ 0.4 deployments do this by default) - A GPU driver — optional, only needed for the GPU panel. NVIDIA (NVML/
nvidia-smi), AMD (amdgpu), or Intel (xe/i915); see GPU support.
Development
See CONTRIBUTING.md.
License
Apache-2.0. See LICENSE.
Release history Release notifications | RSS feed


Download files
Download the file for your platform. If you're not sure which to choose, learn more about installing packages.
Source Distribution
Built Distribution
Filter files by name, interpreter, ABI, and platform.
If you're not sure about the file name format, learn more about wheel file names.
Copy a direct link to the current filters
File details
Details for the file vllmstat-0.2.3.tar.gz.
File metadata
- Download URL: vllmstat-0.2.3.tar.gz
- Upload date:
- Size: 329.3 kB
- Tags: Source
- Uploaded using Trusted Publishing? No
- Uploaded via: twine/6.2.0 CPython/3.13.7
File hashes
| Algorithm | Hash digest | |
|---|---|---|
| SHA256 |
c07893bc082d5226a9a196c8ea3991dd65f3276f63b1a2964aa98a754780cd63
|
|
| MD5 |
88f69434714230ba8a0c5a7b4a4b93a0
|
|
| BLAKE2b-256 |
d794a1b493fbc6a339d718019d774e37d041d8456c928ae8791df1d5884518e3
|
File details
Details for the file vllmstat-0.2.3-py3-none-any.whl.
File metadata
- Download URL: vllmstat-0.2.3-py3-none-any.whl
- Upload date:
- Size: 44.7 kB
- Tags: Python 3
- Uploaded using Trusted Publishing? No
- Uploaded via: twine/6.2.0 CPython/3.13.7
File hashes
| Algorithm | Hash digest | |
|---|---|---|
| SHA256 |
4a5d504d634f050fb9cebd5a6d4c8d444b395287adae4b83851d79153a9b60d4
|
|
| MD5 |
b024ca4c290f142e5d4c98c3cede6365
|
|
| BLAKE2b-256 |
4334ed760e1245fef383ca8584aa65f3d26f5b2f571a04e655299193002e6f8c
|






